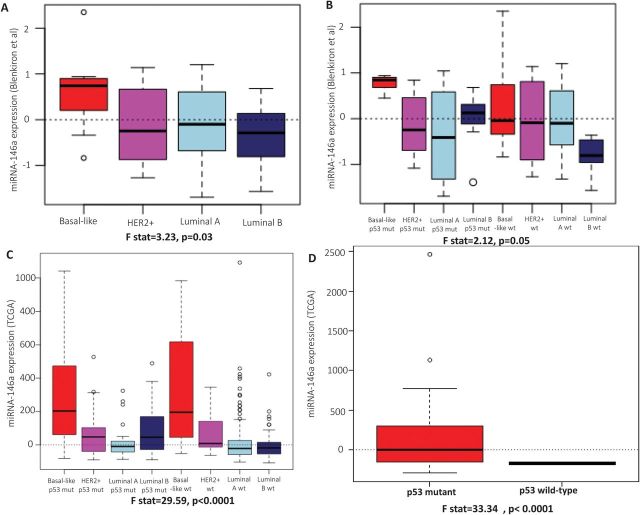
Fig. 3.
miR-146a expression in primary tumors. (A) The box plots represent the expression of miR-146a in basal-like, HER2+, luminal A and luminal B subtypes of primary breast cancers in the Blenkiron et al. dataset. (B) The box plots represent the expression of miR-146a in basal-like, HER2+, luminal A and luminal B subtypes of primary breast cancers stratified by the expression of p53 in the Blenkiron et al. dataset. (C) The box plots represent the expression of miR-146a in basal-like, HER2+, luminal A and luminal B subtypes of primary breast cancers stratified by the expression of p53 in TCGA dataset. (D) The box plots represent the expression of miR-146a in basal-like breast cancers stratified by the functional mutational status of p53 in TCGA dataset. The solid bars in the middle of boxes indicate the median levels of expression.

