

Abstract
An observational cohort analysis was conducted within the Surveillance, Prevention, and Management of Diabetes Mellitus (SUPREME-DM) DataLink, a consortium of 11 integrated health-care delivery systems with electronic health records in 10 US states. Among nearly 7 million adults aged 20 years or older, we estimated annual diabetes incidence per 1,000 persons overall and by age, sex, race/ethnicity, and body mass index. We identified 289,050 incident cases of diabetes. Age- and sex-adjusted population incidence was stable between 2006 and 2010, ranging from 10.3 per 1,000 adults (95% confidence interval (CI): 9.8, 10.7) to 11.3 per 1,000 adults (95% CI: 11.0, 11.7). Adjusted incidence was significantly higher in 2011 (11.5, 95% CI: 10.9, 12.0) than in the 2 years with the lowest incidence. A similar pattern was observed in most prespecified subgroups, but only the differences for persons who were not white were significant. In 2006, 56% of incident cases had a glycated hemoglobin (hemoglobin A1c) test as one of the pair of events identifying diabetes. By 2011, that number was 74%. In conclusion, overall diabetes incidence in this population did not significantly increase between 2006 and 2010, but increases in hemoglobin A1c testing may have contributed to rising diabetes incidence among nonwhites in 2011.
Keywords: diabetes mellitus, glycated hemoglobin, hemoglobin A1c, incidence, trends
Diabetes prevalence and incidence have increased steadily for several decades, resulting in large increases in the total burden of diabetes-related morbidity. The annual cost of diabetes is estimated to be $245 billion in the United States (1) and $548 billion worldwide (2). Although the prevalence of diabetes is expected to continue to grow (3), recent national estimates suggest that long-term increases in the prevalence of obesity, a major risk factor for type 2 diabetes, may have slowed or stopped (4, 5). Perhaps as a result, the incidence and prevalence of diabetes in the United States increased through 2005 (6, 7), but US surveillance data do not reveal increased incidence from 2009 to 2011 (8). Studies from Denmark and the United Kingdom have suggested that diabetes incidence is no longer increasing, although the United Kingdom study indicated a decline only in the last year of a 20-year trend (9, 10). Few other population-based estimates of diabetes incidence trends exist.
Following a report from an International Expert Committee (11), the American Diabetes Association endorsed the use of glycated hemoglobin or hemoglobin A1c (HbA1c) testing for diabetes diagnosis in 2010, and the World Health Organization followed with a similar recommendation (12). In 1 study, Mostafa et al. (13) evaluated HbA1c for detection of impaired glucose regulation but did not estimate the impact of the test on diabetes incidence. Whether the adoption of HbA1c testing for diabetes diagnosis has affected either the number of people being tested or resulting diabetes incidence has not, to our knowledge, been assessed in real-world clinical practice.
To fill these crucial knowledge gaps, we analyzed data on more than 7 million adults to track trends in diabetes incidence and glucose and HbA1c testing from 2006 through 2011, overall and in prespecified subgroups.
METHODS
Setting
Surveillance, Prevention, and Management of Diabetes Mellitus (SUPREME-DM) is a multicenter consortium of 11 member organizations of the HMO Research Network. The SUPREME-DM consortium collected data on approximately 16 million individuals of all ages in 10 US states from 2005 to 2011. Health plans participating in SUPREME-DM include the Geisinger Health System (Pennsylvania), Group Health (Washington), HealthPartners (Minnesota), the Henry Ford Health System (Michigan), the Marshfield Clinic (Wisconsin), and the Kaiser Permanente regions of Colorado, Northern California, Southern California, Hawaii, Georgia, and the Northwest (Oregon and Washington). Research institutions embedded in these organizations have developed a distributed virtual data warehouse that contains information on demographic characteristics, numbers of prescriptions filled at outpatient pharmacies, laboratory results, and diagnosis codes from outpatient and inpatient encounters from their clinical and administrative data systems (14). The database developed within SUPREME-DM from the virtual data warehouse, the SUPREME-DM DataLink, has been previously described (15). As a result of enrolling persons insured through Medicare and Medicaid, the SUPREME-DM study population has been shown to be representative of the respective service areas (16). The protocol for the current study was approved by the Kaiser Permanente Colorado Institutional Review Board.
Participants
For each calendar year during 2006–2011, we identified all members of the participating health systems who were aged 20 years or older, were enrolled for the full calendar year, and had at least 18 consecutive months of enrollment prior to January 1 of that year. Persons who were not enrolled for the full calendar year were excluded from both the numerator and the denominator for that year. Members were also excluded from the numerator and denominator for a given year if they met the criteria for diabetes in prior years (based on laboratory values, filled prescriptions, or diagnosis codes—see below).
Ascertainment of diabetes
We used diagnoses from inpatient and ambulatory-care data, laboratory data, and pharmacy data in the electronic health records to identify persons with diabetes. Specifically, we considered diabetes onset to be indicated by 1 inpatient diagnosis (International Classification of Diseases, Ninth Revision, Clinical Modification, codes 250.x, 357.2, 366.41, and 362.01–362.07) or any combination of 2 of the following events occurring within 24 months of each other: 1) HbA1c concentration ≥6.5% (≥48 mmol/mol); 2) fasting plasma glucose concentration ≥126 mg/dL (≥7.0 mmol/L); 3) random plasma glucose concentration ≥200 mg/dL (≥11.1 mmol/L); 4) an outpatient diagnosis code for diabetes (same as inpatient codes); and 5) any dispensation of antihyperglycemic medication (filled prescription). Two events of the same type (such as 2 HbA1c tests, 2 diagnoses, or 2 filled prescriptions) would qualify, but only if the 2 events occurred on separate days. Diagnosis date was assigned as the latter date of the pair of events. For example, a person with an HbA1c concentration of 7.5% (57 mmol/mol) followed by an outpatient diagnosis of diabetes would be identified as having diabetes onset on the date of the outpatient diagnosis. When a pair of events spanned more than 1 calendar year, the incident case was assigned to the year in which the second event was identified.
Prescription medications were included if they were from the following drug classes: sulfonylureas, insulins, biguanides, thiazolidinediones, α-glucosidase inhibitors, incretin mimetics, meglitinides, amylin analogs, and dipeptidyl peptidase inhibitors. However, 2 prescription dispensations of metformin or thiazolidinediones with no other indication of diabetes were not counted, because these agents can be used for either diabetes prevention or treatment of polycystic ovarian syndrome. Events that were identified during pregnancy were excluded from consideration. A review of the performance of methods for identifying diabetes using administrative data found a median positive predictive value of 92% (17), and 1 subsequent large study determined that 2 or more indicators of diabetes (laboratory tests, diagnoses, or filled prescriptions) produced a positive predictive value of 96% (18). Similar methods have been shown to accurately identify diabetes in various settings, including several of our study sites (19–24).
Statistical analysis
For each calendar year, we created a cohort that met our participant criteria (see above) and monitored for new diabetes cases. Incident diabetes cases in any given year were excluded from subsequent calendar years. We compared health-plan members who developed diabetes with those who did not using Student's t test for continuous measures and the χ2 test for categorical variables, calculating 2-sided P values to 4 decimal places because of the extremely large sample size. For comparability with Centers for Disease Control and Prevention data and because results did not change materially, we calculated diabetes incidence per 1,000 adults rather than per 1,000 person-years.
These rates were estimated overall and for prespecified subgroups of age (20–34, 35–44, 45–54, 55–64, 65–74, 75–84, or ≥85 years), sex, race/Hispanic ethnicity (Hispanic of any race, non-Hispanic white, non-Hispanic black, Asian, Native American/Alaska Native, Hawaiian/Pacific Islander), and body mass index (BMI) (weight (kg)/height (m)2; <20, 20–24.9, 25–29.9, 30–34.9, or ≥35). Data on race/Hispanic ethnicity were self-reported or administratively collected. Although exact methods varied by site, these data were standardized into the same categories as part of the virtual data warehouse creation process (14). Mean BMI was calculated on the basis of height and weight measurements contained in the electronic health record for each calendar year. Incidence estimates by racial/ethnic group and BMI category were limited to persons with available data (78% of the population for race/ethnicity and 66% for BMI).
We estimated incidence rates in total (adjusted for the age and sex of the SUPREME-DM population), by sex (adjusted for age), by age category (adjusted for sex), and by race/ethnicity and BMI category (adjusted for age and sex) using a generalized linear model with a Poisson distribution that assumes the variance is proportional to the mean, clustered by health system to account for variation between systems, with sample size as an offset variable to account for differential sample size over the years and between sites. We used 95% confidence intervals for the point estimates produced by the models to compare annual incidence changes over the 6 years of the study period. This approach produces conservative conclusions, especially when year-to-year estimates are highly correlated (25). We report the proportion of the annual cohort with an HbA1c test only, fasting plasma glucose (FPG) test only, or both glycemia tests during each year prior to or as part of the pair of events that defined diabetes. We compared the trends in HbA1c or fasting glucose testing rates using the Cochran-Armitage test for trend. All analyses were conducted using SAS, version 9.2 (SAS Institute, Inc., Cary, North Carolina).
RESULTS
Diabetes incidence
From the eligible population of 6,973,346 adult health-plan members with 27.9 million person-years of follow-up, we identified 289,050 (4.1%) who developed diabetes between 2006 and 2011 (Table 1). Persons who developed diabetes were significantly older (mean age = 56 years vs. 44 years; P < 0.0001), were more likely to be male (52% vs. 46%; P < 0.0001), and had a higher mean BMI (33 vs. 28; P < 0.0001) than those who did not develop diabetes.
Table 1.
Characteristics of Adult Health-Plan Members in 10 US States, by Diabetes Incidence Status, SUPREME-DM Project, 2006–2011
| Characteristic | Incident Diabetes (n = 289,050) |
No Diabetes (n = 6,684,296) |
Overall (n = 6,973,346) |
|||
|---|---|---|---|---|---|---|
| % | Mean (SD) | % | Mean (SD) | % | Mean (SD) | |
| Total % | 4.1 | 95.9 | 100 | |||
| Duration of follow-up, years | 3.1 (1.7) | 4.1 (1.9) | 4.0 (1.9) | |||
| Age, years | 56.0 (13.6) | 44.2 (16.5) | 44.7 (16.4) | |||
| Age range, years | ||||||
| 20–34 | 5.5 | 31.8 | 30.8 | |||
| 35–44 | 14.5 | 21.1 | 20.8 | |||
| 45–54 | 27.0 | 20.6 | 20.9 | |||
| 55–64 | 26.8 | 14.5 | 15.0 | |||
| 65–74 | 16.1 | 6.9 | 7.3 | |||
| 75–84 | 8.3 | 3.8 | 3.9 | |||
| ≥85 | 1.9 | 1.3 | 1.3 | |||
| Female sex | 48.2 | 53.6 | 53.4 | |||
| Body mass indexb | 32.6 (7.8) | 28.1 (6.6) | ||||
| Body mass index category | ||||||
| <20 | 1.2 | 3.4 | 3.3 | |||
| 20–24.9 | 9.3 | 19.7 | 19.2 | |||
| 25–29.9 | 23.6 | 22.9 | 22.9 | |||
| 30–34.9 | 22.6 | 11.9 | 12.4 | |||
| ≥35 | 25.3 | 8.0 | 8.7 | |||
| Unknown | 18.0 | 34.1 | 33.4 | |||
| Race/ethnicity | ||||||
| Non-Hispanic white | 45.8 | 44.3 | 44.4 | |||
| Non-Hispanic black | 10.4 | 7.1 | 7.2 | |||
| Hispanic (any race) | 20.3 | 16.5 | 16.6 | |||
| Asian | 11.8 | 9.0 | 9.1 | |||
| Native American/Alaska Native | 0.5 | 0.4 | 0.4 | |||
| Hawaiian/Pacific Islander | 1.6 | 0.8 | 0.9 | |||
| Unknown | 9.6 | 22.0 | 21.5 | |||
Abbreviations: SD, standard deviation; SUPREME-DM, Surveillance, Prevention, and Management of Diabetes Mellitus.
All comparisons between incident diabetes and no diabetes were statistically significant at P < 0.0001.
Weight (kg)/height (m)2.
Adjusted incidence rates and 95% confidence intervals are shown in Table 2. The age- and sex-adjusted population incidence of diabetes was relatively flat. Only the rate in 2011 (11.5 per 1,000 adults, 95% confidence interval (CI): 10.9, 12.0) was significantly different from any other year's, and then it only differed in comparison with the 2 years that had the lowest rates (2008: 10.3 per 1,000 adults (95% CI: 9.8, 10.7); 2009: 10.4 per 1,000 adults (95% CI: 10.2, 10.7)). A similar pattern was observed in all prespecified age, sex, BMI, and race/ethnicity subgroups. Non-Hispanic blacks, Asians, Hawaiians/Pacific Islanders, and Native Americans/Alaska Natives all had significantly higher incidence rates in 2011 than in the lowest-rate years; rates in non-Hispanic whites were not significantly different in any year-to-year comparison. Annual crude incidences of diabetes for these subgroups are shown in Web Figure 1 (available at http://aje.oxfordjournals.org/).
Table 2.
Diabetes Incidencea Among Adult Health-Plan Members in 10 US States, by Year, SUPREME-DM Project, 2006–2011
| Variable | Year |
|||||||||||
|---|---|---|---|---|---|---|---|---|---|---|---|---|
| 2006 |
2007 |
2008 |
2009 |
2010 |
2011 |
|||||||
| Incidence | 95% CI | Incidence | 95% CI | Incidence | 95% CI | Incidence | 95% CI | Incidence | 95% CI | Incidence | 95% CI | |
| All participantsb | 10.8 | 10.2, 11.4 | 11.3 | 11.0, 11.7 | 10.3 | 9.8, 10.7 | 10.4 | 10.2, 10.7 | 10.7 | 10.0, 11.5 | 11.5 | 10.9, 12.0 |
| Sexc | ||||||||||||
| Male | 12.4 | 11.6, 13.3 | 13.1 | 12.5, 13.8 | 12.1 | 11.7, 12.6 | 12.1 | 11.7, 12.5 | 11.9 | 11.3, 12.6 | 12.4 | 12.0, 12.8 |
| Female | 9.9 | 9.2, 10.6 | 10.4 | 10.0, 10.8 | 9.3 | 9.0, 9.6 | 9.1 | 8.8, 9.4 | 9.3 | 8.5, 10.1 | 10.0 | 9.4, 10.5 |
| Age group, yearsd | ||||||||||||
| 20–34 | 1.9 | 1.7, 2.1 | 1.8 | 1.7, 2.0 | 1.8 | 1.7, 1.9 | 1.7 | 1.6, 1.8 | 1.7 | 1.6, 1.8 | 1.9 | 1.7, 2.1 |
| 35–44 | 5.7 | 5.3, 6.2 | 6.1 | 5.7, 6.6 | 5.9 | 5.5, 6.3 | 6.0 | 5.6, 6.4 | 5.8 | 5.4, 6.3 | 6.4 | 6.1, 6.8 |
| 45–54 | 10.7 | 9.9, 11.6 | 11.5 | 10.7, 12.4 | 10.8 | 10.1, 11.5 | 10.7 | 10.0, 11.4 | 11.0 | 10.1, 11.9 | 11.7 | 11.0, 12.4 |
| 55–64 | 16.3 | 15.1, 17.5 | 16.9 | 16.1, 17.7 | 15.5 | 14.7, 16.4 | 15.7 | 15.0, 16.5 | 15.7 | 14.4, 17.0 | 16.4 | 15.6, 17.2 |
| 65–74 | 20.5 | 18.6, 22.5 | 21.4 | 20.0, 22.9 | 18.7 | 17.9, 19.6 | 18.6 | 17.5, 19.8 | 18.7 | 15.9, 19.9 | 19.1 | 18.4, 19.9 |
| 75–84 | 21.5 | 18.8, 24.5 | 22.5 | 20.4, 24.9 | 18.6 | 17.2, 20.1 | 18.1 | 16.5, 19.8 | 17.4 | 15.6, 19.4 | 19.3 | 18.0, 20.6 |
| ≥85 | 19.7 | 17.3, 22.5 | 19.7 | 17.3, 22.6 | 16.8 | 14.6, 19.3 | 14.8 | 13.0, 16.9 | 14.8 | 12.3, 17.7 | 14.3 | 11.7, 17.4 |
| Body mass indexb,e | ||||||||||||
| <20 | 6.1 | 4.8, 7.7 | 5.3 | 4.3, 6.7 | 4.3 | 3.4, 5.4 | 3.8 | 3.1, 4.7 | 3.8 | 3.1, 4.7 | 3.7 | 3.0, 4.6 |
| 20–24.9 | 5.8 | 5.3, 6.4 | 5.5 | 5.1, 5.9 | 4.7 | 4.4, 5.1 | 4.7 | 4.4, 4.9 | 4.6 | 4.1, 5.1 | 4.9 | 4.6, 5.2 |
| 25–29.9 | 9.2 | 7.8, 10.9 | 8.9 | 7.5, 10.6 | 8.2 | 6.9, 9.8 | 8.3 | 6.9, 9.9 | 8.3 | 6.9, 10.0 | 8.8 | 7.3, 10.6 |
| 30–34.9 | 16.9 | 14.9, 19.1 | 16.7 | 14.5, 19.1 | 15.5 | 13.6, 17.8 | 15.7 | 13.6, 18.0 | 16.1 | 13.9, 18.5 | 16.9 | 14.6, 19.6 |
| ≥35 | 32.9 | 30.8, 35.3 | 33.1 | 31.2, 35.0 | 31.9 | 30.4, 33.6 | 31.8 | 30.2, 33.5 | 32.1 | 30.5, 33.7 | 33.8 | 31.9, 35.8 |
| Race/ethnicityb | ||||||||||||
| Non-Hispanic white | 9.4 | 8.2, 10.8 | 9.8 | 8.6, 11.2 | 8.8 | 7.7, 10.0 | 8.7 | 7.6, 10.0 | 8.3 | 7.2, 9.7 | 8.3 | 7.3, 9.4 |
| Non-Hispanic black | 13.1 | 11.7, 14.6 | 14.1 | 13.2, 15.1 | 12.8 | 12.0, 13.7 | 12.1 | 11.1, 13.2 | 12.8 | 11.9, 13.9 | 14.5 | 13.5, 15.7 |
| Hispanic | 14.9 | 13.2, 16.8 | 15.6 | 14.3, 17.0 | 14.4 | 13.3, 15.6 | 14.3 | 13.2, 15.5 | 14.2 | 12.9, 15.7 | 15.6 | 14.3, 16.9 |
| Asian | 12.7 | 11.3, 14.4 | 14.1 | 13.1, 15.2 | 12.3 | 11.2, 13.4 | 12.3 | 11.4, 13.2 | 12.7 | 10.9, 14.7 | 14.9 | 13.8, 16.1 |
| Native American/Alaska Native | 13.4 | 11.7, 15.3 | 16.0 | 14.2, 18.1 | 11.0 | 9.8, 12.4 | 13.5 | 12.3, 14.9 | 14.2 | 12.9, 15.8 | 16.2 | 14.7, 17.8 |
| Hawaiian/Pacific Islander | 22.6 | 19.5, 26.2 | 22.3 | 18.1, 27.5 | 17.1 | 13.7, 21.2 | 19.2 | 16.3, 22.6 | 25.7 | 22.6, 29.3 | 28.4 | 25.2, 32.0 |
Abbreviations: CI, confidence interval; SUPREME-DM, Surveillance, Prevention, and Management of Diabetes Mellitus.
Incidence per 1,000 adult members.
Adjusted for the age and sex of the SUPREME-DM population.
Adjusted for the age of the SUPREME-DM population.
Adjusted for the sex of the SUPREME-DM population.
Weight (kg)/height (m)2.
The total eligible adult population (i.e., the denominator) increased by approximately 1% per year throughout the study period (Web Table 1). Years of enrollment prior to the analyzed year grew steadily over time. The age, sex, and BMI distributions of the annual populations were stable, but the proportion of the total population that was nonwhite increased between 2006 and 2011, especially among incident cases of diabetes. Mean FPG and HbA1c values were also stable over time.
Glycemia testing by year
The proportion of members with glycemia testing in a calendar year increased over the 6-year study period, from 74.0% to 84.5% (up to and including the date of incident diabetes) for new diabetes cases and from 24.6% to 30.1% among persons without diabetes (Figure 1). In 2006, among patients with incident diabetes, 18.0% had had only FPG tests prior to incident diabetes or as one of the pair of events that defined incident diabetes, while 11.3% had had only HbA1c tests, and 44.6% had had both tests. By 2011, those testing rates had shifted to 10.1% with only FPG, 19.7% with only HbA1c, and 54.7% with both tests, with distinct changes occurring in 2010 and accelerating in 2011 (P for trend < 0.0001). The pattern was similar (but at lower rates) among those without diabetes. The pattern was also nearly identical among persons who developed diabetes in all age, sex, BMI, and race/ethnicity subgroups (Web Table 2). These same secular trends in testing were observed among persons who did not develop diabetes in all age, sex, BMI, and race/ethnicity subgroups, albeit at lower testing rates (not shown).
Figure 1.
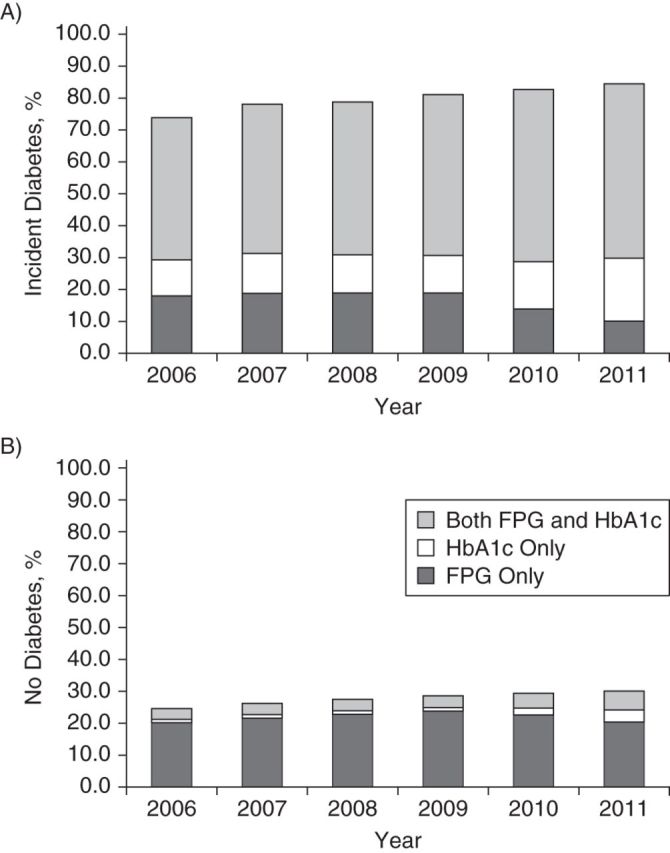
Proportions of adult health-plan members diagnosed with incident diabetes (A) and no diabetes (B) by means of hemoglobin A1c (HbA1c) and fasting plasma glucose (FPG) testing (prior to or at diagnosis) in 10 US states, SUPREME-DM Project, 2006–2011. SUPREME-DM, Surveillance, Prevention, and Management of Diabetes Mellitus.
DISCUSSION
These data provide contemporary population-based estimates of diabetes incidence among 7 million adults insured through 11 US integrated health-care delivery systems. The incidence rates we found are higher than those seen in US surveillance data that are based on self-reported diagnoses (8), probably because our comprehensive definition included persons with diagnostic laboratory values who might not yet have been diagnosed by their clinician. Our incidence rates are also higher than those found in other epidemiologic cohorts, but they are based on larger and more diverse sampling frames than have previously been used (26, 27).
As expected, diabetes incidence varied widely as a function of age, BMI, and race/ethnicity in our data. Overall, we found no evidence that diabetes incidence increased between 2006 and 2010, although incidence may have increased slightly in 2011. These findings were consistent across all 11 sites and are consistent with those of other studies. For example, in the United Kingdom, diabetes incidence increased steadily from 2006 through 2009 before declining slightly in 2010 (10). In Denmark, diabetes incidence stabilized between 2004 and 2007 (9). The US Centers for Disease Control and Prevention reported a dramatic increase in annual new self-reported cases of diabetes from 1997 to 2007, but little change from 2008 to 2010 (28). A recent study of self-reported diabetes incidence in New York City also suggested a decline between 2004 and 2008 (29).
The development of diabetes is a biological process, the precise timing of which can only be accurately assessed with frequently repeated glycemia testing. Our incidence estimates included cases identified from occasional testing given during the course of clinical care, as well as other indications for diabetes, such as provider-assigned diagnosis codes or filled prescriptions for diabetes medications. Identification of diabetes in observational data is subject to variation in screening practices, and several considerations could influence year-to-year screening and subsequent identification of new cases of diabetes. The proportion of our sample that received any form of glycemia testing increased over time, which may itself increase incidence, but changes in how diabetes was identified clinically may also have played a role in our findings.
In 2010, the American Diabetes Association added HbA1c testing as a means of diagnosing diabetes, having previously recommended only FPG tests, random glucose tests (if symptoms were present), or oral glucose tolerance tests as valid diagnostic tools (30). This was somewhat controversial, because these laboratory tests measure different phenotypes of dysglycemia that do not perfectly overlap (31, 32). Other studies have suggested that at the recommended diagnostic threshold of 6.5% (48 mmol/mol), HbA1c concentration would identify fewer persons with diabetes than FPG or oral glucose tolerance tests (33–35). In our data, however, the shift in testing practice to greater use of HbA1c testing corresponded with an increase in incidence. Though some of the rise in incidence could be attributed to increased testing, the shift in testing methods from FPG to HbA1c may also have introduced artifactual variation in incidence rates. Because this was an observational analysis, we could not determine whether the people identified as having diabetes through FPG testing would also have been identified at the same point in time through HbA1c testing or vice versa.
The increase in overall testing also makes drawing conclusions about the impact of changes in testing modality difficult, and the degree to which this shift in practice may have contributed to variation in diabetes incidence deserves careful consideration. It is possible that some patients who would have been identified with earlier methods are now being missed by increased reliance on HbA1c testing or that patients now being identified would have been missed by previous methods. Although such patients would probably be diagnosed eventually, the resulting delay in treatment could affect the long-term development of diabetes complications. Studies evaluating the question of diagnostic delays and the impact on future public health are critically needed. Furthermore, because we applied the same criteria for incidence throughout the study, it is possible that we “diagnosed” persons with HbA1c values prior to 2010 who would not have been recognized as having diabetes. There is evidence that many clinicians were already using HbA1c for diagnosis prior to 2010 (36), but because we required 2 separate events to define diabetes and the sole use of HbA1c for diagnosis was infrequent, it is unlikely that incidence rates in the earlier years were artificially raised by premature application of the HbA1c criterion.
Trends in incidence rates during the study period differed by race and ethnicity. It is widely known that blacks, Asians, Hispanics, and Native Americans are at higher risk for developing diabetes, and in a previous study of one of the participating health plans, Karter et al. (37) reported a much higher incidence of diabetes in many minority groups (e.g., Pacific Islanders, South Asians, Filipinos, Koreans) than in non-Hispanic whites. However, this does not explain why incidence rates would increase over time within select racial or ethnic groups. Investigators in the Diabetes Prevention Program reported higher HbA1c values among non-Hispanic black, Hispanic, American Indian, and Asian participants compared with whites both before and after adjustment for a wide range of possible confounders (38). Our findings are consistent with the concern that HbA1c values vary by race/ethnicity at similar glucose levels.
Another potential concern is that true incidence may be rising faster than observed incidence but will appear to decline or remain flat over time if the cohort is from a closed population (fixed cohort) in which the persons at highest risk are identified early in the observation period, leaving only lower-risk individuals in the at-risk pool (39). Although the 11 health-care systems in our study form a dynamic cohort insofar as new members can join every year, we observed that the mean number of years of health-plan enrollment prior to the analysis year of the at-risk pool increased between 2006 and 2011, from 6.2 years to 9.4 years. This suggests that our analyses preferentially followed the same individuals over time, and that the enrollment of new members at risk for diabetes occurred more slowly than the disenrollment of existing at-risk members. Conversely, longer periods of observation would allow greater opportunity for screening and diagnosis, which should produce higher incidence rates in later years—the opposite of what we found. Thus, despite aging, we suspect that longer-term members who had not yet developed diabetes were probably at lower risk than those diagnosed in earlier years, because those at greatest risk had already been recognized, and the age-specific incidence rates we observed were consistent with this hypothesis. This may explain the flat trend in incidence from 2006 through 2011.
Strengths of our study include the sample size of nearly 7 million adult health-plan members from geographically distributed integrated health-care delivery systems across the United States; defined populations that included both Medicare and Medicaid patients; the availability of electronic health record data; and analysis of 7 consecutive years of health-plan enrollment. Observational studies have inherent limitations, including the aforementioned variation in screening and detection over time. Other differences among our study sites in how electronic health records are used and variation in the completeness of data could lead to inaccuracies, potentially biasing our estimates of diabetes incidence. However, our findings were consistent across the participating sites.
To match our estimates to the methodology used by the Centers for Disease Control and Prevention, we considered Hispanic persons to be Hispanic regardless of race, based primarily on self-reported information. Approximately 22% of our population were missing data on race/ethnicity, and 34% were missing BMI data. Rates of missing data differed over time and across sites, which could have biased our incidence estimates to the extent that characteristics of members with missing data are also associated with diabetes risk. The membership of our health-care systems may not generalize to less integrated systems or to uninsured individuals, and market penetration varies among the systems included. However, previous studies have shown that members of integrated health-care systems reflect the diversity of the populations from which they are drawn and demonstrate similar disenrollment rates regardless of diabetes status (16, 40, 41). We did not distinguish between cases of type 1 diabetes and cases of type 2 diabetes, but limiting our study population to adults aged 20 years or older meant that the vast majority of incident cases were type 2. Our case definition included abnormal laboratory values regardless of the presence of a physician-coded diagnosis. Thus, it is possible that some patients with incident cases had undiagnosed diabetes. To identify incident diabetes, we required an extended period of prior health-plan eligibility without any indication of diabetes. This would have excluded some incident cases that did not meet the pre-eligibility criterion, resulting in more conservative incidence estimates.
In conclusion, we found no significant increase in diabetes incidence among adults between 2006 and 2010 and a small but significant increase in 2011 that coincided with a shift in diagnostic testing practice from FPG testing to use of the HbA1c assay. The increase in diabetes incidence rates was significant only among racial and ethnic minority groups and among very obese persons. As a result, disparities in diabetes incidence by race and ethnicity appear to be increasing over time. Future trends in overall diabetes incidence in the United States are likely to be driven in part by the aging of the population, increasing racial and ethnic diversity, and persistently high rates of obesity. Furthermore, because diabetes remission is rare and mortality among people with diabetes is declining (42), prevalence continues to increase. The diabetes epidemic is far from over.
Supplementary Material
ACKNOWLEDGMENTS
Author affiliations: Center for Health Research, Kaiser Permanente Northwest, Portland, Oregon (Gregory A. Nichols); Institute for Health Research, Kaiser Permanente Colorado, Denver, Colorado (Emily B. Schroeder, Stanley Xu, Marsha A. Raebel, John F. Steiner); Division of Research, Kaiser Permanente Northern California, Oakland, California (Andrew J. Karter); Division of Diabetes Translation, Centers for Disease Control and Prevention, Atlanta, Georgia (Edward W. Gregg); HealthPartners Institute for Education and Research, Minneapolis, Minnesota (Jay Desai, Patrick J. O'Connor); Department of Research and Evaluation, Kaiser Permanente Southern California, Pasadena, California (Jean M. Lawrence), Group Health Research Institute, Seattle, Washington (Katherine M. Newton); Department of Endocrinology, Marshfield Clinic, Marshfield, Wisconsin (Ram D. Pathak); Center for Health Research, Kaiser Permanente Hawaii, Honolulu, Hawaii (Beth Waitzfelder); Center for Drug Safety and Effectiveness, Johns Hopkins University, Baltimore, Maryland (Jodi Segal); Henry Ford Health System, Detroit, Michigan (Jennifer Elston Lafata, Abraham Thomas); Department of Social and Behavioral Health, School of Medicine, Virginia Commonwealth University, Richmond, Virginia (Jennifer Elston Lafata); Center for Health Research, Kaiser Permanente Georgia, Atlanta, Georgia (Melissa G. Butler); and Geisinger Health System, Danville, Pennsylvania (H. Lester Kirchner).
This project was supported by grant R01HS019859 from the Agency for Healthcare Research and Quality.
We thank Teresa M. Kimes for creating and executing the programming for data extraction and analysis. We also thank Daniel Sapp and Andrea Paolino for project management. For a complete list of SUPREME-DM personnel, to whom much gratitude is owed, please see the Web Appendix.
The content of this article is solely the responsibility of the authors and does not necessarily represent the official views of the Agency for Healthcare Research and Quality or the Centers for Disease Control and Prevention. The Agency for Healthcare Research and Quality played no role in the design or execution of the study, the production of the manuscript, or the decision to submit the article for publication. The final draft for submission was approved by all authors. Dr. Gregory A. Nichols is the guarantor of this work and, as such, had full access to all of the data in the study and takes responsibility for the integrity of the data and the accuracy of the data analysis.
G.A.N. receives grant support from AstraZeneca LP (London, United Kingdom), Novartis Pharmaceuticals Corporation (East Hanover, New Jersey), Bristol-Myers Squibb Company (New York, New York), and Merck & Co. (Whitehouse Station, New Jersey). M.G.B. receives grant support from Novartis Pharmaceuticals. K.M.N. receives grant support from Otsuka Pharmaceutical, Inc. (Tokyo, Japan). The other authors report no conflicts of interest.
REFERENCES
- 1.American Diabetes Association. Economic costs of diabetes in the U.S. in 2012. Diabetes Care. 2013;36(4):1033–1046. doi: 10.2337/dc12-2625. [DOI] [PMC free article] [PubMed] [Google Scholar]
- 2.International Diabetes Federation. Diabetes Atlas. 6th ed. Brussels, Belgium: International Diabetes Federation; 2013. [Google Scholar]
- 3.Danaei G, Finucane MM, Lu Y, et al. National, regional, and global trends in fasting plasma glucose and diabetes prevalence since 1980: systematic analysis of health examination surveys and epidemiological studies with 370 country-years and 2.7 million participants. Lancet. 2011;378(9785):31–40. doi: 10.1016/S0140-6736(11)60679-X. [DOI] [PubMed] [Google Scholar]
- 4.Ogden CL, Carroll MD, Curtin LR, et al. Prevalence of overweight and obesity in the United States, 1999–2004. JAMA. 2006;295(13):1549–1555. doi: 10.1001/jama.295.13.1549. [DOI] [PubMed] [Google Scholar]
- 5.Flegal KM, Carroll MD, Kit BK, et al. Prevalence of obesity and trends in the distribution of body mass index among US adults, 1999–2010. JAMA. 2012;307(5):491–497. doi: 10.1001/jama.2012.39. [DOI] [PubMed] [Google Scholar]
- 6.Geiss LS, Pan L, Cadwell B, et al. Changes in incidence of diabetes in U.S. adults, 1997–2003. Am J Prev Med. 2006;30(5):371–377. doi: 10.1016/j.amepre.2005.12.009. [DOI] [PubMed] [Google Scholar]
- 7.Cowie CC, Rust KF, Ford ES, et al. Full accounting of diabetes and pre-diabetes in the U.S. population in 1988–1994 and 2005–2006. Diabetes Care. 2009;32(2):287–294. doi: 10.2337/dc08-1296. [DOI] [PMC free article] [PubMed] [Google Scholar]
- 8.Centers for Disease Control and Prevention. Diabetes data and trends. http://www.cdc.gov/diabetes/statistics/incidence_national.htm. Updated October 5, 2012. Accessed November 12, 2013.
- 9.Carstensen B, Kristensen JK, Ottosen P, et al. The Danish National Diabetes Register: trends in incidence, prevalence and mortality. Steering Group of the National Diabetes Register. Diabetologia. 2008;51(12):2187–2196. doi: 10.1007/s00125-008-1156-z. [DOI] [PubMed] [Google Scholar]
- 10.Holden SH, Barnett AH, Peters JR, et al. The incidence of type 2 diabetes in the United Kingdom from 1991 to 2010. Diabetes Obes Metab. 2013;15(9):844–852. doi: 10.1111/dom.12123. [DOI] [PubMed] [Google Scholar]
- 11.International Expert Committee. International Expert Committee report on the role of the A1C assay in the diagnosis of diabetes. Diabetes Care. 2009;32(7):1327–1334. doi: 10.2337/dc09-9033. [DOI] [PMC free article] [PubMed] [Google Scholar]
- 12.World Health Organization. Use of Glycated Haemoglobin (HbA1c) in the Diagnosis of Diabetes Mellitus. Geneva, Switzerland: World Health Organization; 2011. http://www.who.int/diabetes/publications/report-hba1c_2011.pdf. Accessed November 12, 2013. [Google Scholar]
- 13.Mostafa SA, Khunti K, Srinivasan BT, et al. The potential impact and optimal cut-points of using glycated haemoglobin, HbA1c, to detect people with impaired glucose regulation in a UK multi-ethnic cohort. Diabetes Res Clin Pract. 2010;90(1):100–108. doi: 10.1016/j.diabres.2010.06.008. [DOI] [PubMed] [Google Scholar]
- 14.Hornbrook MC, Hart G, Ellis JL, et al. Building a virtual cancer research organization. J Natl Cancer Inst Monogr. 2005;35:12–25. doi: 10.1093/jncimonographs/lgi033. [DOI] [PubMed] [Google Scholar]
- 15.Nichols GA, Desai J, Elston Lafata J, et al. Construction of a multisite DataLink using electronic health records for the identification, surveillance, prevention, and management of diabetes mellitus: the SUPREME-DM project. Prev Chronic Dis. 2012;9:E110. doi: 10.5888/pcd9.110311. [DOI] [PMC free article] [PubMed] [Google Scholar]
- 16.Koebnick C, Langer-Gould AM, Gould MK, et al. Sociodemographic characteristics of members of a large, integrated health care system: comparison with US Census Bureau data. Perm J. 2012;16(3):37–41. doi: 10.7812/tpp/12-031. [DOI] [PMC free article] [PubMed] [Google Scholar]
- 17.Saydah SH, Geiss LS, Tierney E, et al. Review of the performance of methods to identify diabetes cases among vital statistics, administrative, and survey data. Ann Epidemiol. 2004;14(7):507–516. doi: 10.1016/j.annepidem.2003.09.016. [DOI] [PubMed] [Google Scholar]
- 18.Zgibor JC, Orchard TJ, Saul M, et al. Developing and validating a diabetes database in a large health system. Diabetes Res Clin Pract. 2007;75(3):313–319. doi: 10.1016/j.diabres.2006.07.007. [DOI] [PubMed] [Google Scholar]
- 19.Miller DR, Safford MM, Pogach LM. Who has diabetes? Best estimates of diabetes prevalence in the Department of Veterans Affairs based on computerized patient data. Diabetes Care. 2004;27(suppl 2):B10–B21. doi: 10.2337/diacare.27.suppl_2.b10. [DOI] [PubMed] [Google Scholar]
- 20.Brown JB, Nichols GA, Glauber HS. Case-control study of 10 years of comprehensive diabetes care. West J Med. 2000;172(2):85–90. doi: 10.1136/ewjm.172.2.85. [DOI] [PMC free article] [PubMed] [Google Scholar]
- 21.Selby JV, Ray GT, Zhang D, et al. Excess costs of medical care for patients with diabetes in a managed care population. Diabetes Care. 1997;20(9):1396–1402. doi: 10.2337/diacare.20.9.1396. [DOI] [PubMed] [Google Scholar]
- 22.O'Connor PJ, Rush WA, Pronk NP, et al. Identifying diabetes mellitus or heart disease among health maintenance organization members: sensitivity, specificity, predictive value, and cost of survey and database methods. Am J Manag Care. 1998;4(3):335–342. [PubMed] [Google Scholar]
- 23.Newton KM, Wagner EH, Ramsey SD, et al. The use of automated data to identify complications and comorbidities of diabetes: a validation study. J Clin Epidemiol. 1999;52(3):199–207. doi: 10.1016/s0895-4356(98)00161-9. [DOI] [PubMed] [Google Scholar]
- 24.Baker AM, Lafata JE, Ward RE, et al. A Web-based diabetes care management support system. Jt Comm J Qual Improv. 2001;27(4):179–190. doi: 10.1016/s1070-3241(01)27016-3. [DOI] [PubMed] [Google Scholar]
- 25.Schenker N, Gentleman JF. On judging the significance of differences by examining the overlap between confidence intervals. Am Stat. 2001;55(3):182–186. [Google Scholar]
- 26.Fox CS, Pencina MJ, Meigs JB, et al. Trends in the incidence of type 2 diabetes mellitus from the 1970s to the 1990s: the Framingham Heart Study. Circulation. 2006;113(25):2914–2918. doi: 10.1161/CIRCULATIONAHA.106.613828. [DOI] [PubMed] [Google Scholar]
- 27.Brancati FL, Kao WH, Folsom AR, et al. Incident type 2 diabetes mellitus in African American and white adults: the Atherosclerosis Risk in Communities Study. JAMA. 2000;283(17):2253–2259. doi: 10.1001/jama.283.17.2253. [DOI] [PubMed] [Google Scholar]
- 28.Centers for Disease Control and Prevention. Annual number (in thousands) of new cases of diagnosed diabetes among adults aged 18–79 years, United States, 1980–2011. http://www.cdc.gov/diabetes/statistics/incidence/fig1.htm. Updated September 24, 2012. Accessed November 12, 2013.
- 29.Tabaei BP, Chamany S, Driver CR, et al. Incidence of self-reported diabetes in New York City, 2002, 2004, and 2008. Prev Chronic Dis. 2012;9:E114. doi: 10.5888/pcd9.110320. [DOI] [PMC free article] [PubMed] [Google Scholar]
- 30.American Diabetes Association. Diagnosis and classification of diabetes mellitus. Diabetes Care. 2010;33(suppl 1):S62–S69. doi: 10.2337/dc10-S062. [DOI] [PMC free article] [PubMed] [Google Scholar]
- 31.Sacks DB. A1C versus glucose testing: a comparison. Diabetes Care. 2011;34(2):518–523. doi: 10.2337/dc10-1546. [DOI] [PMC free article] [PubMed] [Google Scholar]
- 32.van 't Riet E, Alssema M, Rijkelijkhuizen JM, et al. Relationship between A1C and glucose levels in the general Dutch population: the new Hoorn Study. Diabetes Care. 2010;33(1):61–66. doi: 10.2337/dc09-0677. [DOI] [PMC free article] [PubMed] [Google Scholar]
- 33.Malkani S, Mordes JP. The implications of using hemoglobin A1C for diagnosing diabetes mellitus. Am J Med. 2011;124(5):395–401. doi: 10.1016/j.amjmed.2010.11.025. [DOI] [PMC free article] [PubMed] [Google Scholar]
- 34.Olson DE, Rhee MK, Herrick K, et al. Screening for diabetes and pre-diabetes with proposed A1C-based diagnostic criteria. Diabetes Care. 2010;33(10):2184–2189. doi: 10.2337/dc10-0433. [DOI] [PMC free article] [PubMed] [Google Scholar]
- 35.Pajunen P, Peltonen M, Eriksson JG, et al. HbA(1c) in diagnosing and predicting type 2 diabetes in impaired glucose tolerance: the Finnish Diabetes Prevention Study. Diabet Med. 2011;28(1):36–42. doi: 10.1111/j.1464-5491.2010.03183.x. [DOI] [PubMed] [Google Scholar]
- 36.Saudek CD, Herman WH, Sacks DB, et al. A new look at screening and diagnosing diabetes mellitus. J Clin Endocrinol Metab. 2008;93(7):2447–2453. doi: 10.1210/jc.2007-2174. [DOI] [PubMed] [Google Scholar]
- 37.Karter AJ, Schillinger D, Adams AS, et al. Elevated rates of diabetes in Pacific Islanders and Asian subgroups: The Diabetes Study of Northern California (DISTANCE) Diabetes Care. 2013;36(3):574–579. doi: 10.2337/dc12-0722. [DOI] [PMC free article] [PubMed] [Google Scholar]
- 38.Herman WH, Ma Y, Uwaifo G, et al. Differences in A1C by race and ethnicity among patients with impaired glucose tolerance in the Diabetes Prevention Program. Diabetes Care. 2007;30(10):2453–2457. doi: 10.2337/dc06-2003. [DOI] [PMC free article] [PubMed] [Google Scholar]
- 39.Rothman KJ, Greenland S, Lash TL. Modern Epidemiology. 3rd ed. Philadelphia, PA: Lippincott Williams & Wilkins; 2008. [Google Scholar]
- 40.Atherly A, Hebert PL, Maciejewski ML. An analysis of disenrollment from Medicare managed care plans by Medicare beneficiaries with diabetes. Med Care. 2005;43(5):500–506. doi: 10.1097/01.mlr.0000160420.82977.ae. [DOI] [PubMed] [Google Scholar]
- 41.Legorreta AP, Meng YY, Leung KM, et al. Diabetes and disenrollment in a health maintenance organization setting: a 4-year longitudinal study with a matched cohort. Diabetes Care. 1999;22(9):1487–1489. doi: 10.2337/diacare.22.9.1487. [DOI] [PubMed] [Google Scholar]
- 42.Gregg EW, Cheng YJ, Saydah S, et al. Trends in death rates among U.S. adults with and without diabetes between 1997 and 2006: findings from the National Health Interview Survey. Diabetes Care. 2012;35(6):1252–1257. doi: 10.2337/dc11-1162. [DOI] [PMC free article] [PubMed] [Google Scholar]
Associated Data
This section collects any data citations, data availability statements, or supplementary materials included in this article.