

Abstract
Senescence is a prominent solid tumor response to therapy in which cells avoid apoptosis and instead enter into prolonged cell cycle arrest. We applied a quantitative proteomics screen to identify signals that lead to therapy-induced senescence and discovered that Bcl2-associated athanogene 3 (Bag3) is up-regulated after adriamycin treatment in MCF7 cells. Bag3 is a member of the BAG family of co-chaperones that interacts with Hsp70. Bag3 also regulates major cell-signaling pathways. Mass spectrometry analysis of the Bag3 Complex revealed a novel interaction between Bag3 and Major Vault Protein (MVP). Silencing of Bag3 or MVP shifts the cellular response to adriamycin to favor apoptosis. We demonstrate that Bag3 and MVP contribute to apoptosis resistance in therapy-induced senescence by increasing the level of activation of extracellular signal-regulated kinase1/2 (ERK1/2). Silencing of either Bag3 or MVP decreased ERK1/2 activation and promoted apoptosis in adriamycin-treated cells. An increase in nuclear accumulation of MVP is observed during therapy-induced senescence and the shift in MVP subcellular localization is Bag3-dependent. We propose a model in which Bag3 binds to MVP and facilitates MVP accumulation in the nucleus, which sustains ERK1/2 activation. We confirmed that silencing of Bag3 or MVP shifts the response toward apoptosis and regulates ERK1/2 activation in a panel of diverse breast cancer cell lines. This study highlights Bag3-MVP as an important complex that regulates a potent prosurvival signaling pathway and contributes to chemotherapy resistance in breast cancer.
Cellular senescence plays an important role in determining the response of tumors to cancer therapy (1). Senescence is regulated by the p53 and p16-pRB tumor suppressor pathways and characterized by irreversible cell cycle arrest and expression of the lysosomal protein, senescence associated beta galactosidase (SA-β-gal)1. Additional characteristics of senescent cells include the presence of senescence-associated heterochromatic foci, and a senescence associated secretory phenotype (SASP) (2). Because of the SASP of senescent cells, therapy-induced senescence (TIS) may be harmful in cancer and the quantitative elimination of senescent cells could prove to be therapeutically beneficial. A recent study demonstrated that pharmacologically targeting the metabolic pathways of TIS in vivo prompted tumor regression and improved treatment outcomes (3).
A characteristic of senescent cells is their ability to resist apoptosis although the responsible mechanism is poorly understood. Impairment of apoptosis in senescent cells is associated with a poor outcome in cancer (4). Manipulation of the apoptotic machinery may serve as a therapeutic means of eliminating senescent cells with harmful SASP. It has been proposed that in senescent cells, p53 may preferentially activate genes that arrest proliferation, rather than those that facilitate apoptosis. Alternatively, resistance to apoptosis may be caused by altered expression of proteins that inhibit, promote, or mediate apoptotic cell death, such as Bcl2.
Bcl2 associated athanogene 3 (Bag3) is a member of the BAG family of chaperones that interacts with the ATPase domain of heat shock protein-70 (Hsp70). In addition to its BAG domain, Bag3 contains a WW domain and a proline-rich (PXXP) repeat, which mediates binding to partners other than Hsp70. Bag3 is expressed in response to cellular stress under the induction of HSF1 and is known to suppress apoptosis and regulate autophagy (5–6). Suppression of apoptosis may be partially explained by the ability of Bag3 to protect Bcl2 family members against proteasomal degradation (7). In normal cells, Bag3 is constitutively expressed in only a few cell types, including cardiomyocytes (8). Bag3 is overexpressed in leukemia and several solid tumors where it has been reported to sustain cell survival, induce resistance to therapy, and promote metastasis. The pleiotropic functions of Bag3 may reflect its ability to assemble scaffolding complexes, which participate in multiple signal transduction pathways (9).
In this study, we describe a role for Bag3 in regulating cancer chemotherapy induced senescence in breast cancer cell. Using a quantitative SILAC approach, we show that Bag3 is up-regulated in TIS. Mass spectrometry analysis reveals that Bag3 binds to the Major Vault Protein (MVP) complex, a protein complex strongly associated with chemotherapy resistance. We also show that Bag3 and MVP contribute to apoptosis resistance by regulating ERK1/2 signaling in senescent MCF7 and ZR751 cells.
EXPERIMENTAL PROCEDURES
Reagents
Adriamcyin and MG132 were purchased from Sigma Aldrich (St. Louis, MO). Cell culture medium was purchased from Invitrogen (Grand Island, NY). Fetal bovine serum (FBS) was purchased from Atlas Biologicals (Fort Collins, CO). Primary antibodies targeting the following: Actin, p53, ERK1/2, pERK1/2, p38 MAPK, pp38, JNK, pJNK, mTOR, pmTOR, PARP1, Atg7, Hsp70, Cathepsin D and B, G6P, EIF3, Cyclin D1, pRb, Caspase 7, LAMP1, Lysotracker, Ubiquitin, and S6 kinase were from Cell Signaling (Danvers, MA). Antibodies specific for Bag3 and HspB1 were from Sigma Aldrich (St. Louis, MO). Antibodies against p21 and MVP were from BD Transduction Laboratories (Franklin, NJ). Antibodies against Bag3 and DDB2 were from Abcam (Cambridge, MA) and antibody specific for Peroxiredoxin 1 was from Gentex (Irvine, CA). Secondary HRP-conjugated antibodies, including anti-rabbit IgG, anti-mouse IgG, and anti-goat IgG were from Cell Signaling (Danvers, MA).
Cell Culture
MCF7, SKBR3, T47D, MDA-MB-231, and MDA-MB-468 cells (a kind gift of Prof. William Gallagher, UCD) were cultured in Dulbecco's modified Eagle's medium (DMEM) supplemented with 10% FBS and 5 mm glutamine. ZR751 cells were cultured in DMEM containing 5% FBS and 10 nm Estradiol. CCD19 Lung Fibroblasts were grown in modified Eagles Medium (MEM) through passage 20. Cells were grown in humidified cell culture incubators under 5% CO2, 95% air. Drug or DMSO (vehicle control) were added and incubated for the indicated times. The DMSO concentration never exceeded 0.1%.
Cell Death Assays
Cell death was quantitatively assayed by antibody-mediated capture and detection of cytoplasmic mononucleosome-associated histone-DNA complexes using the Cell Death Detection ELISA Plus kit from Roche Diagnostics (Indianopolis, IN).
Senescence Assay
SA-β-Gal staining was performed after adriamycin treatment in subconfluent cultures, at pH 6.0, using a Senescence β-Galactosidase Staining Kit as described in the manufacturer's instructions. Percentages of SA-β-Gal-positive cells were visualized under a light microscope (Olympus, PA), and quantified by scoring 200 cells, in triplicate, in three independent experiments.
Immunofluorescence (IF) Microscopy
Cells growing on glass coverslips in 24-well plates were washed with PBS and fixed with 4% formaldehyde or 15 min. To block nonspecific staining, cells were incubated with PBS (0.1 m; pH = 7.4) containing 5% normal goat serum and 0.2% Triton X-100, for 2 h at room temperature. This was followed by overnight incubation at 4 °C with primary antibodies targeting MVP, Bag3, or LAMP 1 (at 1:200 dilution). After incubation with primary antibodies, cells were washed three times in PBS with 0.2% Triton X-100 and incubated with secondary antibodies conjugated to Alexa Fluor 568 or Alexa Fluor 488 (Molecular Probes, Grand Island, NY). Antibodies were introduced in solutions that contained 0.1 m PBS, 0.2% Triton X, and 5% normal goat serum. Prolong Gold anti-fade reagent (Invitrogen, Carlsbad, CA) was applied directly to fluorescently labeled cells before mounting coverslips. Stained cells were analyzed and photographed with a Confocal Microscope (Fluoview 1000, Olympus, PA) using the same settings for each preparation.
siRNA Transfections
Cells were transfected with 5 nm siRNA using 4 μl Lipofectamine (Invitrogen, Grand Island, NY). Briefly, lipid-siRNA complexes were prepared in SFM and added to cell suspensions in culture medium with 10% FBS. After 24 h, the medium was replaced. The target sequences were: MVP: 5-CCUACAUGCUGACCCAGGATT-3; Bag3: 5-GCCUGAAAACAAACCAGAATT-3; ERK1: 5-CAGGGUUCCUGACAGAAUATT-3; Cathepsin B: 5-GAACUUCUGGACAAGAAAAtt-3′; Cathepsin D: 5-CCUCGUUUGACAUCCACUAtt-3; DDB2: 5-UGCACACUCUGGAUU-CUUAtt-3; ATG7: 5-GAAGCUCCCAAGGACAUUAtt-3; and PRDX1: 5-GGAUGAGACUUUGAGACUAtt-3.
Plasmid Constructs and Co-transfection
The construct for Flag-Bag3 was previously reported (6, 10). Cells were transfected using 10 μg of either the expression construct or empty vector using Lipofectamine 2000.
Protein Extraction and Immunoblotting
Cell extracts were prepared in IP lysis buffer (0.25 m Tris, 0.15 m NaCl, 1 mm EDTA, 1% Nonidet P-40, 5% glycerol, and mammalian protease inhibitor mixture, pH 7.4). Extracts were centrifuged at 16,000 × g for 10 min and stored at −80 °C. Protein concentration was determined by the BCA assay (Thermo Scientific, Rockford, IL). Nuclear extracts were prepared using a Nuclear Extraction kit (EMD, Millipore, Temecula, CA) as per the manufacturer's instructions. For Western blotting, equal amounts of protein were resolved by SDS-PAGE and transferred onto a 0.2 mm nitrocellulose membrane. Membranes were blocked (50 mm Tris, pH 7.6, 150 mm NaCl, 0.05% Tween 20, and 5% nonfat dry milk or BSA) prior to incubation with antibodies. Luminol-based detection was performed using SuperSignal West Pico or Femto reagents (Rockford, IL).
Flag Immunoprecipitation
Total protein extracts were prepared in IP lysis buffer (0.25 m Tris, 0.15 m NaCl, 1 mm EDTA, 1% Nonidet P-40, 5% glycerol, and mammalian protease inhibitor mixture, pH 7.4). Affinity purifications were carried out at 4 °C by combining 5 mg of cellular protein extract with a 40 μl packed volume of M2 anti-FLAG-conjugated Agarose from Sigma Aldrich (St. Louis, MI). The beads were washed and then eluted using 3×FLAG peptide at 150 ng/μl in HEMG buffer (25 mm HEPES, pH 7.6, 0.1 mm EDTA, 12.5 mm MgCl2, and 10% glycerol) containing 0.15 m KCl. Eluted samples were methanol chloroform-precipitated and lyophilized for later analysis by mass spectrometry or immunoblotting.
Endogenous IP
Cell extracts were prepared in IP lysis buffer and clarified by centrifugation (16,000 × g, 10 min). Bag3, MVP, and Ubiquitin antibodies were crosslinked with Protein A/G Magnetic Dynabeads (Thermo Scientific, Rockford, IL) using a DSP crosslinking protocol. The crosslinked antibodies were then incubated with cell extracts (5 mg of protein) overnight at 4 °C. Beads were washed three times with IP lysis buffer and eluted in urea for MS analysis.
Proteomic Sample Preparation
The FLAG affinity purification precipitates and endogenous immunoprecipitates were resuspended in 8 m urea. The samples were reduced by incubation for 20 min with 5 mm tris(2-carboxyethyl) phosphine at room temperature and alkylated in the dark by treatment with 10 mm iodoacetamide for 15 min. Proteins were digested overnight at 37 °C with Sequencing Grade Modified Trypsin (Promega, Madison, WI). Proteolysis was stopped by acidification.
MudPIT Mass Spectrometry
Protein digests were pressure-loaded into 250-μm i.d. capillaries packed with 2.5 cm of 10-μm Jupiter C18 resin (Phenomenex) followed by an additional 2.5 cm of 5-μm Partisphere strong cation exchanger (Whatman). The column was washed with 95% (v/v) water, 5% acetonitrile, and 0.1% formic acid. After washing, a 100-μm i.d. capillary with a 5-μm pulled tip packed with 12 cm of 5-μm Aqua C18 resin was attached to the filter union, and the entire split column (desalting column-union-analytical column) was placed in-line with an Agilent 1200 quaternary HPLC and analyzed using a modified 9-step separation described previously (11). The buffer solutions used were 5% (v/v) acetonitrile/0.1% formic acid (buffer A), 80% (v/v) acetonitrile/0.1% formic acid (buffer B), and 500 mm ammonium acetate/5% (v/v) acetonitrile/0.1% formic acid (buffer C). As peptides eluted from the microcapillary column, they were electrosprayed directly into an LTQ-Orbitrap mass spectrometer from Thermo Finnigan (Waltman, MA) with the application of a distal 2.4-kV spray voltage. A cycle of one full-scan mass spectrum (400–1800 m/z) at a resolution of 60,000 followed by 10 data-dependent MS/MS spectra at a 35% normalized collision energy was repeated continuously throughout each step of the multidimensional separation. Application of mass spectrometer scan functions and HPLC solvent gradients were controlled by the Xcaliber data system. Both lysates and Flag-IPs were analyzed using a Thermo Scientific LTQ-Orbitrap-XL. Endogenous IP samples were run on a Thermo Scientific Q Exactive mass spectrometer connected to a Dionex Ultimate 3000 (RSLCnano) chromatography system. Tryptic peptides were resuspended in 0.1% formic acid. Each sample was loaded onto Biobasic Picotip Emitter (120 mm length, 75 μm ID) packed with Reprocil Pur C18 (1.9 μm) reverse phase media and was separated by an increasing acetonitrile gradient over 60 min at a flow rate of 250 nL/min. The mass spectrometer was operated in positive ion mode with a capillary temperature of 220 °C, and with a potential of 2100V applied to the frit. A top 12 method was used. Full MS scans were acquired in the Orbitrap mass analyzer over the range m/z 300–1600 with a mass resolution of 70,000 (at m/z 200). The target value was 3.00E+06. The twelve most intense peaks with were fragmented in the HCD collision cell with a normalized collision energy of 27%, and tandem mass spectra were acquired in the Orbitrap mass analyzer with a mass resolution of 17,500 at m/z 200.
Analysis of Tandem Mass Spectra
Protein identification, quantification, and analysis were performed using the Integrated Proteomics Pipeline-IP2 (Integrated Proteomics Applications, Inc, www.integratedproteomics.com/) together with ProLuCID, DTASelect2, Census, and QuantCompare. Raw spectrum files were extracted into ms1 and ms2 files using RawExtract 1.9.9 (http://fields.scripps.edu/downloads. php) (12). Tandem mass spectra were compared with EBI-IPI_Human_3.71_03–24-2010_ reversed.fasta data base, 49,078 entries. To estimate peptide probabilities and FDRs accurately, we used a target/decoy database containing the reversed sequences of all the proteins appended to the target database FDR was set ≤1%. Tandem mass spectra were matched to sequences using the ProLuCID algorithm with 50 ppm peptide mass tolerance for precursor ions and 400 ppm for fragment ions (13–14). A fixed modification of cysteine 57.02146 was included and no variable modifications. Each dataset was searched twice, once against light and then against heavy protein databases. After the results from ProLuCID analysis were filtered using DTASelect2, ion chromatograms were generated using an updated version of a program previously written in our laboratory. This software, called “Census” (15), is available from the authors for individual use and evaluation through an Institutional Software Transfer Agreement (see http://fields.scripps.edu/census for details).
For quantification analysis, the elemental compositions and corresponding isotopic distributions for both the unlabeled and labeled peptides were calculated, and this information then was used to determine the appropriate m/z range from which to extract ion intensities, which included all isotopes with greater than 5% of the calculated isotope cluster base peak abundance. MS1 files were used to generate chromatograms from the m/z range surrounding both the unlabeled and labeled precursor peptides. Census calculates peptide ion intensity ratios for each pair of extracted ion chromatograms. The heart of the program is a linear least-squares correlation that is used to calculate the ratio (i.e. slope of the line) and closeness of fit [i.e. correlation coefficient (r)] between the data points of the unlabeled and labeled ion chromatograms. Census allows users to filter peptide ratio measurements based on a correlation threshold; the correlation coefficient (values between zero and one) represents the quality of the correlation between the unlabeled and labeled chromatograms and can be used to filter out poor-quality measurements. Final protein ratios were generated with Quant Compare, which uses Log 2-fold change and ANOVA p value to identify regulated significant proteins. For a protein to be considered in our screen, it had to be “plotted” on our volcano scatter plot (Fig. 2B). The y axis of the volcano plots is the ANOVA p value, which requires each protein to be quantified in at least two of the biological replicates (so we can calculate the variance). The Q-exactive raw data files were de novo sequenced and searched against a Human UniProtKB database Release 2013_07, 20,266 entries using the search engine PEAKS Studio 7, for peptides cleaved with trypsin. Each peptide used for protein identification met specific Peaks parameters, i.e. only peptide scores that corresponded to a false discovery rate (FDR) of ≤1% were accepted from the Peaks database search. The database searching parameters included up to two missed cleavages allowed for full tryptic digestion, and a precursor ion mass tolerance 10 ppm. A fixed modification of cysteine 57.02146 was included and variable modifications included up to 707 common modifications for the Peaks PTM search.
Fig. 2.

Quantitative Proteomic Analysis of Therapy Induced Senescence (TIS). A, A SILAC-based quantitative proteomic analysis was performed to identify novel regulators of therapy induced senescence (TIS). An experimental schematic is shown. B, We calculated fold change between control and adriamycin cells in five biological replicates and significance between replicates was calculated by ANOVA t test analysis. A volcano plot is shown. The x axis represent the average protein fold change and the y axis of the volcano plots is the ANOVA P significance value, which requires each protein to be quantified in at least two of the biological replicates. C, Biological functions associated with proteins significantly changed in TIS. Changes within the newly formed networks were displayed using the functional analysis feature in the order of their significance to the network. If the significance of the association between the network and the biological function had a p < 0.05, then the biological function was displayed in the functional analysis feature.
Ingenuity Analysis
Differentially regulated proteins (p < 0.01) were overlaid onto a global molecular network developed from information contained in the ingenuity knowledge base (Ingenuity Systems®, http://www.ingenuity.com, content version 12402621, release date: 2012–03-09). Networks of these proteins were algorithmically generated based on their connectivity. Biological functions associated with proteins within the newly formed networks were displayed using the functional analysis feature in the order of their significance to the network. If the significance of the association between the network and the biological function had a p < 0.05, then the biological function was displayed in the functional analysis feature.
RESULTS
Induction of Senescence in MCF7 Breast Cancer Cells
As a model of cellular senescence in cancer cells, we treated MCF7 breast cancer cells with low dose adriamcyin (0.1 μm). Changes in phenotype and cell cycle distribution were monitored for 6 days after treatment. By microscopic analysis, we observed that many of the cells developed a senescent phenotype with large, flattened cell bodies and enhanced expression of SA-β-gal (Fig. 1A). Ninety percent of the cells were SA-β-gal-positive, which is a marker of senescence (Fig. 1B). These observations are consistent with previous reports on adriamycin-treated senescent cells (16–18). Fig. 1C shows that, in MCF7 cells that were treated with adriamycin for 6 days, p21 was robustly induced. A more modest increase in p53 was observed and Cyclin D1 levels were increased. pRb was increased in adriamycin-treated cells; however, this change was transient and not observed at day six. The observed changes in growth regulatory proteins are consistent with anticipated results for senescent MCF7 cells (16).
Fig. 1.
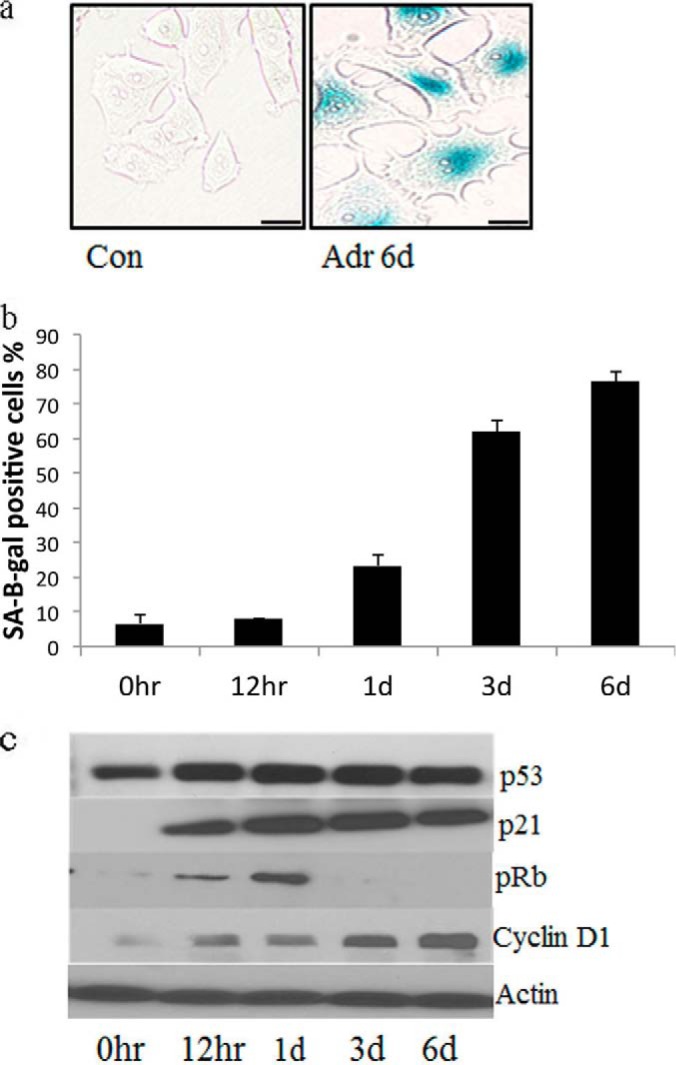
Senescence is induced in MCF7 cells. A, MCF7 breast cancer cells were treated with low dose adriamcyin (0.1 μm) for 6 days, and immunostained for the senescent marker, SA-β-gal. Scale bar is 10 μm. B, The percentage of SA-β-gal positive cells were quantified in triplicate at different time-points after adriamycin treatment. C, The protein expression levels of p21, p53, pRB, and Cyclin D1 were analyzed at different time-points after adriamycin treatment using immunoblotting.
Next, we carried out a SILAC-based proteomics analysis to identify novel regulators of TIS. MCF7 cells were cultured with “heavy” lysine and arginine. Extracts of the “heavy” MCF7 cells were mixed with extracts of unlabeled cells, which had been treated with adriamycin. The combined extracts were subjected to trypsin digestion. Peptides were fractionated by liquid chromatography and analyzed with a high-resolution mass spectrometer (LTQ-Orbitrap) (Fig. 2A). The total number of proteins quantified in five biological replicates was 5203. The mass spectrometry proteomics data have been deposited to the ProteomeXchange Consortium via the PRIDE partner repository with the dataset identifiers PXD001012–PXD001017.
We compared the biological datasets to calculate the “fold-change” and significance by ANOVA and graphed these results as a volcano plot (Fig. 2B). 129 proteins were significantly reduced (supplemantal Table S1) and 92 proteins were significantly elevated (by at least 1.2-fold) in senescent cells. The differentially expressed proteins were overlaid onto global molecular networks, developed from information contained in the Ingenuity knowledge database. Networks were then generated algorithmically based on connectivity. Biological functions associated with proteins within the newly formed networks were displayed using the functional analysis feature in the order of significance to the network (Fig. 2C). Pathway Analysis also was performed (supplemental Fig. S1).
Among the proteins regulated by induction of senescence, the two largest functional biological networks were protein synthesis and cell death proteins. Other functional networks included cellular morphology and protein degradation (Fig. 2C). Canonical Pathway Analysis of differentially regulated proteins in TIS revealed changes in pathways associated with protein turnover and metabolism (supplemental Fig. S1), including mTOR signaling, EIF2 signaling, protein ubiquitination, and metabolic glutamate pathways. We confirmed the quantitative mass spectrometry ratios and corresponding densitometry ratios by performing immunoblot analysis, focusing on 10 proteins that were differentially regulated in TIS (Fig. 3A).
Fig. 3.

Bag3 is up-regulated in TIS. A, A table of 10 proteins differentially regulated in TIS is shown, their quantitative mass spec ratios and corresponding densitometry ratios from immunoblotting analysis are listed. B, Protein expression levels of Bag3 was determined at different time-points after adriamycin treatment using immunoblotting. C, Subcellular localization of Bag3 in control and adriamycin treated MCF7 cells was detected by confocal microscopy. Scale bar is 10 μm.
In order to identify proteins, which were up-regulated in the proteomics screen, that may regulate the senescent phenotype, we performed gene silencing experiments, targeting Bag3, MVP, Cathepsin B, Cathepsin D, Peroxiredoxin 1, Autophagy Related Protein 7, and DNA Damage Protein 2. We measured the number of senescent cells relative to the control using an SA-β-gal assay (supplemental Fig. S2). The largest reduction in senescent cells was observed when the Bag3 gene was silenced. Bag3 is associated with apoptosis resistance (5) and has also been shown to play a role in replicative senescence (6). Given the previously described activities of Bag3, we decided to further examine the role of Bag3 in the induction of senescence with adriamycin treatment. First, we examined Bag3 expression over a 6 day time course. Fig. 3B shows that Bag3 expression was increased within 1 day following adriamycin treatment, as determined by immunoblot analysis. Increased Bag3 was also noted by confocal IF microscopy (Fig. 3C). In adriamycin-treated cells, Bag3 localized to both the nucleus and cytoplasm. The level of Bag3 was greatest in perinuclear cytoplasm.
Bag3 Regulates the Balance between Senescence and Apoptosis
To study the role of Bag3 in adriamycin-induced senescence, Bag3 was silenced in control and drug-treated MCF7 cells over a 5 day time course. Bag3 gene-silencing was efficient for the entire time course, as determined by immunoblot analysis (Fig. 4A, B). The fraction of MCF7 cells that were SA-β-gal-positive after treatment with adriamycin was decreased most significantly in Bag3 gene-silenced cells at day five (Fig. 4C). Decreased levels of the cell cycle inhibitor p21 also were observed in Bag3 gene-silenced cells, compared with control cells treated with adriamycin, as shown in the representative immunoblot (Fig. 4B).
Fig. 4.
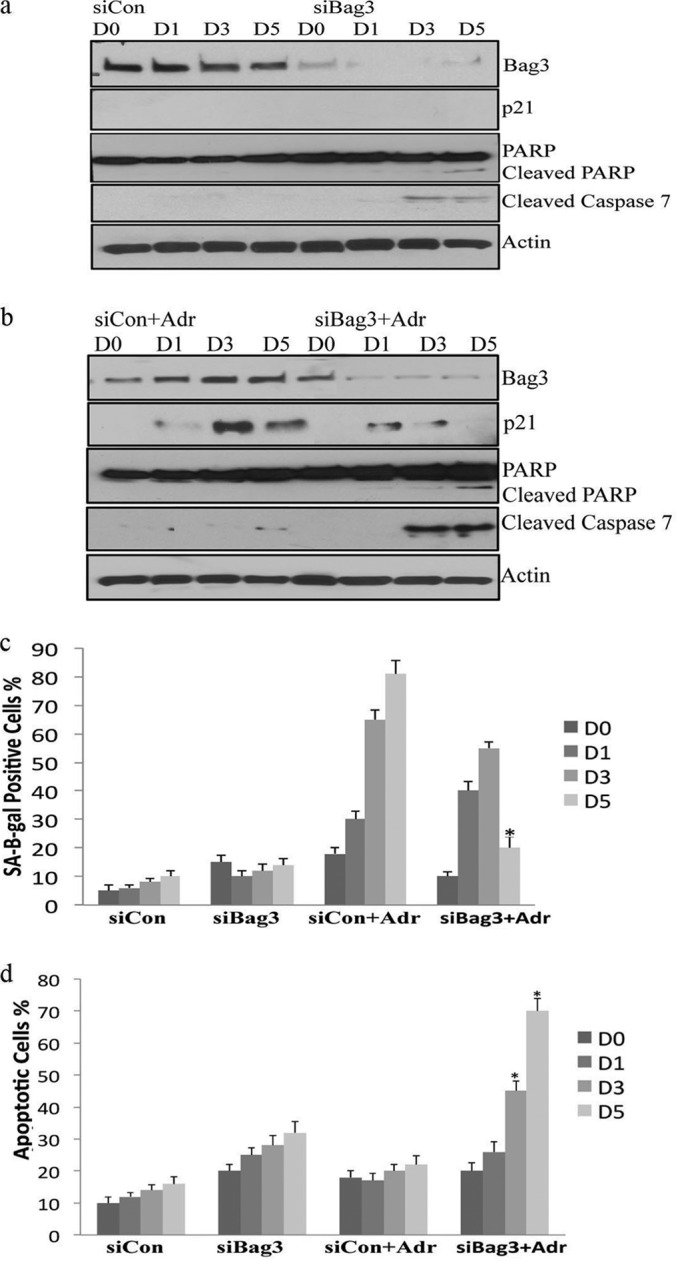
Bag3 promotes the senescent phenotype and prevents apoptosis. A, MCF7 cells were transfected with nontargeting siRNA (Neg) or Bag3 siRNA (Bag3) over a 5 day period. The protein expression levels of Bag3, p21, cleaved PARP, and caspase 7 were determined in control cells and Bag3 silenced cells. B, MCF7 cells were transfected with nontargeting siRNA (Neg) or Bag3 siRNA (Bag3) over a 5 day period treated with adriamycin and expression levels of Bag3, p21, cleaved PARP, and caspase 7 visualized by immunoblotting. C, The percentage of SA-β-gal positive cells was quantified in triplicate for control cells and Bag3 silenced cells. The results shown are representative of three independent experiments; the histograms represent the average and the error bars represent the standard deviation of the means. Significance was tested by paired t test analysis. An asterisk represents p < 0.05. D, The fraction of apoptotic cells before and after Bag3 silencing was quantified using an ELISA cell death assay. Analysis was performed in triplicate. Significance was tested by paired t test analysis. An asterisk represents p < 0.05.
We hypothesized that Bag3 may play a role in apoptosis resistance in senescent cells. When MCF7 cells were treated with adriamycin, Bag3 gene-silencing increased the fraction of apoptotic cells as measured by enrichment of mono-nucleosomes in the cytoplasm using a Cell Death ELISA assay. A significant increase in apoptosis was observed by day three. The largest increase apoptosis was observed at day five (Fig. 4D). We also examined the levels of two apoptotic markers, cleaved PARP and cleaved caspase 7 (MCF7 cells are caspase 3-deficient). We observed increased levels of the cleaved PARP protein fragment (89 kDa) as well as cleaved caspase 7 in Bag3 gene-silenced cells after 3 days of adriamycin treatment, confirming the increase in apoptosis (Fig. 4B). These results suggest that Bag3 gene silencing shifts the response to adriamycin in MCF7 cells from senescence to apoptosis.
Bag3 Interacts with the MVP and Stabilizes It
To further examine the mechanism of Bag3 activity in senescent cells, we explored the Bag3 interactome in adriamycin-treated and untreated MCF7 cells by mass spectrometry (supplemental Table S2). We transfected cells with a Flag-Bag3 construct and performed Flag immunoprecipitation (IP). Mass spectrometry analysis revealed that Bag3 interacted with 145 proteins in adriamycin-treated cells. Only proteins that were not present in the antibody control IPs and had at least two peptides are listed in the table. The ten most abundant interactors in the Bag3 interactome, as determined by spectral counts, are summarized in Fig. 5A. The list includes known Bag3 interactors, including Hsp70 and HspB8, and many novel interacting partners. MVP was the most abundant Bag3-interacting protein identified in the Bag3 interactome as determined by spectral counts. MVP forms part of the Major Vault Complex that consists of three proteins: MVP, Poly (ADP-ribose) polymerase family, member 4 (PARP4), and telomerase associated protein 1 (TEP1). All three members of the complex were identified as Bag3 interactors (Fig. 5A and supplemental Table S2). Bag3 was shown to interact with MVP in nonsenescent cells, but the abundance of MVP was lower in this IP (as determined by spectral counts), suggesting that there is increased interaction of Bag3 with MVP when senescence is induced (supplemental Table S2). In immunoblotting experiments, Bag3 was clearly identified in the Flag-Bag3 IP, but not in the control IP with free FLAG, as anticipated (Fig. 5B). MVP also was identified in immunoblots of the Flag-Bag3 IP.
Fig. 5.

Bag3 interacts with the Major Vault Complex and stabilizes it. A, MCF7 cells were transfected cells with a Flag-Bag3 construct and a Flag immuno precipitation was performed followed by Mass Spectrometry analysis of the eluted proteins. The ten most abundant interactors in the Bag3 interactome determined by spectral counts are listed. B, Bag3 was immunoprecipitated from MCF-7 extracts and immunoblotted for Bag3 and MVP. C, Co-localization analysis of Bag3 and MVP in control and adriamycin treated senescent cells was performed using confocal microscopy. Scale bars represent 10 μm. D, Protein expression levels of MVP were determined by immunoblotting in Bag3 siRNA or nontargeting siRNA, control and adriamycin treated cells. E, A quantitative graph of down-regulated MVP in control and adriamycin treated cells after Bag3 silencing. F, Subcellular localization of MVP in control and Bag3 silenced MCF7 cells was detected by confocal microscopy. Scale bar is 10 μm. G, MCF7 cells were transfected with nontargeting siRNA (Neg) or Bag3 siRNA (Bag3) over a 5 day period, subjected to nuclear fractionation and expression levels of nuclear marker Histone H1, Bag3, and MVP was visualized by immunoblotting.
To confirm that Bag3 interacts with MVP in an endogenous IP (no transfection), we immunoprecipitated Bag3 from MCF7 cells using a nontagged crosslinked IP. We detected MVP in the Bag3 IP by LC-MS/MS (supplemental Fig. S3, supplemental Table S3). A higher number of peptides were identified for MVP in the drug-treated cells than in the IP for Bag3 from cells that were not drug-treated. Only proteins that were not present in the antibody control IPs and had at least two peptides are listed in the table. To further study the Bag3-MVP interaction, we performed a reverse IP for endogenous MVP and determined that Bag3 is present in the IP by LC-MS/MS in control and adriamycin-treated cells (supplemental Fig. S3, supplemental Table S3). Confocal IF microscopy revealed that Bag3 co-localized with MVP mainly in the nucleus in adriamycin-treated MCF7 cells (Fig. 5C).
To test the role of Bag3 on the stability of MVP, we silenced Bag3 and examined MVP protein expression in control and adriamycin-treated cells by immunoblot analysis. As shown in a representative immunoblot (Fig. 5D) and in the summary of results (Fig. 5E), Bag3 gene-silencing significantly decreased the level of MVP (p < 0.05). We also performed IF confocal microscopy to examine MVP in Bag3 gene-silenced cells. In control cells (no Bag3 gene-silencing) adriamycin promoted localization of MVP to the nucleus (Fig. 5F). This process appeared to be dependent on Bag3 because when Bag3 was silenced, MVP expression in the nucleus was reduced. Subcellular fractionation confirmed increased MVP nuclear localization during TIS, which was reduced upon Bag3 gene-silencing (Fig. 5G). To determine if Bag3 regulated MVP gene expression, we performed RT-PCR analysis on control and Bag3 gene-silenced cells. There was no significant decrease in MVP mRNA expression (supplemental Fig. S4), suggesting that Bag3 regulates MVP post-transcriptionally. We hypothesized that Bag3 may stabilize MVP post-transcriptionally by inhibiting its proteasomal degradation. We demonstrated that MVP interacts with different subunits of the proteasome and is ubiquitinated (supplemental Fig. S5A, S5B). We examined MVP in cells treated with the proteasome inhibitor MG132. MVP was reduced in Bag3 gene-silenced cells and restored in cultures in which the proteasome inhibitor was added (supplemental Fig. S5C). These findings indicate that Bag3 regulates MVP degradation.
MVP Regulates the Balance between Senescence and Apoptosis
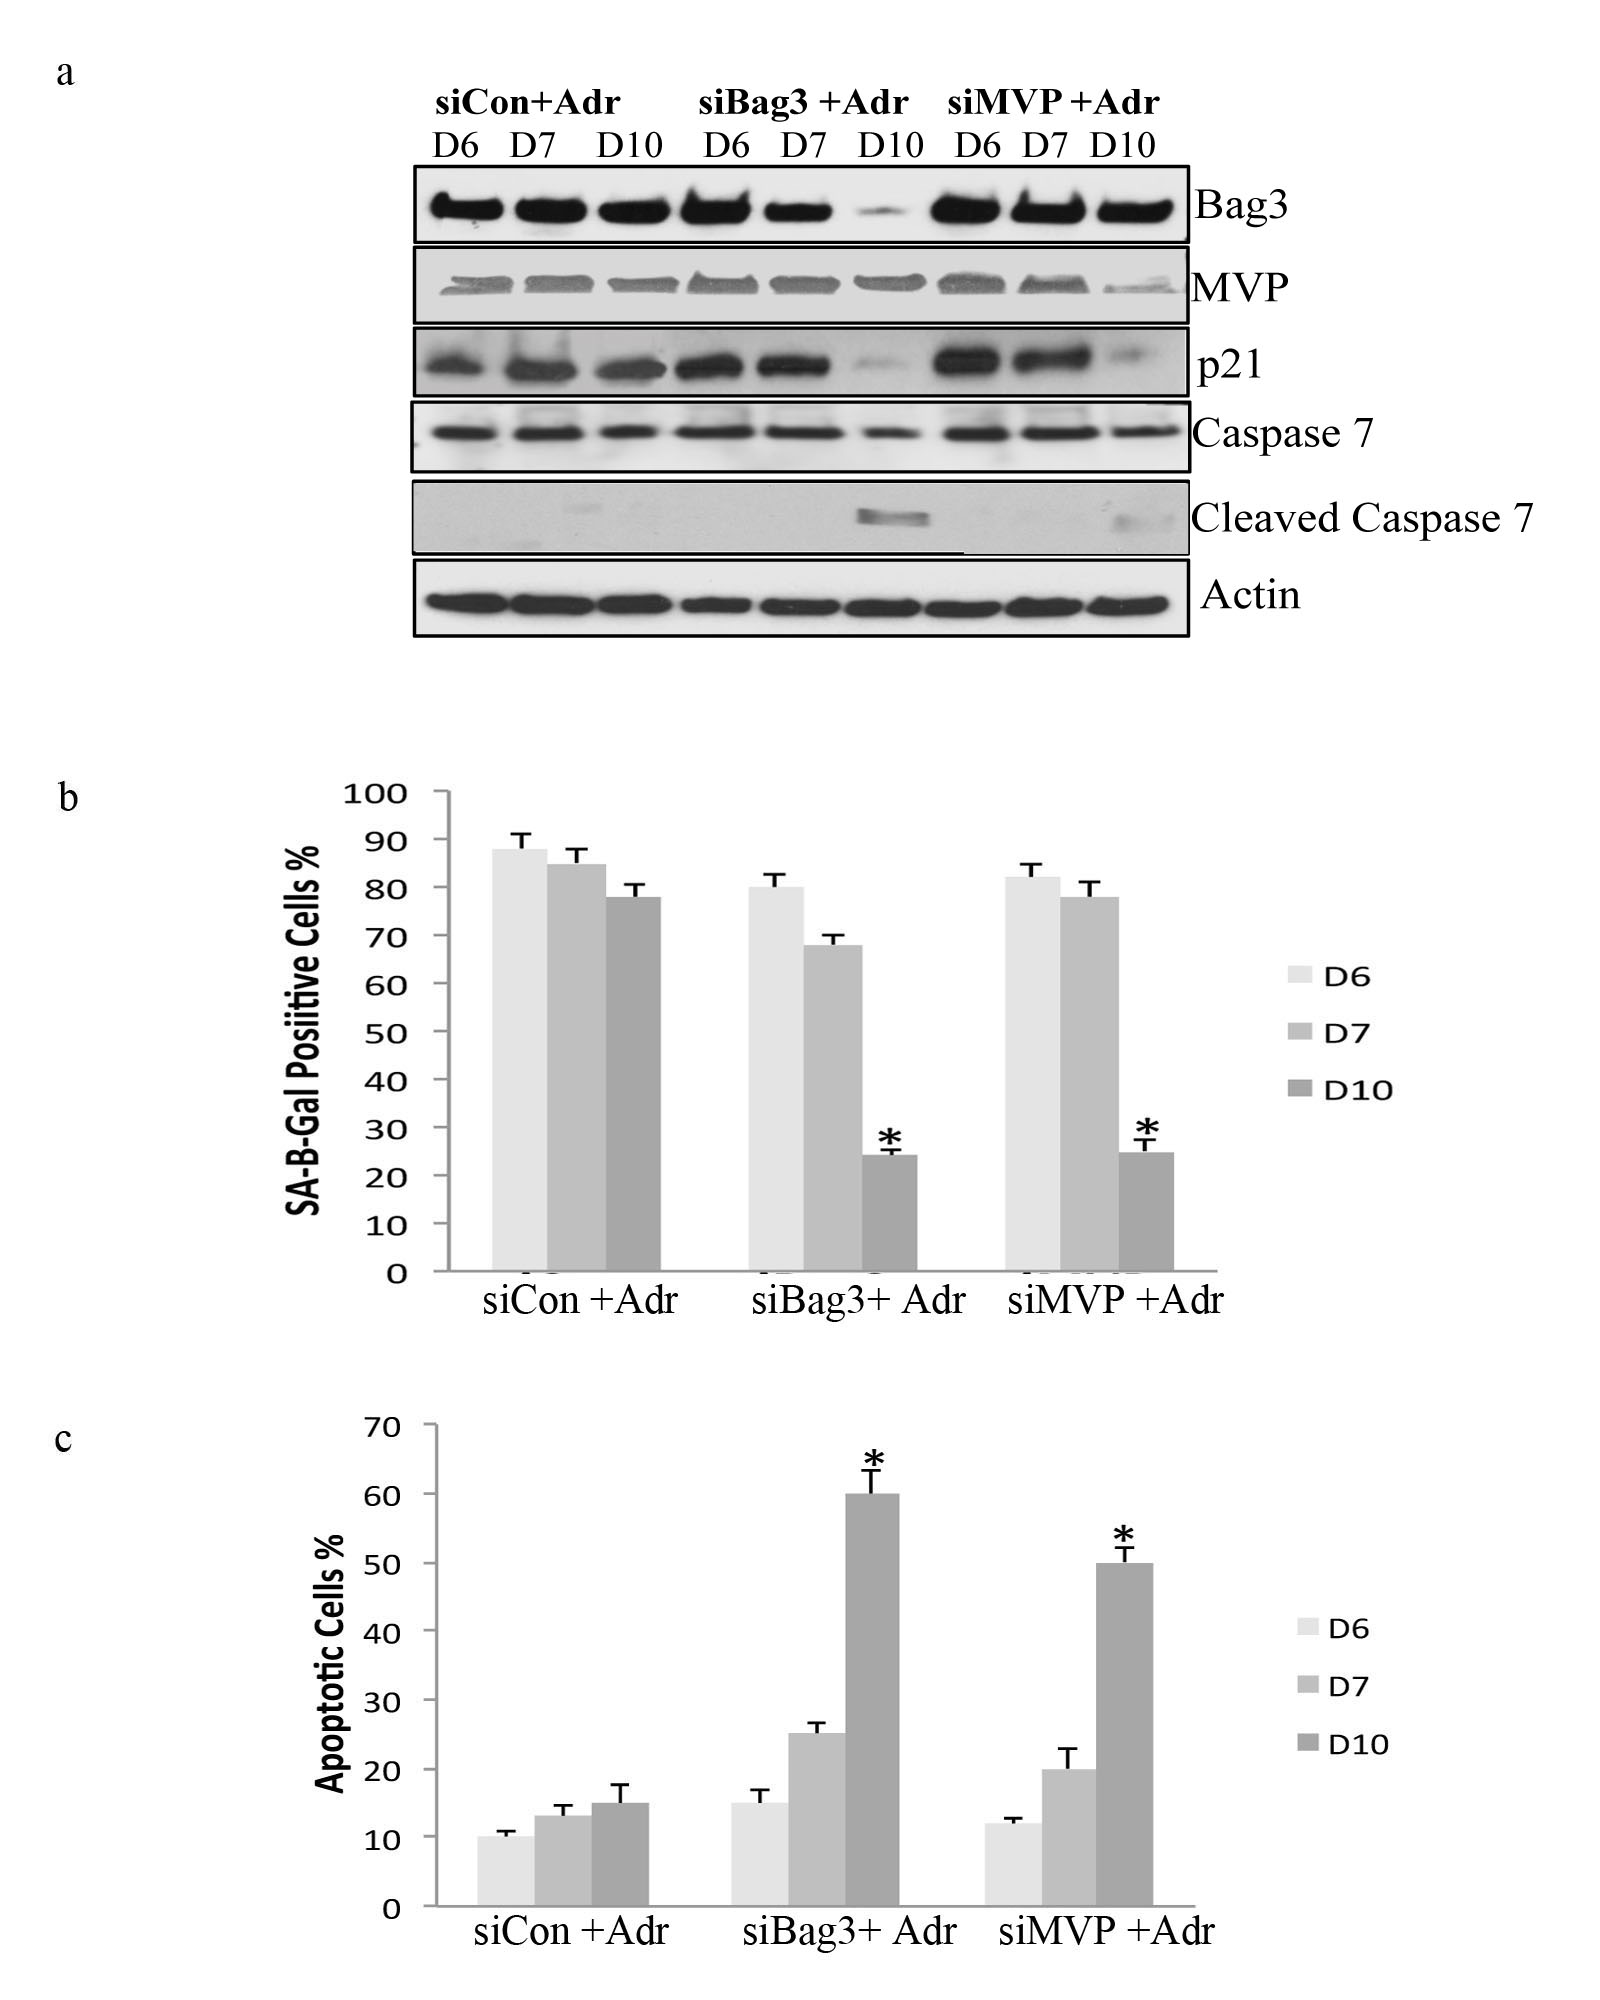
Next, we tested whether MVP gene-silencing increases apoptosis in senescent cells. MVP was silenced in control and adriamycin-treated MCF7 cells over a 5 day time course. Efficient silencing of MVP was demonstrated by immunoblot analysis (Fig. 6A, 6B). The fraction of MCF7 cells that were SA-β-gal-positive after treatment with adriamycin was decreased significantly when MVP was silenced (Fig. 6C). Next, we examined apoptosis over a 5 day period as measured by enrichment of mono-nucleosomes in the cytoplasm using a Cell Death ELISA. The most significant increase in apoptosis was observed on day five after adriamycin treatment (Fig. 6D). A corresponding increase in cleaved PARP and caspase 7 also was also observed (Fig. 6B). In order to confirm that Bag3 and MVP prevent apoptosis in senescent cell populations, we performed additional control experiments. Bag3 and MVP were silenced in nondividing adriamycin-treated cells (day six) where ∼90% of cells exhibited the senescent phenotype (supplemental Fig. S6A, 6B). The level of apoptosis and apoptotic markers were measured (supplemental Fig. S6A, 6C). A significant increase in the level of apoptosis was observed 4 days after gene silencing (day 10). Bag3 and MVP also were silenced in senescent lung fibroblasts that were at late passage and could no longer replicate. A significant increase in apoptosis was observed by day four (supplemental Fig. S7), again supporting our model in which Bag3 and MVP function as a system to prevent apoptosis in senescent cell populations.
Fig. 6.
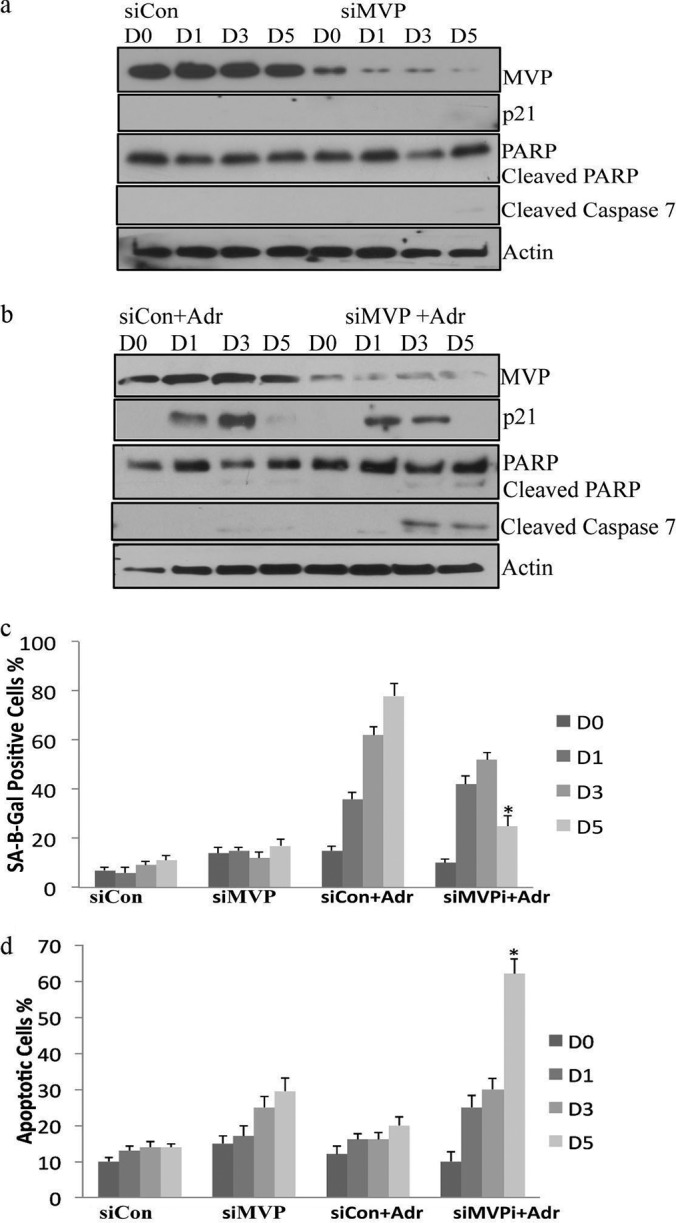
MVP promotes the senescent phenotype and prevents apoptosis. A, MCF7 cells were transfected with nontargeting siRNA (Neg) or MVP siRNA (MVP) over a 5 day period. The protein expression levels of MVP, p21, cleaved PARP, and caspase 7 were determined in control cells and MVP silenced cells B, MCF7 cells were transfected with nontargeting siRNA (Neg) or MVP siRNA (MVP) over a 5 day period treated with adriamycin and expression levels of MVP, p21, cleaved PARP, and caspase 7 visualized by immunoblotting. C, MCF7 cells were transfected with nontargeting siRNA (Neg) or MVP siRNA (MVP) over a 5 day period. The percentage of SA-β-gal positive cells were quantified in triplicate for control cells and MVP silenced cells. The results shown are representative of three independent experiments; the histograms represent the average and the error bars represent the standard deviation of the means. Significance was tested by paired t test analysis. An asterisk represents p < 0.05. D, The fraction of apoptotic cells before and after MVP silencing in the presence of adriamycin was quantified using an ELISA cell death assay. Analysis was performed in triplicate.
MVP and Bag3 Promote Resistance to Apoptosis by Regulating ERK1/2 in MCF7 Cells
As Bag3 and MVP have been shown to stabilize and scaffold different signaling pathways, we examined their role in regulating signaling pathways implicated in TIS. The Raf/MEK/ERK and PI3K/PTEN/Akt/mTOR1 pathways play critical roles in the regulation of cellular senescence and quiescence (19). Therefore, we examined downstream effectors of both of these pathways. We observed an increase in both pERK1/2 and pmTOR1 expression upon adriamycin treatment. However, when either Bag3 or MVP was silenced in MCF7 cells, the increase in pERK1/2 associated with adriamycin treatment was blocked (Fig. 7A, 7B). Other MAP kinases, including p38 MAPK, and Jun kinase (JNK), were not regulated in response to adriamycin or when either Bag3 or MVP was silenced. These results suggest that Bag3 and MVP play an essential role in activating or sustaining active ERK1/2 in TIS. Activated ERK1/2 has been shown to protect cells against apoptosis via stabilization of anti-apoptotic members of the bcl2 family (20) and regulation of caspase activity (21). To further examine if ERK1/2 is functional in TIS, we silenced ERK in control and adriamycin treated cells (Fig. 7C) and measured the level of apoptosis using a Cell Death ELISA assay. We observed a significant increase in the level of apoptosis after ERK gene-silencing by day 5 (Fig. 7D) implicating a prosurvival role for ERK1/2 in the senescent MCF7 cell population.
Fig. 7.

MVP and Bag3 promote resistance to apoptosis via the ERK pathway. A, MCF7 cells were transfected with the small interfering RNA (siRNA) of Bag3, MVP, and treated with adriamycin for 5 days. The cells lysates were immunoblotted with anti-pERK, ERK, p38, pP38, JNK, pJNK, mTor, pmTor, and S6 kinase antibody. B, A quantitative graph of down-regulated pERK in adriamycin treated cells after Bag3 silencing. The results shown are representative of three independent experiments; the histograms represent the average and the error bars represent the standard deviation of the means. Significance was tested by Anova analysis. Asterisk represents p < 0.001, p < 0.005 respectively. C, MCF7 cells were transfected with the small interfering RNA (siRNA) of ERK1 or Control (siRNA) for a 5 day period in the presence of adriamcyin and immunoblotted for ERK and pERK. D, The fraction of apoptotic cells before and after ERK silencing in the presence of adriamycin was quantified using an ELISA cell death assay. Analysis was performed in triplicate.
MVP and Bag3 Regulate ERK1/2 Signaling and Apoptosis in a Panel of Breast Cancer Cells
Next, we examined expression of Bag3 and MVP in five different breast cancer cell lines representing different subtypes, including ERα-positive cells: T47D, ZR751; Her2-positive cells: SKBR3; and Triple-negative cells: MDA-MB-231 and MDA-MB-468. Bag3 and MVP were expressed in all these cell lines under control conditions and after adriamycin treatment. Induction of p21 was observed in all of the cell lines upon low dose adriamycin treatment. Only a very modest level of p21 was observed in SKBR3 cells (Fig. 8A). In order to determine whether the cells were quiescent or senescent upon adriamycin treatment, we examined SA-β-gal activity (supplemental Fig. S8). ZR751 cells exhibited strong senescence upon adriamycin treatment compared with the other cell lines.
Fig. 8.

MVP and Bag3 regulate ERK signaling and stimulate apoptosis in a panel of breast cancer cells. A, Five different breast cancer cell lines representing different subtypes, ER positive, T47D, ZR751, Her 2 positive SKBR3, and Triple Negative MDA-MD 231 and MDA-MD-468 were treated for 5 days with low dose adriamycin and lysed along with control cells. All cell lines were immunoblotted for Bag3 MVP and p21. B, SKBR3, T47D, ZR751, MDA-MD 231, and MDA-MD-468 cells were transfected with nontargeting siRNA (Con), Bag3 siRNA(Bag3), or MVP siRNA (MVP) in the presence of adriamcyin. The fraction of apoptotic cells before and after MVP silencing in the presence of adriamycin was quantified using an ELISA cell death assay. Analysis was performed in triplicate. Significance was tested by Anova analysis. Asterisk represents p < 0.05. C, SKBR3, T47D, ZR751, MDA-MD 231, and MDA-MD-468 cells were transfected with nontargeting siRNA (Con), Bag3 siRNA(Bag3), or MVP siRNA (MVP) in the presence of adriamcyin and immunoblotted for Bag3, MVP, ERK, and pERK. D, A quantitative graph of down-regulated pERK in adriamycin treated cells after gene silencing. The results shown are representative of three independent experiments; the histograms represent the average and the error bars represent the standard deviation of the means. Significance was tested by Anova analysis. Asterisk represents p < 0.05.
Next, we examined whether MVP and Bag3 gene-silencing increase apoptosis in these cells. A significant increase in apoptosis was observed when either Bag3 or MVP was silenced in ZR751, MDA-MB-231, and MDA-MB-468 cells (Fig. 8B) 5 days after adriamycin treatment. A more modest increase in apoptosis was observed in the SKBR3 and T47D cells. Next, we examined whether Bag3 and MVP gene-silencing affects ERK1/2 activation in the five cell lines. An overall decrease in ERK1/2 activation was observed in Bag3 and MVP gene-silenced cells, compared with the controls, as shown in the representative experiment (Fig. 8C). We quantitated the level of pERK1/2. pERK1/2 was significantly reduced (p < 0.05) in all cells upon Bag3 gene-silencing and in four cell lines upon MVP gene-silencing (Fig. 8D), supporting our finding that Bag3 and MVP regulate ERK1/2 prosurvival signaling.
DISCUSSION
In this study, we utilized a quantitative SILAC proteomics screen to discover novel mechanisms involved in TIS. Expression of 221 proteins was significantly altered by at least 1.2-fold in TIS. These proteins were classified into different functional networks and assigned to known canonical pathways. Among the proteins regulated by induction of senescence, the two largest functional biological networks were cell death and protein synthesis proteins. At least 50 proteins were associated with cell death. Senescent cells have been shown to resist cell death by inhibiting pro-apoptotic caspases (22) and stabilizing anti-apoptotic molecules such as Bcl-2 (23). Other functional networks include cellular proliferation, cellular morphology and protein degradation (Fig. 2C). Senescent cells undergo large morphological changes developing a large, flattened morphology, and accumulate senescence-associated β-galactosidase (SA-β-gal) activity that distinguishes them from most quiescent cells. In addition, they often down-regulate genes involved in proliferation (24). Senescent cells are metabolically and biosynthetically active and secrete inflammatory mediators essential for senescent cell immune surveillance (25). Recent studies have described a role for the mTOR and autophagic pathways in protein turnover during senescence (26–27). Through cytoplasmic recycling, autophagy provides building blocks for macromolecular synthesis that may support cellular metabolism, protein synthesis, and secretion in senescent cells (25). Using pathway analysis, we identified canonical signaling pathways to be significantly associated with TIS including mTOR signaling, EIF2 signaling, ubiquitination pathways, and metabolic pathways. Both the functional networks and pathways we identified as associated with TIS reflect the previously described cellular changes associated with the oncogenic and replicative senescent phenotypes.
Our screen identified Bag3 as up-regulated during TIS. Bag3 has been shown to be necessary for activation of macroautophagic pathways in fibroblasts (6) and to mitigate proteotoxicity via selective autophagy in cancer cells (28). A general role for Bag3 in apoptosis resistance has been described in nonsmall cell lung cancer cells (29), colon cancer (5), and neuroblastoma cell lines (30). We hypothesized that Bag3 may promote apoptosis resistance in TIS. We also considered the role of Bag3 in autophagy; however, when we examined expression of different autophagy markers - LC3, Atg7, and Beclin after Bag3 gene-silencing, we did not observe significant changes. However, we did demonstrate that Bag3 gene-silencing switches the senescent phenotype to apoptosis implying that Bag3 contributes to apoptosis resistance in TIS. There are several reports that senescent cells are resistant to apoptosis, including studies of fibroblasts and other cellular models (31–32). Resistance to apoptosis has likely evolved as a defense program against sublethal damage caused by cellular stresses.
In order to identify novel mechanisms by which Bag3 may regulate induction of senescence, we explored the Bag3 interactome in adriamycin-treated and untreated MCF7 cells. We identified known interactors of Bag3 including Hsp70 and HspB8 and many novel interacting partners. Among the Bag3 novel interactors, we identified MVP and associated proteins, which form a protein complex that is strongly associated with chemotherapy resistance. MVP has been recently described as associated with resistance to apoptosis in senescent fibroblasts (33). We demonstrated that MVP gene-silencing switches the response from senescence to apoptosis.
MVP is the largest member of the MVP protein complex. Members of the MVP complex include MVP, two minor vault proteins, PARP4 and TEP1, and untranslated small RNAs (34). Vaults are predominantly localized in the cytoplasm, but several reports indicate they can also be localized to the nuclear envelope (35). In senescent fibroblasts, vault proteins are localized to both the nucleus and cytoplasm (31). Our findings suggest that in response to adriamycin, a pool of MVP moves into the nucleus and this shift in MVP subcellular localization is dependent on Bag3. A role for MVP in nucleo-cytoplasmic transport has previously been described for the PTEN tumor suppressor (36). We hypothesize that nuclear MVP plays a role in nuclear import or assembly of macromolecules necessary to maintain the senescent phenotype. The effects of Bag3 on MVP subcellular localization in senescence may reflect a direct role of Bag3 in transporting the protein to the nucleus. Our results suggest that Bag3 may stabilize the total increased cellular level of MVP during senescence so that more protein is available to enter the nucleus.
MVP and Bag3 have been identified as important regulators of intracellular signaling. We examined their role in regulating different signaling pathways implicated in TIS. We examined activation of the MAPK signaling pathways, p38, c-Jun, and ERK1/2 and observed that phosphorylation of ERK1/2 was increased in senescent MCF7 cells. The potentiation of pERK signaling has been previously reported during doxorubicin induced senescence (18), Ras induced oncogenic senescence (37), and recently in primary senescent cells in which ERK1/2 was shown to promote selective degradation of proteins required for cell cycle progression (38). Activation of mTORC1 signaling pathway has also been associated with p53 induced senescence (39). We observed an increase in mTOR phosphorylation upon adriamycin treatment suggesting both ERK1/2 and mTORC1 pathways are activated in senescent MCF7 cells; however, only ERK1/2 phosphorylation was significantly reduced in Bag3 and MVP gene-silenced cells that were treated with adriamycin.
Activated ERK 1/2 has been previously associated with Bag3 and MVP. ERK1/2 binds to MVP, suggesting that vaults may serve as signaling scaffolds for ERK1/2 or in the transport of phospho-ERK1/2 to the nucleus (40). Bag3 has being shown to stabilize the interaction of ERK1/2 with Dual-specificity Phosphatase 1 in HUVECs and in this case, its removal resulted in G1 block not apoptosis implying its role is cell dependent (41). Our results suggest that MVP and Bag3 promote resistance to apoptosis in senescent cells by promoting or sustaining activation of ERK1/2. ERK1/2 is a potent survival signal, which in the face of cellular stress, protects cells from apoptosis. Our data shows that silencing ERK in senescent MCF7 cells results in significant apoptosis. Phospho-ERK functions at multiple sites throughout the cell to regulate diverse processes including survival, proliferation, and cell migration. In order for pERK to promote survival, it must localize to the nucleus. We propose a model in which Bag3 binds to MVP and facilitates MVP accumulation in the nucleus, which sustains ERK1/2 activation.
To determine whether our model is functional in more than one cell line, we measured expression of Bag3 and MVP in five different breast cancer cell lines representing different subtypes, including ERα-positive cells: T47D, ZR751; Her2- positive cells: SKBR3; and Triple-negative cells: MDA-MB 231 and MDA-MB-468. Bag3 and MVP were expressed and the cell cycle inhibitor p21 was induced after adriamycin treatment in all cell lines. ZR751, a p53 wild-type cell line, exhibited the strongest senescence upon adriamycin treatment as previously reported (16). A recent study on p53 mutation in response to chemotherapy showed that doxorubicin-treated p53-mutant tumors failed to arrest proliferation leading to cell death, whereas p53 wild-type MMTV-Wnt1 tumors arrested exhibiting a senescent phenotype. They demonstrated that the senescent tumors with functional p53 responded worse to dose-dense doxorubicin based chemotherapy than tumors with nonfunctional p53 (4). A similar observation was observed in TP53 basal breast cancers to a dose-dense epirubicin-cyclophosphamide regimen (42). Therefore switching the response from senescence to apoptosis in some p53 wild-type breast cancer tumors may prove to be therapeutically beneficial. We examined the levels of cell death in senescent ZR-751 cells after gene silencing of Bag3 and MVP. We observed a significant increase in apoptosis demonstrating that Bag3 and MVP modulate the senescent phenotype to apoptosis in p53 wild-type ZR751 cells.
We also observed a significant increase in apoptosis in the MDA-MB-231 and MDA-MB-468 cells after silencing Bag3 or MVP and adriamycin treatment. These cells provide a model of triple negative breast cancers, which are less responsive to therapy and have a higher recurrence rate than other breast cancer subtypes (43). These results suggest Bag3 and MVP may contribute to apoptosis resistance and cell survival in certain metastatic triple negative cancers and may potentially serve as therapeutic targets. In order to determine whether Bag3 and MVP regulate ERK1/2 in different cell lines, we quantified the level of pERK after silencing these gene products. Interestingly, pERK was significantly reduced in all cells upon Bag3 gene-silencing and in four cell lines upon MVP gene-silencing, supporting our finding in MCF7 cells that Bag3 and MVP regulate ERK1/2 prosurvival signaling.
Using proteomic approaches, we demonstrated that Bag3 and MVP are up-regulated and interact during TIS. We determined that silencing MVP and Bag3 shifts the cellular response to apoptosis after a clinically relevant dose of adriamcyin in senescent MCF7 and ZR751 cells and increases apoptosis in triple negative MDA-MB-231 and MDA-MB-468 breast cancer cell lines. This study implicates Bag3-MVP as an important complex that can regulate the ERK1/2 prosurvival signaling pathway. Our studies suggest that the Bag3-MVP system may be a legitimate target for therapeutics development in breast cancer.
Supplementary Material
Acknowledgments
We thank the PRIDE Team, EMBL-EBI for bioinformatics assistance.
Footnotes
Author contributions: J.A.C. designed research; M.P.P., S.S., R.R., J.S., and J.A.C. performed research; C.B., J.R.Y., R.K., S.L.G., and J.A.C. contributed new reagents or analytic tools; R.P., J.R.Y., S.L.G., and J.A.C. analyzed data; S.L.G. and J.A.C. wrote the paper.
* This work was supported by NIH R01 CA169096 and by the Science Foundation of Ireland.
 This article contains supplemental Figs. S1 to S8 and Tables S1 to S3.
1 The abbreviations used are:
- SA-β-gal
- Senescence-associated beta-galactosidase
- Bag3
- Bcl2-associated athanogene 3
- TIS
- Therapy induced senescence
- MVP
- Major Vault Protein
- HSP
- Heat shock protein
- PARP4
- Poly (ADP-ribose) polymerase family, member 4
- TEP1
- Telomerase associated protein 1
- ERK
- Extracellular signal-regulated kinase
- JNK
- Jun Kinase.
REFERENCES
- 1. Schmitt C. A. (2007) Cellular senescence and cancer treatment. Biochim. Biophys. Acta 1775, 5–20 [DOI] [PubMed] [Google Scholar]
- 2. Campisi J., d'Adda di Fagagna F. (2007) Cellular senescence: when bad things happen to good cells. Nat. Rev. Mol. Cell Biol. 8, 729–740 [DOI] [PubMed] [Google Scholar]
- 3. Dorr J. R., Yu Y., Milanovic M., Beuster G., Zasada C., Dabritz J. H., Lisec J., Lenze D., Gerhardt A., Schleicher K., Kratzat S., Purfurst B., Walenta S., Mueller-Klieser W., Graler M., Hummel M., Keller U., Buck A. K., Dorken B., Willmitzer L., Reimann M., Kempa S., Lee S., Schmitt C. A. (2013) Synthetic lethal metabolic targeting of cellular senescence in cancer therapy. Nature 501, 421–425 [DOI] [PubMed] [Google Scholar]
- 4. Jackson J. G., Pant V., Li Q., Chang L. L., Quintas-Cardama A., Garza D., Tavana O., Yang P., Manshouri T., Li Y., El-Naggar A. K., Lozano G. (2012) p53-mediated senescence impairs the apoptotic response to chemotherapy and clinical outcome in breast cancer. Cancer Cell 21, 793–806 [DOI] [PMC free article] [PubMed] [Google Scholar]
- 5. Jacobs A. T., Marnett L. J. (2009) HSF1-mediated BAG3 expression attenuates apoptosis in 4-hydroxynonenal-treated colon cancer cells via stabilization of anti-apoptotic Bcl-2 proteins. J. Biol. Chem. 284, 9176–9183 [DOI] [PMC free article] [PubMed] [Google Scholar]
- 6. Gamerdinger M., Hajieva P., Kaya A. M., Wolfrum U., Hartl F. U., Behl C. (2009) Protein quality control during aging involves recruitment of the macroautophagy pathway by BAG3. EMBO J. 28, 889–901 [DOI] [PMC free article] [PubMed] [Google Scholar]
- 7. Boiani M., Daniel C., Liu X., Hogarty M. D., Marnett L. J. (2013) The stress protein BAG3 stabilizes Mcl-1 protein and promotes survival of cancer cells and resistance to antagonist ABT-737. J. Biol. Chem. 288, 6980–6990 [DOI] [PMC free article] [PubMed] [Google Scholar]
- 8. Ulbricht A., Eppler F. J., Tapia V. E., van der Ven P. F., Hampe N., Hersch N., Vakeel P., Stadel D., Haas A., Saftig P., Behrends C., Furst D. O., Volkmer R., Hoffmann B., Kolanus W., Hohfeld J. (2013) Cellular mechanotransduction relies on tension-induced and chaperone-assisted autophagy. Curr. Biol. 23, 430–435 [DOI] [PubMed] [Google Scholar]
- 9. Rosati A., Graziano V., De Laurenzi V., Pascale M., Turco M. C. (2011) BAG3: a multifaceted protein that regulates major cell pathways. Cell Death Dis. 2, e141. [DOI] [PMC free article] [PubMed] [Google Scholar]
- 10. Gamerdinger M., Kaya A. M., Wolfrum U., Clement A. M., Behl C. (2011) BAG3 mediates chaperone-based aggresome-targeting and selective autophagy of misfolded proteins. EMBO Rep. 12, 149–156 [DOI] [PMC free article] [PubMed] [Google Scholar]
- 11. Peng J., Elias J. E., Thoreen C. C., Licklider L. J., Gygi S. P. (2003) Evaluation of multidimensional chromatography coupled with tandem mass spectrometry (LC/LC-MS/MS) for large-scale protein analysis: the yeast proteome. J. Proteome Res. 2, 43–50 [DOI] [PubMed] [Google Scholar]
- 12. McDonald W. H., Tabb D. L., Sadygov R. G., MacCoss M. J., Venable J., Graumann J., Johnson J. R., Cociorva D., Yates J. R., 3rd. (2004) MS1, MS2, and SQT–three unified, compact, and easily parsed file formats for the storage of shotgun proteomic spectra and identifications. Rapid Commun. Mass Spectrom. 18, 2162–2168 [DOI] [PubMed] [Google Scholar]
- 13. MacCoss M. J., Wu C. C., Liu H., Sadygov R., Yates J. R., 3rd. (2003) A correlation algorithm for the automated quantitative analysis of shotgun proteomics data. Anal. Chem. 75, 6912–6921 [DOI] [PubMed] [Google Scholar]
- 14. Yates J. R., 3rd, Park S. K., Delahunty C. M., Xu T., Savas J. N., Cociorva D., Carvalho P. C. (2012) Toward objective evaluation of proteomic algorithms. Nat. Methods 9, 455–456 [DOI] [PMC free article] [PubMed] [Google Scholar]
- 15. Park S. K., Venable J. D., Xu T., Yates J. R., 3rd. (2008) A quantitative analysis software tool for mass spectrometry-based proteomics. Nat. Methods 5, 319–322 [DOI] [PMC free article] [PubMed] [Google Scholar]
- 16. Chang B. D., Broude E. V., Dokmanovic M., Zhu H., Ruth A., Xuan Y., Kandel E. S., Lausch E., Christov K., Roninson I. B. (1999) A senescence-like phenotype distinguishes tumor cells that undergo terminal proliferation arrest after exposure to anticancer agents. Cancer Res. 59, 3761–3767 [PubMed] [Google Scholar]
- 17. Elmore L. W., Rehder C. W., Di X., McChesney P. A., Jackson-Cook C. K., Gewirtz D. A., Holt S. E. (2002) Adriamycin-induced senescence in breast tumor cells involves functional p53 and telomere dysfunction. J. Biol. Chem. 277, 35509–35515 [DOI] [PubMed] [Google Scholar]
- 18. Helmbold H., Komm N., Deppert W., Bohn W. (2009) Rb2/p130 is the dominating pocket protein in the p53-p21 DNA damage response pathway leading to senescence. Oncogene 28, 3456–3467 [DOI] [PubMed] [Google Scholar]
- 19. Taylor J. R., Lehmann B. D., Chappell W. H., Abrams S. L., Steelman L. S., McCubrey J. A. (2011) Cooperative effects of Akt-1 and Raf-1 on the induction of cellular senescence in doxorubicin or tamoxifen treated breast cancer cells. Oncotarget 2, 610–626 [DOI] [PMC free article] [PubMed] [Google Scholar]
- 20. Balmanno K., Cook S. J. (2009) Tumour cell survival signalling by the ERK1/2 pathway. Cell Death Differ. 16, 368–377 [DOI] [PubMed] [Google Scholar]
- 21. Allan L. A., Morrice N., Brady S., Magee G., Pathak S., Clarke P. R. (2003) Inhibition of caspase-9 through phosphorylation at Thr 125 by ERK MAPK. Nat. Cell Biol. 5, 647–654 [DOI] [PubMed] [Google Scholar]
- 22. Marcotte R., Lacelle C., Wang E. (2004) Senescent fibroblasts resist apoptosis by downregulating caspase-3. Mech. Ageing Dev. 125, 777–783 [DOI] [PubMed] [Google Scholar]
- 23. Rincheval V., Renaud F., Lemaire C., Godefroy N., Trotot P., Boulo V., Mignotte B., Vayssiere J. L. (2002) Bcl-2 can promote p53-dependent senescence versus apoptosis without affecting the G1/S transition. Biochem. Biophys. Res. Commun. 298, 282–288 [DOI] [PubMed] [Google Scholar]
- 24. Narita M., Nunez S., Heard E., Narita M., Lin A. W., Hearn S. A., Spector D. L., Hannon G. J., Lowe S. W. (2003) Rb-mediated heterochromatin formation and silencing of E2F target genes during cellular senescence. Cell 113, 703–716 [DOI] [PubMed] [Google Scholar]
- 25. White E., Lowe S. W. (2009) Eating to exit: autophagy-enabled senescence revealed. Genes Dev. 23, 784–787 [DOI] [PubMed] [Google Scholar]
- 26. Young A. R., Narita M., Ferreira M., Kirschner K., Sadaie M., Darot J. F., Tavare S., Arakawa S., Shimizu S., Watt F. M., Narita M. (2009) Autophagy mediates the mitotic senescence transition. Genes Dev. 23, 798–803 [DOI] [PMC free article] [PubMed] [Google Scholar]
- 27. Young A. R., Narita M., Narita M. (2011) Spatio-temporal association between mTOR and autophagy during cellular senescence. Autophagy 7, 1387–1388 [DOI] [PubMed] [Google Scholar]
- 28. Rapino F., Jung M., Fulda S. (2014) BAG3 induction is required to mitigate proteotoxicity via selective autophagy following inhibition of constitutive protein degradation pathways. Oncogene 33, 1713–1724 [DOI] [PubMed] [Google Scholar]
- 29. Zhang Y., Wang J. H., Lu Q., Wang Y. J. (2012) Bag3 promotes resistance to apoptosis through Bcl-2 family members in nonsmall cell lung cancer. Oncology Rep. 27, 109–113 [DOI] [PubMed] [Google Scholar]
- 30. Brendel A., Felzen V., Morawe T., Manthey D., Behl C. (2013) Differential regulation of apoptosis-associated genes by estrogen receptor alpha in human neuroblastoma cells. Restor. Neurol. Neurosci. 31, 199–211 [DOI] [PubMed] [Google Scholar]
- 31. Ryu S. J., Park S. C. (2009) Targeting major vault protein in senescence-associated apoptosis resistance. Expert Opin. Ther. Targets 13, 479–484 [DOI] [PubMed] [Google Scholar]
- 32. Crescenzi E., Palumbo G., Brady H. J. (2003) Bcl-2 activates a program of premature senescence in human carcinoma cells. Biochem. J. 375, 263–274 [DOI] [PMC free article] [PubMed] [Google Scholar]
- 33. Ryu S. J., An H. J., Oh Y. S., Choi H. R., Ha M. K., Park S. C. (2008) On the role of major vault protein in the resistance of senescent human diploid fibroblasts to apoptosis. Cell Death Differ. 15, 1673–1680 [DOI] [PubMed] [Google Scholar]
- 34. Berger W., Steiner E., Grusch M., Elbling L., Micksche M. (2009) Vaults and the major vault protein: novel roles in signal pathway regulation and immunity. Cell. Mol. Life Sci. 66, 43–61 [DOI] [PMC free article] [PubMed] [Google Scholar]
- 35. van Zon A., Mossink M. H., Houtsmuller A. B., Schoester M., Scheffer G. L., Scheper R. J., Sonneveld P., Wiemer E. A. (2006) Vault mobility depends in part on microtubules and vaults can be recruited to the nuclear envelope. Exp. Cell Res. 312, 245–255 [DOI] [PubMed] [Google Scholar]
- 36. Chung J. H., Ginn-Pease M. E., Eng C. (2005) Phosphatase and tensin homolog deleted on chromosome 10 (PTEN) has nuclear localization signal-like sequences for nuclear import mediated by major vault protein. Cancer Res. 65, 4108–4116 [DOI] [PubMed] [Google Scholar]
- 37. Kilbey A., Terry A., Cameron E. R., Neil J. C. (2008) Oncogene-induced senescence: an essential role for Runx. Cell Cycle 7, 2333–2340 [DOI] [PMC free article] [PubMed] [Google Scholar]
- 38. Deschenes-Simard X., Gaumont-Leclerc M. F., Bourdeau V., Lessard F., Moiseeva O., Forest V., Igelmann S., Mallette F. A., Saba-El-Leil M. K., Meloche S., Saad F., Mes-Masson A. M., Ferbeyre G. (2013) Tumor suppressor activity of the ERK/MAPK pathway by promoting selective protein degradation. Genes Dev. 27, 900–915 [DOI] [PMC free article] [PubMed] [Google Scholar]
- 39. Korotchkina L. G., Leontieva O. V., Bukreeva E. I., Demidenko Z. N., Gudkov A. V., Blagosklonny M. V. (2010) The choice between p53-induced senescence and quiescence is determined in part by the mTOR pathway. Aging 2, 344–352 [DOI] [PMC free article] [PubMed] [Google Scholar]
- 40. Liang P., Wan Y., Yan Y., Wang Y., Luo N., Deng Y., Fan X., Zhou J., Li Y., Wang Z., Yuan W., Tang M., Mo X., Wu X. (2010) MVP interacts with YPEL4 and inhibits YPEL4-mediated activities of the ERK signal pathway. Biochem. Cell Biol. 88, 445–450 [DOI] [PubMed] [Google Scholar]
- 41. Falco A., Festa M., Basile A., Rosati A., Pascale M., Florenzano F., Nori S. L., Nicolin V., Di Benedetto M., Vecchione M. L., Arra C., Barbieri A., De Laurenzi V., Turco M. C. (2012) BAG3 controls angiogenesis through regulation of ERK phosphorylation. Oncogene 31, 5153–5161 [DOI] [PubMed] [Google Scholar]
- 42. Bertheau P., Turpin E., Rickman D. S., Espie M., de Reynies A., Feugeas J. P., Plassa L. F., Soliman H., Varna M., de Roquancourt A., Lehmann-Che J., Beuzard Y., Marty M., Misset J. L., Janin A., de The H. (2007) Exquisite sensitivity of TP53 mutant and basal breast cancers to a dose-dense epirubicin-cyclophosphamide regimen. PLoS Med. 4, e90. [DOI] [PMC free article] [PubMed] [Google Scholar]
- 43. Stevens K. N., Vachon C. M., Couch F. J. (2013) Genetic susceptibility to triple-negative breast cancer. Cancer Res. 73, 2025–2030 [DOI] [PMC free article] [PubMed] [Google Scholar]
Associated Data
This section collects any data citations, data availability statements, or supplementary materials included in this article.