

Abstract
Antibodies play an important role in modern science and medicine. They are essential in many biological assays and have emerged as an important class of therapeutics. Unfortunately, current methods for mapping antibody epitopes require costly synthesis or enrichment steps, and no low-cost universal platform exists. In order to address this, we tested a random-sequence peptide microarray consisting of over 330,000 unique peptide sequences sampling 83% of all possible tetramers and 27% of pentamers. It is a single, unbiased platform that can be used in many different types of tests, it does not rely on informatic selection of peptides for a particular proteome, and it does not require iterative rounds of selection.
In order to optimize the platform, we developed an algorithm that considers the significance of k-length peptide subsequences (k-mers) within selected peptides that come from the microarray. We tested eight monoclonal antibodies and seven infectious disease cohorts. The method correctly identified five of the eight monoclonal epitopes and identified both reported and unreported epitope candidates in the infectious disease cohorts. This algorithm could greatly enhance the utility of random-sequence peptide microarrays by enabling rapid epitope mapping and antigen identification.
Antibodies play a central role in the immune system and in modern health care and medical research. They are commonly used as affinity reagents in research and diagnostic applications and have emerged as an important class of therapeutics (1). When new affinity reagents are being generated, it is useful to know the target sequence (epitope) bound by the antibody in question. Many methods have been developed to accomplish this, including peptide tiling and phage, bacteria, and mRNA display (2–4). Especially for newly discovered diseases, such as Middle East respiratory syndrome (5), knowing the epitope(s) that elicits a humoral response enables the production of diagnostics and vaccines. Large-scale mapping of cohorts infected with the same disease may guide the development of universal vaccines for flu and other infections. Crystal structure and B-cell sequencing provide the most detailed information about antibody targeting, but in practice these are cost prohibitive and rarely done. Library-panning-type approaches use bacteria or phages to display peptide sequences, avoiding costly crystallization or synthesis steps, and are common approaches for linear epitope mapping (3, 6). Recently, bacterial display methods have been used to discover antigens in celiac disease (2). Tools for probing the “memory” of the immune system could reveal a wealth of information about an individual's health status and antibody repertoire. Although display techniques are effective and result in highly accurate and specific linear epitope determination (7, 8), they have hidden and poorly understood biases regarding sequence populations (9–11) and rely on selection steps that eliminate certain sequences in favor of others. This creates issues with cost and reliability at scale, and information is discarded as the selection process becomes increasingly stringent. As a rapid identification method, panning is not optimal.
Peptide array technologies provide an alternative approach. They are simple and reproducible, they provide information about binders and non-binders, and they can be low cost if mass produced, but they represent a smaller sequence library than phage display and contain only linear sequences. This might seem like a disadvantage, but in practice, linear epitopes are actually quite common in nature, and even mimotopes can provide useful, if indirect, information about non-linear epitopes. Microarrays containing hundreds of thousands of peptides are becoming more accessible, reducing the impact of smaller libraries. Additionally, microarrays are capable of displaying interactions between antibodies and peptides with short, gapped sequences containing four to six anchor residues, which seem to cover a sizable class of antibodies (12, 13).
To date the most common approach to designing peptide microarrays has been to tile sequences from a known protein or proteome of interest and find sequences that bind the target (4, 14–17). Recently this technique has been scaled to whole proteomes using arrays containing millions of sequences (14, 16). This approach is effective on a single-protein scale, but problems arise when one is looking for specific epitope sequences in the presence of millions of other peptides. Cross-reactivity of antibodies to non-target peptides often obscures the eliciting antigen (14). This might be due in part to the fact that tiled peptides are fundamentally different from folded proteins, and inaccessible parts of a protein are likely to be exposed when linear pieces of it are tiled. Additionally, there are many common n-mers across apparently unrelated pathogens. It might be possible to address this problem using motif-based discovery rather than peptide-based discovery. Short motifs (4- to 5-mers) will likely appear multiple times in a given peptide library. Longer sequences (6- to 12-mers) should appear more rarely. We propose that a platform for epitope discovery should focus on representing as many unique short motifs as possible, rather than providing longer, overlapping sequences from a particular set of proteins.
Previously our group used random-sequence peptide microarrays to diagnose disease using immunosignatures (18, 19). The immunosignaturing effect relies on the interaction of serum antibodies with random-sequence peptides bound to a microarray. When properly trained on well-validated cohorts, this indirect information provides very discerning and predictive information about disease states in blinded individuals (18, 20–23). Although immunosignatures are sensitive and specific as a diagnostic tool, a link has not been established between immunosignature profiles and actual sequences of signature peptides. This was attempted in a previous study by our group in which we evaluated an array of 10,000 17-mer peptides as a platform for epitope mapping. Although useful for predicting linear sequences for some monoclonal antibodies, it offered virtually no predictive power in serum samples from mice immunized to a known antigen (24). Since then, advances in in situ synthesis techniques have enabled our group to produce microarrays containing several million peptides per slide (25). These arrays contain >27% of possible pentamers and 83% of possible tetramers. Although it lacks the majority of pentamers, this is a fairly dense sampling of short peptide sequences that might be useful for epitope mapping.
Here we report on a general approach that uses random sequence peptide arrays to map epitopes. We demonstrated this by identifying epitope sequences from a set of monoclonal antibodies. We then used the same technique with different disease cohorts containing antibodies of unknown specificity, revealing both previously discovered and new epitopes. The study described here is the first attempt at deciphering a microarray with fixed but random peptide sequences for epitopes that does not a priori assume a set of eliciting proteins.
MATERIALS AND METHODS
Array Construction
Peptide microarrays were manufactured using in situ synthesis of 330,000 random-sequence peptides per each 1-cm2 region. Each 75 mm × 25 mm slide contained 24 subarrays, each containing the 330,000 peptides. The average length of each peptide was 11.2 amino acids with a standard deviation of ±1.3, normally distributed. The longest peptide was 22 amino acids long, and the shortest was 1 amino acid, with 95% of peptides between 8 amino acids and 14 amino acids. Peptides were synthesized from the C terminus to the N terminus, with the amine group farthest from the array surface. Prior to assay, they were washed in 100% N,N-dimethylformamide for one hour and then introduced to an incubation buffer consisting of 3% BSA in PBS with 0.05% Tween 20 over a period of six hours to allow the solvent phase to completely transition to the aqueous phase. The arrays were then processed via incubation in the presence of antibodies or serum and detected by fluorescent antibody (see “Methods” in Ref. 25).
Binding of Antibodies to the Array
Residual N,N-dimethylformamide was removed by two 5-min washes in distilled water. Arrays were equilibrated in PBS for 30 min and blocked in the incubation buffer. Arrays were washed and briefly spun dry prior to being loaded into the 24-well gasket (Array-It, Santa Clara, CA). Incubation buffer was added to each well (100 μl), and 100 μl of 1:2500 diluted sera was added for a final concentration of 1:5000. Arrays were incubated for 1 h at 23 °C with rocking and then washed with incubation buffer plus 1% BSA using a BioTek 405TS plate washer (Biotek, Winooski, VT). Anti-human IgG-DyLight 549 (KPL, Gaithersburg, MD) was added to a final concentration of 5.0 nm to detect the human primary IgG. Unbound secondary antibody was then removed by washing in incubation buffer followed by washing in distilled water (5 min each). The arrays were removed from the gasket while submerged, dunked in isopropanol, and centrifuged dry (800 × g, 5 min). Arrays were scanned at 533 nm using an Innoscan 910 array scanner (Innopsys, Carbonne, France). Features were aligned and extracted using GenePix Pro 6.0 (Molecular Devices, Sunnyvale, CA).
Monoclonal Antibodies
Eight monoclonal antibodies were used in this study: anti-human HA (Rockland Antibodies, Rockland, MD, [YPYDVPDYA]), DM1A (anti-human tubulin, Invitrogen/Invitrogen, [AALEKDYEEVGV]), Ab1 (anti-human TP53 antibodies, Clontech, Palo Alto, CA, [TFRHSVVV]), FLAG (Invitrogen, Madison, WI, [DYKDDDDK]), 4C1 (anti-human TSHR, Santa Cruz Biotechnology, Dallas, TX, [QAFDSHY]), A10 (Acris Antibodies GmbH, Hiddenhausen, Germany, [EEDFRV]), Ab8 (Anti-human P53, Thermo Fisher Scientific, Waltham, MA, [TFSDLWKLLPE]), and 2C11 (Acris Antibodies GmbH, [NAHYYVFFEEQE]).
Serum Samples
Sera from seven different disease cohorts and 10 pools of healthy persons (designated as Human Normal Pool) were provided by Seracare Life Sciences (Milford, MA). An additional control group of 32 different non-infected volunteers was collected from consenting individuals by the Center for Innovations in Medicine at Arizona State University under IRB# 0905004024 (renewed April 2014). The eight cohorts used in this study included 32 healthy (Normals), 9 dengue fever (DEN1 Flaviviridae), 8 Lyme disease (Borrelia burgdorferii), 7 syphilis (Treponema palladium), 13 malaria (Plasmodium falciparum), 12 whooping cough (Bordetella pertussis), 15 hepatitis B virus (Hepadnavirus), and 10 mixed pools of normal subjects (Healthy Normal Pool).
Analytical Methods
Finding Antibody-specific Peptides
The goal of this study was to find sequence motifs corresponding to an epitope. The first step was to identify peptides that bind specifically to the sample of interest without regard to the peptide sequence. First, arrays were normalized to the median intensity value to account for small differences in serum or dye concentrations. Then, the fold-change was calculated per peptide across the sample of interest (numerator) versus the median of control samples (denominator). The controls for the serum study comprised the 32 healthy volunteers referred to as Normals. The controls for the monoclonal antibody study were a mix of all monoclonal antibodies in this study. For each test, the top 500 peptides were used as seed sequences for epitope discovery.
Maximal Subsequence Algorithm
The algorithm used to find high binding subsequences was designed to find short consensus motifs within a large set of random peptides. It can be divided into two parts: motif identification and significance testing. Seed sequences are computationally divided into all possible subsequences within a certain range of lengths (three to seven amino acids). The sets of these subsequences Sx are ranked and evaluated for significance in subsequent steps. The input to the algorithm is a set of sequences S = {s1, s2, …, sn} and associated preprocessed array intensity values Q = {q1, q2, …, qn}. To find a set of significant subsequences, the sequences in S are divided into all possible subsequences containing between three and seven amino acids each. For example, the sequence AVHAD would be divided into the set {AVH, VHA, HAD, AVHA, VHAD, AVHAD}.
All the subsequences in S constitute a new set, S′. Members in S′ have one or more associated values in Q corresponding to the intensities from parent sequences containing that subsequence. We define the function Qsub as S′ → Qm, where m is the number of peptides excepting the top 500 seed peptides containing the input subsequence. This gives all intensity values associated with a subsequence.
Sequences si ϵ Sx are ranked according to their associated values ti = Qsub(si). A subsequence is considered only if it appears in at least three peptides (ti > 3). We term this value the support of the subsequence. The ranking function considers the support and the median intensity value median(ti), such that the highest ranked subsequences have at least three appearances on the array and have high median intensities. This criterion is not strictly necessary, but it simplifies significance testing by throwing out non-significant, poorly represented sequences. Once subsequences are filtered and ranked, their significance can be established. This occurs for a given subsequence i using the following nonparametric procedure:
Draw ti values from Q at random. Call this vector t′i.
Compute median(t′i).
Repeat steps one and two 10,000 times, resulting in a nonparametric estimate of a ti null distribution. Call this vector D.
A p value is computed for subsequence si according to pi = [ΣkϵDI(median(t′i) > k)]/|D|, where I is the indicator function.
Correct the p values for multiple hypotheses. We used the following correction function: p′i = pi/[ΣsiϵSx |Qsub(si)|]. For example, if 1000 subsequences are considered, α is 1/1000, resulting in one expected false positive.
Calling Epitope Candidates
Significant subsequences were identified for each individual per disease cohort. In order to determine the most likely epitope candidates, we ranked sequences in terms of the number of subjects in which they were called significant. The sequences that appeared most often in different individuals within the same group were deemed the most likely epitope candidates (Fig. 4A).
Fig. 4.

Top significant subsequences for disease cohorts. A, the top 10 most commonly appearing and significant subsequences in serum samples from the indicated disease cohorts. The number of patients within that cohort for which that sequence was called significant is shown in parentheses to the left. The y-axis is categorical and shows each subsequence; the x-axis is the maximum log10-normalized intensity of the peptide binding on the array for each patient. The total number of samples in each cohort is given as a fraction at the top. Subsequences with exact matches to proteins within the pathogen are indicated with vertical red bars. The top ranked sequences are listed in Table III. B, the pairwise fractional overlap in significant subsequences. A colored, saturated cell represents a pair of patients in the same cohort that shared at least 50% of their significant subsequences. Grayscale cells represent pairs of patients from different cohorts whose immune systems see similar sequences. Individuals within the same disease cohort showed much more overlap between their significant subsequences than those in different cohorts or the normal cohort, indicating an association between the discovered sequences and the disease state. BPE, Bordetella pertussis; HNP, Human Normal Pools, a collection of pools of non-disease individuals.
Mapping Epitope Candidates to Pathogen Proteomes
The most common significant subsequences (query sequences) were searched against the pathogen proteome for 100% identity. We assessed the probability of a match by searching randomly drawn array sequences of the same length as the query sequence against the proteome and comparing the expected number of matches to those observed with the query.
Pathogen Identification
Our objective was to identify an unknown pathogen based on array sequence information alone. The n significant subsequences from the same cohort were pairwise aligned using the BLOSUM62 substitution matrix, producing an (n × n) matrix of alignment scores. This matrix was hierarchically clustered by single linkage, producing a dendrogram of related subsequences. This analysis revealed peaks of central subsequences that were presumed to be most closely related to the true epitope. These peak sequences were searched against a database of 596 proteomes (hereinafter called the Pathogen Proteome Database) from various strains of pathogenic bacteria, viruses, and protists causing over 100 different diseases. Those proteins and organisms matching all queried sequences with 100% or 80% identity were noted. We determined probabilities by querying the database with randomly drawn sequences as above.
Minimum Required Sequence Information
In order to find the point at which pathogen proteins could be resolved from a database given fixed epitope information, we generated several sets of random sequences ranging in length from four to seven amino acids. Pairs of sequences with set lengths were drawn from this set and queried against two databases: one containing 596 human pathogens, and another containing over 5000 bacteria, viral, and eukaryotic proteomes. These two databases helped establish the point at which pathogens could be uniquely resolved. For example, any given trimer sequence would be present in many pathogen proteins, but two heptamer sequences are unlikely to appear in a given pathogen protein by chance.
Sequence Logo Generation
Significant subsequences were collected together into a FASTA-formatted list. Multiple alignments were produced with ClustalW2 (26). A multiple-alignment text file was used as input to WebLogo3 (27) using default settings, producing the motif figure.
E-value Calculations
The reported E-values were calculated by searching random re-orderings (with replacement) of the candidate subsequence against the target proteome, using the mean number of occurrences of 10,000 re-orderings as the E-value.
RESULTS
We first asked whether we could predicatively map epitopes to well-characterized monoclonal antibodies. Eight antibodies with reactivity to a known linear sequence were chosen and analyzed.
Epitope Determination in Monoclonal Antibodies
Table I lists peptides and binding intensities for the eight different monoclonal antibodies. The linear epitope for each monoclonal antibody was known and was used as the basis for algorithm development and testing. In most cases, simply sorting peptides by intensity per monoclonal antibody was insufficient to reveal epitope motifs among the highest binding peptides. Variation in binding to a specific target comes in part from the amount of non-cognate binding. Highly promiscuous antibodies such as anti-HA bind large numbers of peptides with low similarity to the target, and this created a lack of specificity in our datasets (Fig. 1, Table II). However, transforming the data in terms of peptide subsequences revealed highly specific and consistent motifs that corresponded to epitope targets in five of the tested antibodies. Motifs were similar to the exact eliciting peptide sequence. Even when the exact sequence was not present on the array, sequences very similar to the eliciting peptide predominated (Figs. 1 and 2). Three of the tested antibodies did not generate a specific response to the expected target sequence. In one of these cases (P53Ab8), the epitope SDLWKL was bound, but because of the high degree of cross-reactivity to non-sequence-similar peptides, one would not expect to map the epitope based on these results alone (Fig. 3A).
Table I. Monoclonal antibodies used in this study.
| Epitope | Ab name | Immunogen | Isotype | pI | GRAVY | Mean signal intensity | Mapped predicatively |
|---|---|---|---|---|---|---|---|
| EEDFRV | A10 | Human Pol II | IgG2b | 4.1 | −1.3 | 4911 | No |
| SDLWKL | p53ab8 | Human p53 | IgG2b, IgG2a | 5.6 | −0.3 | 6243 | No |
| QAFDSH | 4C1 | Human insulin receptor | IgG2a | 5.1 | −1.1 | 971 | Yes |
| RHSVV | p53ab1 | Human p53 | IgG1 | 9.8 | 0 | 5074 | Yes |
| DYKDDDDK | FLAG | FLAG peptide | IgG1 | 4 | −3.3 | 1167 | Yes |
| AALEKD | DM1A | Human tubulin α | IgG1κ | 4.7 | −0.6 | 5798 | Yes |
| YPYDVPDYA | HA | HA peptide | IgG1 | 3.6 | −0.9 | 905 | Yes |
| NAHYYVFFEEQE | 2C11 | Human insulin receptor | IgG1 | 4.5 | −1 | 827 | No |
Monoclonal antibodies were used to test the motif search analysis algorithm. The highest rated subsequences were related to the true epitope and to each other to an extent that ensured the emergence of a conserved motif with strong association to the epitope sequence. Ab, antibody; GRAVY, grand average of hydropathicity index (25).
Fig. 1.

Top binding subsequences and peptides for eight tested monoclonal antibodies. The bar plots show the top binding subsequences (top panel) and subsequences (bottom panel) for each of the eight tested monoclonal antibodies. P53Ab1 (RHSVV), HA (DVPD), 4C1 (FDSH), and FLAG (DYDDDK) each had on-target motifs that were identified within each of the top binding peptides, and these were enhanced through subsequence analysis (shown in red). DM1A (ALEKD) had few on-target motifs in its top peptides, but subsequence analysis revealed the true epitope. FLAG cross-reacted most strongly with the epitope from DM1A (ALEKDY), but subsequence analysis successfully removed this effect.
Table II. On-target versus off-target binding.
| Total binders | On target | Fraction | |
|---|---|---|---|
| AB1 | 42,386 | 466 | 1.10 × 10⁻² |
| HA | 1608 | 53 | 3.30 × 10⁻² |
| 4C1 | 2561 | 276 | 1.08 × 10⁻¹ |
| FLAG | 7563 | 0 | 0 |
| DM1A | 44,821 | 207 | 4.62 × 10⁻³ |
| A10 | 44,924 | 37 | 8.24 × 10⁻⁴ |
| AB8 | 46,327 | 1 | 2.16 × 10⁻⁵ |
| 2C11 | 671 | 0 | 0 |
This table shows the number of peptides for each antibody that yielded a signal greater than 5-fold above background (“total binders”) and how many of those had at least 80% sequence identity with the true epitope (“on target”). See Table I for a list of true epitopes. A very low percentage (<11%) of the binding peptides had strong sequence similarity with the true epitope, in agreement with previous studies (24).
Fig. 2.

Monoclonal antibody motifs and their corresponding epitopes. A, the five motifs listed were revealed after we incubated monoclonal antibodies on the peptide microarrays and performed subsequence analysis. Sequence logos were created using the top 10 most highly ranked subsequences obtained from the peptide sequences. Weblogos suggested positional dependence with dominating anchor residues and linking or non-anchor regions. “True epitope” is the sequence determined by the manufacturer. “Inter-alignment” is the expected value of pairwise gapless alignment scores (BLOSUM62 matrix) between any two significant subsequences pulled from the arrays. “Fold change” indicates the relative binding strength of the peptides making up the motif versus the median binding intensity for that peptide in the other monoclonal antibodies tested. Antibodies for which consensus motifs could not be found were A10 (EEDFRV), p53Ab8 (SDLWKL), and 2C11 (NAHYYVFFEEQE). Additional information about these antibodies and their immunogens can be found in Table I. B, histograms of each monoclonal antibody tested. The x-axis is the log10 normalized signal intensity, and the y-axis is the data density. Antibodies demonstrated varied binding profiles, with monoclonals such as HA, 4C1, and FLAG showing a narrow distribution around low intensities, and others such as AB1 and DM1A demonstrating a broader binding profile. See Table II for an analysis of on-target versus off-target binding.
Fig. 3.

Sequence representation and predictive versus non-predictive subsequences. A, top 25 sequence motifs found for monoclonal antibodies HA (left) and p53 (right). Red outlined regions indicate the closest match to the actual epitope for the given monoclonal antibody. The black number is the average fold change of the peptides containing the indicated motif relative to the same peptides for all other monoclonal antibodies. Although small differences occurred, there is a consensus pattern. In contrast, p53Ab1 (right) demonstrated high overall binding to the true epitope but cross-reacted with many other sequence clusters, preventing good prediction and yielding low fold-change values. B, the fraction of all possible k-mers present on the array as a function of k-mer length. The arrays represent 27% of all possible 5-mers redundantly.
The success rate in mapping linear epitopes on monoclonal antibodies was encouraging in that it implied the possibility of quickly mapping disease-associated epitopes in patient sera. In order to test this hypothesis, we next performed similar experiments using sera from patients infected with various diseases.
Groupwise Epitope Determination in Patient Sera
Eight cohorts representing seven different diseases and one group of healthy volunteers were tested using the described methods. Several of the cohorts performed similarly to the monoclonal antibodies in that they identified a relatively small number of peptides with highly homogeneous sequence motifs that were obvious and visible by simple text matching. These cohorts produced a noticeably homogeneous list of peptide sequences that deviated little from a single and readily apparent motif. The multiple alignments of the top 10 sequences for each of these disease cohorts are shown in Fig. 4B. Of the seven disease cohorts tested, five revealed a clear consensus sequence.
Consensus Sequences in Pathogen Proteomes
In order to test whether the groupwise consensus motifs (Fig. 3) corresponded with true epitopes, we searched the Immune Epitope Database for exact substring matches to sequences from our lists. Despite the small size of this database, the sequence AVHAD from dengue was present in the database and indicated as an epitope from the NS1 protein in two dengue strains (E-value: 5 × 10⁻⁴). Further analysis of the other cohorts revealed additional matches to antigenic proteins. The sequence EDAK from Borrelia mapped to known antigen OspF (E-value: 4.6), and DYAFG from syphilis mapped to a lipoprotein in several strains of T. pallidum (E-value: 0.27). Malaria contained sequences SNKQG and RLKEP (Fig. 6), both of which mapped to the ring-infect erythrocyte surface antigen (RESA)1 protein in P. falciparum 3D7 (E-value: 0.072), and another sequence (DAFEY) mapping to one of the pfEMP1 variants in P. falciparum (E-value: 3.5). The sequence FKEG mapped to an MDR efflux protein in B. pertussis (E-value: 3.5). These results are summarized in Table III. These sequences were short as a result of platform limitations, and the E-values for these matches varied based on the size of the proteome. The dengue sequences are unlikely to arise by chance, at least given the size of the initial peptide library, with E-values < 10−3. Likewise, the two matches to the RESA protein in P. falciparum together had a low E-value of 0.072 corresponding to a p value of 0.067 (see Table IV).
Fig. 6.

Finding arbitrary sequences in a pathogen database. Plots show the distribution of hits to pairs of arbitrary sequences of fixed lengths. Pairs of k-mers with specified lengths were drawn at random from the distribution associated with array sequences. These were searched against two databases, one containing over 4000 bacteria and viruses (top), and another containing 596 human pathogens (bottom). The plots suggest that when two 7-mer linear epitopes from the same protein antigen are known with at least 80% identity, unique pathogen identification is reliably predicted.
Table III. Proposed epitope mappings for disease cohorts.
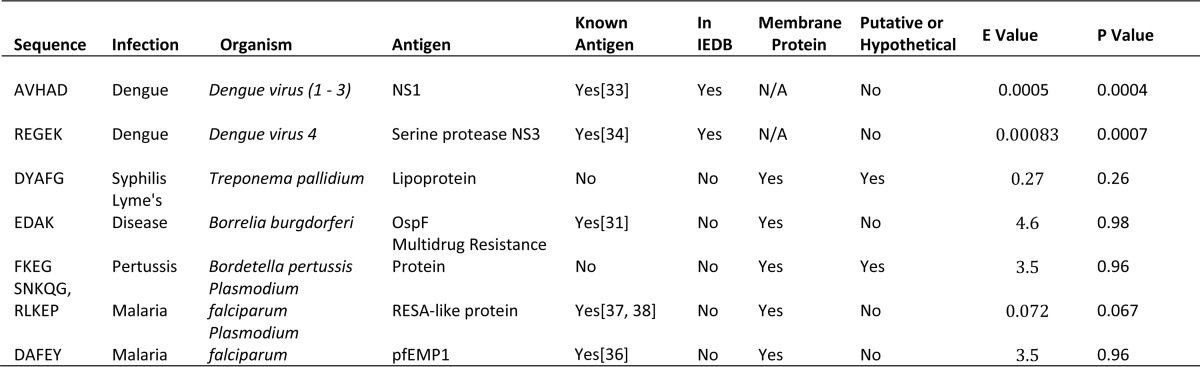
Discovered epitope sequences and their proposed antigen mappings. The two dengue epitopes were previously verified using peptide tiling of the NS1 and NS3 proteins against dengue sera. Another two (EDAK, DAFEY) map to known and characterized antigens in Borrelia burgdorferi and Plasmodium falciparum, respectively. The remainder displayed motif conservation consistent with epitopes but mapped to hypothetical proteins. “E-value” refers to the expected number of matches to the presumed epitope sequence(s) within the proteome of interest; “p value” refers to the chance of encountering at least one instance of the sequence within the proteome of interest. Not all proposed epitopes mapped to the proteome with significant p values, but they are reported here as a “best guess” to explain the high response to these sequences on the arrays.
Table IV. Sensitivity and specificity of epitope candidates.
| Sequence | Infection | Sensitivity | Specificity |
|---|---|---|---|
| AVHAD | Dengue | 1 | 1 |
| REGEK | Dengue | N/A | N/A |
| DYAFG | Syphilis | 1 | 1 |
| EDAK | Lyme disease | 0.125 | 1 |
| FKEG | Pertussis | 0.83 | 1 |
| SNKQG, RLKEP | Malaria | 0.69 | 1 |
| DAFEY | Malaria | 0.46 | 1 |
Sensitivity and specificity calculations for the top epitope candidates from Table III. The selection algorithm maximizes sensitivity and might not be a reliable estimate of performance. However, the candidates do map to antigenic proteins and are specific to the cohort of interest. Estimates for the REGEK sequence from dengue could not be computed, as this was discovered using a separate set of arrays or too few samples were processed.
Individual Epitope Determination in Patient Sera
In order to test the heterogeneity within disease groups, we asked which subsequences were differentially bound between individuals in disease cohorts and normal subjects. We found that epitope sequences revealed in the groupwise analysis were present in most of the individuals from that group. All nine dengue samples contained AVHAD as a significant subsequence. To visualize the extent of this overlap, we calculated the pairwise overlap of significant subsequences between individuals across disease groups (Fig. 4B). Recall that the feature selection process for the seed peptides requires that antibodies be commonly expressed within a disease cohort. Thus, the antibodies analyzed here displayed highly similar sequences across all individuals within a cohort. These sequences were equally unlikely to appear in other disease groups, also because of the feature selection requirements. However, it should be noted that peptides (features) common within a cohort demonstrated qualitatively greater fold-changes relative to Normals than those with less common sequences within a cohort.
Additional Library Complexity Reveals Additional Epitopes
This assay relies on many simultaneous measurements of antibody/peptide interactions. It is useful to know how changes in library content affect results. As only 27% of pentamers were represented on the original arrays, we hypothesized that a different random library would result in additional targets that were invisible to the original experiments because they were not present. To test this, we created another array with a different set of 330,000 sequences. We then attempted to find epitopes using a dengue-infected serum sample. This analysis revealed an additional epitope (REGEK, Dengue 4, E-value: 8.3 × 10⁻⁴) that was previously mapped in the Immune Epitope Database but not present on the original array (Fig. 5). This result suggests that larger arrays should reveal additional antibodies. This experiment did not address specificity, however, and might not be the final argument supporting larger peptide libraries. In order to properly address that question, the second 330,000-peptide library would have to be added to the first and 660,000 peptides would have to be exposed to the sera simultaneously.
Fig. 5.
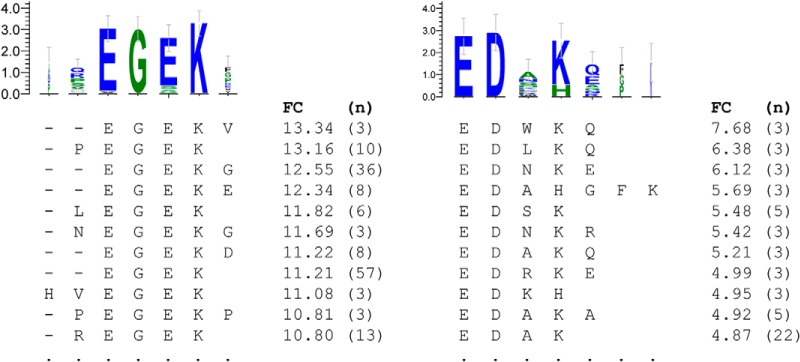
Motifs found in single patients. These motifs were associated with single patients within a disease cohort. The motif on the left was found in a single dengue patient and maps to NS3 (34). It is a mapped epitope and was observable on the random-sequence peptide microarrays. The motif on the right was present in a single Borrelia patient and maps to the OspF protein, known to be associated with an immune response in dogs (31). FC, fold change between the individual serum sample and a cohort of normal samples; n, number of peptides associated with that subsequence.
Mapping Epitope Information to a Database
Having demonstrated that peptide microarrays are capable of resolving epitopes, we wished to know whether these sequences could predict the eliciting protein from a database of pathogen protein sequences.
Resolving a pathogen in a database given a few short sequences depends on both the size of the database and the length of the consensus motif. We predict that when one is using pairs of randomly generated sequences of varying lengths, a pair of pentamers, if known exactly, or a pair of heptamers, if known within 80% identity, is sufficient for resolving a pathogen in the Pathogen Proteome Database (Fig. 6).
Deciphering Eliciting Pathogen Proteins
To improve sensitivity, we opted for a restrictive search, relying on exact or near-exact (80%) identity and matches in the same protein to multiple pentamer queries. Using significant subsequences from malaria subjects, we found three epitope candidates (SNKQG, RLKEP, SNKQG). Searching these candidates against the Pathogen Proteome Database (multiple strains of each pathogen) resulted in uniquely identified membrane proteins from P. falciparum matching all three query sequences with 80% identity (Fig. 7). Two of the query sequences matched with 100% identity to a RESA-like protein, a known antigen in Plasmodium infections. The probability of two randomly drawn pentamers matching to one or more proteins globally in this database of over 1 million sequences is <0.01.
Fig. 7.

Using significant subsequences to identify an eliciting pathogen. Sample specific significant subsequences from the malaria cohort were combined, aligned, and hierarchically clustered by single linkage. This revealed three distinct epitope candidates, indicated by red asterisks. These three sequences were queried against a database of 596 human pathogens for exact and 80% identity. Only one protein from P. falciparum out of all human pathogens contained both RLKEP and SNKQG. The probability of two array 5-mers hitting the same protein by chance is <0.001.
DISCUSSION
We first asked whether random-sequence peptide microarrays could resolve epitope sequences for well-characterized monoclonal antibodies. We chose eight different monoclonal antibodies with well-characterized reactivity to linear epitopes (Table I). The epitopes of five of the eight monoclonal antibodies were readily resolved. After verifying our method with monoclonal antibodies, we applied the technique to serum from eight different human cohorts: healthy local controls, pools of non-disease patients, Borrelia, Bordetella, hepatitis B virus, malaria, syphilis, and dengue. These samples were chosen to evaluate our ability to detect eptiopes across a broad range of pathogens. Epitopes consistent with five of the seven pathogens were identified. Given the ability to identify a pathogen, we asked whether we could identify proteins from these pathogen proteomes from a set of uncharacterized sera.
The monoclonal antibody experiments were designed to test whether 330,000 random-sequence peptides could correctly find a linear epitope. Peptide arrays are unique in that they provide binding information as well as non-binding information, giving an overall picture of antibody specificity. Five monoclonal antibodies (HA, DM1A, 4C1, Ab1, and FLAG) bound only peptides that were related to their targets. P53Ab1 essentially bound a single sequence (RHSVV), did not tolerate substitutions, and did not cross-react with other peptides to any appreciable extent. HA, 4C1, FLAG, and DM1A allowed substitutions in certain positions to varying degrees depending on the sample. P53Ab8 bound sequences similar to the epitope, but these were overshadowed by sequence-dissimilar distracters (Fig. 3A). Two antibodies (A10 and 2C11) bound nearly exclusively sequence-dissimilar peptides. These differences in apparent binding might reflect true variation in antibody cross-reactivity characteristics, or they could be a side effect of choosing peptides randomly. Further studies with additional antibodies are needed to determine the extent to which the arrays can predict antibody specificity. Given the importance of monoclonal antibodies in the therapeutic pipeline (28), a quick way to screen out undesirable cross-reactions on a simple, high-throughput platform is desirable.
In agreement with previous studies using dense peptide arrays (14, 15), monoclonal antibodies bound a variety of sequences, many of which had little or no relationship with the true epitope. This was the impetus for the subsequence approach, which was successful in filtering out these nonspecific sequences in five of the tested monoclonal antibodies (Fig. 1) and made the most significant binding motifs more apparent.
These motifs, despite being pentamer sequences with only three to five amino acids in common with the eliciting peptide, bound very strongly to their targets, often >20-fold over background (Fig. 2). This strong, specific binding suggests that epitopes require a limited number of unchangeable residues, a phenomenon also observed in previous studies (12, 13). There is likely an evolutionary optimization between simplicity (low number of binding residues) and specificity (the need to recognize a unique target). Given that the size of the sequence space increases exponentially with the number of residues, an antibody requires surprisingly few residues to maintain specificity to a target. Substitutions may allow recognition of future variants of a pathogen to which the host was once exposed.
Previously, we attempted epitope mapping on smaller arrays with 10,000 peptides, with modest success for monoclonal antibodies but no predictive power in the case of patient sera (8). These data show that this was most likely due to a too-sparse representation of peptide sequences, with only 0.5% of pentamers represented in triplicate. The arrays used in this study provided a much denser sampling of this space, with 27% of pentamers represented. This improved sampling corresponded to improved resolution of epitopes in patient sera.
Dengue samples in particular seemed to react strongly to a particular epitope on the NS1 protein, shared by many strains of the virus. Because this is shared among strains, this antibody likely is non-protective and serves to distract the immune system. This explains why this was seen in all patients tested when they were likely infected with different strains of the virus. Training on cohorts composed of patients infected by a single strain would enhance the ability to discern strain-specific epitopes.
The malaria cohort was expected to suffer from a lack of sensitivity due to the large proteome. However, commonly across the malaria cohort, multiple sequences (SNKQG, RLKEP) mapped to the RESA protein in P. falciparum. This protein is associated with the membrane of newly invaded erythrocytes (36, 37), is an important virulence factor that facilitates erythrocyte attachment to blood vessel epithelium, and presents a tempting target for the immune system. The P. falciparum proteome is so large that it would be almost impossible to map the eliciting protein from a single pentamer, but in this case two peptides mapped to the RESA protein, improving the likelihood of a true match. A further sequence (DAFEY) was found in six samples and mapped to a PfEMP1 protein, one of a family of variant antigens associated with infected erythrocytes and thought to be an important mechanism for immune system distraction and evasion (19). Expression of these proteins is dynamic so as to evade the host immune response, and it is likely that more antibodies against this family would be found in a larger study.
The syphilis and Bordetella cohorts also showed consensus sequences that mapped to proteins, but the annotations on these are less comprehensive, and it is unknown whether they are antigenic. They do appear to be surface-associated proteins, but they are hypothetical, and direct studies about their expression or function have not been reported in the literature.
Although many individuals within a cohort shared epitopes, heterogeneous responses were also observed. Two Borrelia samples bound the consensus sequence EDAK. Although this is too short to be conclusive or unique, it does map precisely to the OspF protein found in several strains of the bacterium. This is a known antigen (31), and the subsequence is found in a region between two trans-membrane sections of the protein, a feasible location for an epitope. In cases like these, although the assignment might not be definitive, it does allow reduction to likely candidates.
The presence of homogeneous epitopes within cohorts is promising, as these arrays were originally developed to monitor serum and predict the presence of a disease as part of a diagnostic platform, without the need for peptide sequence information. Previously we showed that this assay is capable of capturing a “signature” of the immune system, a precise measure of thousands of off-target binding events that, when taken together, create a predictive diagnosis (18, 20–23, 32). Although machine learning algorithms can accurately classify blinded serum samples into the correct disease category, until now we had not shown that any epitope information could be extracted from the signatures. The serum samples revealed patterns consistent with those seen in the predictive monoclonal samples, and they appear to map to antigenic proteins from the pathogen (Table III). In the case of the two dengue epitopes, validation that these sequences are indeed antibody targets has been offered by other groups (33, 34), but this has not been completed for the other sequences, and for now they should be considered putative rather than definitive candidates.
As previously mentioned, the arrays contained ∼27% of possible pentamers in triplicate. Given this modest representation, one would predict a success rate of approximately one in four when mapping epitopes. However, in both monoclonal and serum samples, success rates were much higher, with discernable epitopes revealed in over half of tested samples/cohorts. One likely explanation is that infected sera contain multiple antibodies, each with unique specificities. However, only a subset was “visible” given our feature selection criteria. We saw some evidence of this when we repeated the assay in dengue on a new array, which revealed an additional validated epitope in previously unrepresented space.
Identifying eliciting proteins using sequence information gleaned from the arrays with the current 330,000 peptides per array is challenging. These arrays contain a relatively limited amount of sequence information compared with what is available in genome or transcriptome annotation studies. A typical BLAST search of a pentamer against a database of human pathogens is likely to be dominated by spurious and insignificant results. The arrays tend to reveal only consensus motifs that are present on the array, not exact sequences. The array only provides ample coverage of sequence space up to five amino acids, limiting the lengths of epitopes that can be reasonably discovered. However, even with these limitations we have demonstrated that it is possible to identify likely antigenic proteins using combinatorial random-sequence peptide arrays. Interestingly, epitope candidate pentamers gleaned from the arrays were much more likely to match pathogenic protein sequences than randomly drawn array pentamers. This indicates that epitopes are actually much less diverse than random or even life-space sequences, supporting the idea that antigen space is intrinsically convergent (35). These data also suggest that some design principles should be applied when designing a “random” peptide library. Representing more unique pentamers with less redundancy would enable broader coverage without increasing the number of peptides, but in this case the peptides would no longer be random, and instead should be considered “of random origin.”
The techniques underlying this technology are highly amenable to high-throughput manufacturing. Given that we identified different epitopes by using two different libraries, it is likely that larger arrays would achieve the sensitivity required for a priori pathogen identification. The approach seems promising in that true epitopes were revealed along with several previously undiscovered linear sequence segments in antigenic proteins. Such an approach could help identify antigenic hot spots within proteins and immunodominant epitopes with high resolution using an assay that is significantly less costly in terms of time and labor than display techniques, facilitating high-throughput screening of serum and monoclonal antibodies.
The peptide microarrays in this study are available from www.peptidearraycore.com for independent studies.
Footnotes
Author contributions: J.R., S.A.J., and P.S. designed research; J.R. performed research; J.R. contributed new reagents or analytic tools; J.R. and P.S. analyzed data; J.R., S.A.J., and P.S. wrote the paper.
1 The abbreviation used is:
- RESA
- ring-infect erythrocyte surface antigen.
REFERENCES
- 1. Stafford P., Cichacz Z., Woodbury N. W., Johnston S. A. (2014) Immunosignature system for diagnosis of cancer. Proc. Natl. Acad. Sci. U.S.A. 111, E3072–E3080 [DOI] [PMC free article] [PubMed] [Google Scholar]
- 2. Ballew J. T., Murray J. A., Collin P., Mäki M., Kagnoff M. F., Kaukinen K., Daugherty P. S. (2013) Antibody biomarker discovery through in vitro directed evolution of consensus recognition epitopes. Proc. Natl. Acad. Sci. U.S.A. 110(48), 19330–5. 10.1073/pnas.1314792110 Epub 2013 Nov 12. [DOI] [PMC free article] [PubMed] [Google Scholar]
- 3. Fack F., Hügle-Dörr B., Song D., Queitsch I., Petersen G., Bautz E. K. (1997) Epitope mapping by phage display: random versus gene-fragment libraries. J. Immunol. Methods 206, 43–52 [DOI] [PubMed] [Google Scholar]
- 4. Reineke U. (2004) Antibody epitope mapping using arrays of synthetic peptides. In Antibody Engineering (Lo B. C., Ed), pp. 443–463, Humana Press; [DOI] [PubMed] [Google Scholar]
- 5. Zaki A. M., van Boheemen S., Bestebroer T. M., Osterhaus A. D. M. E., Fouchier R. A. M. (2012) Isolation of a novel coronavirus from a man with pneumonia in Saudi Arabia. N. Engl. J. Med. 367, 1814–1820 [DOI] [PubMed] [Google Scholar]
- 6. Paschke M. (2006) Phage display systems and their applications. Appl. Microbiol. Biotechnol. 70, 2–11 [DOI] [PubMed] [Google Scholar]
- 7. Wang L.-F., Yu M. (2004) Epitope identification and discovery using phage display libraries: applications in vaccine development and diagnostics. Curr. Drug Targets 5, 1–15 [DOI] [PubMed] [Google Scholar]
- 8. Yip Y. L., Ward R. L. (1999) Epitope discovery using monoclonal antibodies and phage peptide libraries. Comb. Chem. High Throughput Screen. 2, 125–138 [PubMed] [Google Scholar]
- 9. Krumpe L. R. H., Atkinson A. J., Smythers G. W., Kandel A., Schumacher K. M., McMahon J. B., Makowski L., Mori T. (2006) T7 lytic phage-displayed peptide libraries exhibit less sequence bias than M13 filamentous phage-displayed peptide libraries. Proteomics 6, 4210–4222 [DOI] [PubMed] [Google Scholar]
- 10. Luck K., Travé G. (2011) Phage display can select over-hydrophobic sequences that may impair prediction of natural domain–peptide interactions. Bioinformatics 27, 899–902 [DOI] [PubMed] [Google Scholar]
- 11. Rodi D. J., Soares A. S., Makowski L. (2002) Quantitative assessment of peptide sequence diversity in M13 combinatorial peptide phage display libraries. J. Mol. Biol. 322, 1039–1052 [DOI] [PubMed] [Google Scholar]
- 12. Buus S., Rockberg J., Forsström B., Nilsson P., Uhlen M., Schafer-Nielsen C. (2012) High-resolution mapping of linear antibody epitopes using ultra high-density peptide microarrays. Mol. Cell. Proteomics 11, 1790–1800 [DOI] [PMC free article] [PubMed] [Google Scholar]
- 13. Sivalingam G. N., Shepherd A. J. (2012) An analysis of B-cell epitope discontinuity. Mol. Immunol. 51, 304–309 [DOI] [PMC free article] [PubMed] [Google Scholar]
- 14. Forsström B., Axnäs B. B., Stengele K.-P., Bühler J., Albert T. J., Richmond T. A., Hu F. J., Nilsson P., Hudson E. P., Rockberg J., Uhlen M. (2014) Proteome-wide epitope mapping of antibodies using ultra-dense peptide arrays. Mol. Cell. Proteomics 13, 1585–1597 [DOI] [PMC free article] [PubMed] [Google Scholar]
- 15. Edfors F., Boström T., Forsström B., Zeiler M., Johansson H., Lundberg E., Hober S., Lehtiö J., Mann M., Uhlen M. (2014) Immunoproteomics using polyclonal antibodies and stable isotope–labeled affinity-purified recombinant proteins. Mol. Cell. Proteomics 13, 1611–1624 [DOI] [PMC free article] [PubMed] [Google Scholar]
- 16. Hansen L. B., Buus S., Schafer-Nielsen C. (2013) Identification and mapping of linear antibody epitopes in human serum albumin using high-density peptide arrays. PLoS One 8, e68902. [DOI] [PMC free article] [PubMed] [Google Scholar]
- 17. Reineke U., Sabat R. (2009) Antibody epitope mapping using SPOT™ peptide arrays. In Epitope Mapping Protocols (Schutkowski M., Reineke U., Eds), pp. 145–167, Humana Press [Google Scholar]
- 18. Sykes K. F., Legutki J. B., Stafford P. (2013) Immunosignaturing: a critical review. Trends Biotechnol. 31, 45–51 [DOI] [PubMed] [Google Scholar]
- 19. Stafford P., Halperin R., Legutki J. B., Magee D. M., Galgiani J., Johnston S. A. (2012) Physical characterization of the “immunosignaturing effect.” Mol. Cell. Proteomics 11(4), M111.011593. 10.1074/mcp.M111.011593 Epub 2012 Jan 18. [DOI] [PMC free article] [PubMed] [Google Scholar]
- 20. Hughes A., Cichacz Z., Scheck A. C., Coons S. W., Johnston S. A., Stafford P. (2012) Immunosignaturing can detect products from molecular markers in brain cancer. PLoS One 7, e40201. [DOI] [PMC free article] [PubMed] [Google Scholar]
- 21. Legutki J. B., Magee D. M., Stafford P., Johnston S. A. (2010) A general method for characterization of humoral immunity induced by a vaccine or infection. Vaccine 28, 4529–4537 [DOI] [PubMed] [Google Scholar]
- 22. Restrepo L., Stafford P., Johnston S. A. (2012) Feasibility of an early Alzheimer's disease immunosignature diagnostic test. J. Neuroimmunol. 254(1–2), 154–60. 10.1016/j.jneuroim.2012.09.014 Epub 2012 Oct 18. [DOI] [PubMed] [Google Scholar]
- 23. Restrepo L., Stafford P., Magee D. M., Johnston S. A. (2011) Application of immunosignatures to the assessment of Alzheimer's disease. Ann. Neurol. 5–18 70(2):286–95. 10.1002/ana.22405. [DOI] [PubMed] [Google Scholar]
- 24. Halperin R. F., Stafford P., Johnston S. A. (2011) Exploring antibody recognition of sequence space through random-sequence peptide microarrays. Mol. Cell. Proteomics 10, 10(3):M110.000786. 10.1074/mcp.M110.000786 Epub 2010 Nov 9. [DOI] [PMC free article] [PubMed] [Google Scholar]
- 25. Legutki J. B., Zhao Z.-G., Greving M., Woodbury N., Johnston S. A., Stafford P. (2014) Scalable high-density peptide arrays for comprehensive health monitoring. Nat. Commun. 5 5:4785. 10.1038/ncomms5785. [DOI] [PubMed] [Google Scholar]
- 26. Chaddock A. M., Mant A., Karnauchov I., Brink S., Herrmann R. G., Klösgen R., Robinson C. (1995) A new type of signal peptide: central role of a twin-arginine motif in transfer signals for the delta pH-dependent thylakoidal protein translocase. EMBO J. 14, 2715. [DOI] [PMC free article] [PubMed] [Google Scholar]
- 27. Bähler M., Rhoads A. (2002) Calmodulin signaling via the IQ motif. FEBS Lett. 513, 107–113 [DOI] [PubMed] [Google Scholar]
- 28. Reichert J. M., Valge-Archer V. E. (2007) Development trends for monoclonal antibody cancer therapeutics. Nat. Rev. Drug Discov. 6, 349–356 [DOI] [PubMed] [Google Scholar]
- 29. Navalkar K. A., Johnston S. A., Woodbury N., Galgiani J. N., Magee D. M., Chicacz Z., Stafford P. (2014) Application of immunosignatures for diagnosis of valley fever. Clin. Vaccine Immunol. 21, 1169–1177 [DOI] [PMC free article] [PubMed] [Google Scholar]
- 30. Williams S., Stafford P., Hoffman S. (2014) Diagnosis and early detection of CNS-SLE in MRL/lpr mice using peptide microarrays. BMC Immunol. 15, 23. [DOI] [PMC free article] [PubMed] [Google Scholar]
- 31. Wagner B., Freer H., Rollins A., Garcia-Tapia D., Erb H. N., Earnhart C., Marconi R., Meeus P. (2012) Antibodies to Borrelia burgdorferi OspA, OspC, OspF, and C6 antigens as markers for early and late infection in dogs. Clin. Vaccine Immunol. 19, 527–535 [DOI] [PMC free article] [PubMed] [Google Scholar]
- 32. Kukreja M., Johnston S. A., Stafford P. (2012) Immunosignaturing microarrays distinguish antibody profiles of related pancreatic diseases. Proteomics Bioinformatics S6 [Google Scholar]
- 33. Chen Y., Pan Y., Guo Y., Qiu L., Ding X., Che X. (2010) Comprehensive mapping of immunodominant and conserved serotype- and group-specific B-cell epitopes of nonstructural protein 1 from dengue virus type 1. Virology 398, 290–298 [DOI] [PubMed] [Google Scholar]
- 34. Garcia G. V. D., Del Angel R. M. (1997) Recognition of synthetic oligopeptides from nonstructural proteins NS1 and NS3 of dengue-4 virus by sera from dengue virus-infected children. Am. J. Trop. Med. Hyg. 56, 466–470 [DOI] [PubMed] [Google Scholar]
- 35. Campo D. S., Dimitrova Z., Yokosawa J., Hoang D., Perez N. O., Ramachandran S., Khudyakov Y. (2012) Hepatitis C virus antigenic convergence. Sci. Rep. 2 2:267. 10.1038/srep00267 Epub 2012 Feb 15. [DOI] [PMC free article] [PubMed] [Google Scholar]
- 36. Pasternak N. D., Dzikowski R. (2009) PfEMP1: an antigen that plays a key role in the pathogenicity and immune evasion of the malaria parasite Plasmodium falciparum. Int. J. Biochem. Cell Biol. 41, 1463–1466 [DOI] [PubMed] [Google Scholar]
- 37. Anders R. (1986) Multiple cross-reactivities amongst antigens of Plasmodium falciparum impair the development of protective immunity against malaria. Parasite Immunol. 8, 529–539 [DOI] [PubMed] [Google Scholar]
- 38. Gardner M. J., Hall N., Fung E., White O., Berriman M., Hyman R. W., Carlton J. M., Pain A., Nelson K. E., Bowman S., Paulsen I. T., James K., Eisen J. A., Rutherford K., Salzberg S. L., Craig A., Kyes S., Chan M.-S., Nene V., Shallom S. J., Suh B., Peterson J., Angiuoli S., Pertea M., Allen J., Selengut J., Haft D., Mather M. W., Vaidya A. B., Martin D. M. A., Fairlamb A. H., Fraunholz M. J., Roos D. S., Ralph S. A., McFadden G. I., Cummings L. M., Subramanian G. M., Mungall C., Venter J. C., Carucci D. J., Hoffman S. L., Newbold C., Davis R. W., Fraser C. M., Barrell B. (2002) Genome sequence of the human malaria parasite Plasmodium falciparum. Nature 419, 498–511 [DOI] [PMC free article] [PubMed] [Google Scholar]