

Abstract
How proteins are trafficked, folded, and assembled into functional units in the cell envelope of Gram-negative bacteria is of significant interest. A number of chaperones have been identified, however, the molecular roles of these chaperones are often enigmatic because it has been challenging to assign substrates. Recently we discovered a novel periplasmic chaperone, called YfgM, which associates with PpiD and the SecYEG translocon and operates in a network that contains Skp and SurA. The aim of the study presented here was to identify putative substrates of YfgM. We reasoned that substrates would be incorrectly folded or trafficked when YfgM was absent from the cell, and thus more prone to proteolysis (the loss-of-function rationale). We therefore used a comparative proteomic approach to identify cell envelope proteins that were lower in abundance in a strain lacking yfgM, and strains lacking yfgM together with either skp or surA. Sixteen putative substrates were identified. The list contained nine inner membrane proteins (CusS, EvgS, MalF, OsmC, TdcB, TdcC, WrbA, YfhB, and YtfH) and seven periplasmic proteins (HdeA, HdeB, AnsB, Ggt, MalE, YcgK, and YnjE), but it did not include any lipoproteins or outer membrane proteins. Significantly, AnsB (an asparaginase) and HdeB (a protein involved in the acid stress response), were lower in abundance in all three strains lacking yfgM. For both genes, we ruled out the possibility that they were transcriptionally down-regulated, so it is highly likely that the corresponding proteins are misfolded/mistargeted and turned-over in the absence of YfgM. For HdeB we validated this conclusion in a pulse-chase experiment. The identification of HdeB and other cell envelope proteins as potential substrates will be a valuable resource for follow-up experiments that aim to delineate molecular the function of YfgM.
Escherichia coli is surrounded by a cell envelope that consists of an inner and an outer membrane, separated by a periplasmic space containing a layer of peptidoglycan (1). The envelope is at the interface with the surrounding milieu and functions as a selective permeability barrier preventing the uptake of toxic molecules, like antibiotics. Proteins embedded in the envelope allow the uptake of essential nutrients and ions, protect the cell from the acidic environment of the stomach (2), and play a role in pathogenesis through host cell attachment and toxin secretion (3).
The majority of cell envelope proteins enter the envelope through the SecYEG translocon (4, 5), a transmembrane conduit that facilitates co-translational insertion of proteins into the inner membrane, and post-translational translocation of proteins to the periplasmic space (6–9). The translocated proteins are then passed onto periplasmic chaperones, such as folding catalysts and trafficking chaperones (reviewed in (10)). These proteins function in networks that are essential for protein biogenesis in the cell envelope; however, the molecular function of most remains enigmatic. This is largely because: (1) they often have overlapping functions; and (2) cell envelope stress responses compensate for their absence by up-regulating alternative chaperones, or proteases. Thus it is difficult to identify phenotypes or substrates when a periplasmic chaperone is absent from the cell.
Recently we identified a novel periplasmic chaperone, called YfgM, which is anchored in the inner membrane by an N-terminal transmembrane helix (11, 12) and associates with a peptidyl-prolyl-isomerase (PpiD) (11) and the SecYEG translocon (13). Phenotypic analyses of strains lacking yfgM suggested that its physiological role overlaps with the periplasmic chaperones SurA and Skp, and we therefore proposed that YfgM mediates the trafficking of proteins from the SecYEG translocon to the periplasm (13). In this study, we have used a comparative proteomic approach to identify potential substrates. Our hypothesis was that some substrates would be incorrectly trafficked or folded in strains lacking yfgM, and that their steady-state levels would be lower because they would be more prone to proteolysis.
EXPERIMENTAL PROCEDURES
Bacterial Strains and Culture Conditions
All strains and plasmids used in this study are listed in Table I. Cells were cultured at 37 °C in standard LB (Difco, Sparks, MD) with antibiotic supplements if needed. Deletion of chromosomal yfgM in BL21 was carried out by standard bacteriophage P1 transduction from E. coli MC4100 yfgM::kan. BL21 ΔyfgM was confirmed by diagnostic PCR. Plasmids were constructed using standard molecular techniques, or USER cloning (14). All plasmids were confirmed by sequencing (MWG).
Table I. Bacterial strains and plasmids.
| Relevant Characteristics | Reference or source | |
|---|---|---|
| Strains used for proteomics analysis | ||
| WT | MC4100 yfgM::kan + pSC-yfgM | (13) |
| ΔyfgM | MC4100 yfgM::kan + pSC | (13) |
| Δskp | MC4100 Δskp yfgM::kan + pSC-yfgM | (13) |
| ΔskpΔyfgM | MC4100 Δskp yfgM::kan + pSC | (13) |
| ΔsurA | MC4100 ΔsurA yfgM::kan + pSC-yfgM | (13) |
| ΔsurAΔyfgM | MC4100 ΔsurA yfgM::kan + pSC | (13) |
| Strains used for the acid-stress assay | ||
| WT | MC4100 yfgM::kan + pSC-yfgM | (13) |
| ΔyfgM | MC4100 yfgM::kan + pSC | (13) |
| Δskp | MC4100 Δskp yfgM::kan + pSC-yfgM | (13) |
| ΔskpΔyfgM | MC4100 Δskp yfgM::kan + pSC | (13) |
| ΔsurA | MC4100 ΔsurA yfgM::kan + pSC-yfgM | (13) |
| ΔsurAΔyfgM | MC4100 ΔsurA yfgM::kan + pSC | (13) |
| Strains used for the promoter activity reporter assay | ||
| WT | MC4100 | Our collection |
| ΔyfgM | MC4100 yfgM::kan | (13) |
| Strains used for the pulse-chase experiment | ||
| WT | BL21(DE3) | Invitrogen |
| ΔyfgM | BL21(DE3) yfgM::kan | This study |
| Plasmids | ||
| pSC-yfgM | yfgM + native promoter in pSC | (13) |
| pSC | Empty vector control | (13) |
| pET28amp | pET28a kanamycin replaced by ampicillin | This study |
| phdeB-HA | pET28amp C-term. HA-tagged hdeB | This study |
| pUA66-hdeAB-yhiD-gfpmut2 cm | Cm resistance hdeAB-yhiD reporter | This study |
| pUA66- hdeAB-yhiD-gfpmut2 kana | kana resistance hdeAB-yhiD reporter | Thermo Scientific |
| pUA66-fdnGHI-gfpmut2 cm | Cm resistance fdnGHI reporter | This study |
| pUA66-fdnGHI-gfpmut2 kana | kana resistance fdnGHI reporter | Thermo Scientific |
| pUA66-ansB-gfpmut2 cm | Cm resistance ansB reporter | This study |
| pUA66-ansB-gfpmut2 kana | kana resistance ansB reporter | Thermo Scientific |
| pUA66-cadA-gfpmut2 cm | Cm resistance cadA reporter | This study |
| pUA66-cadA-gfpmut2 kana | kana resistance cadA reporter | Thermo Scientific |
| pUA66-yjiML-gfpmut2 cm | Cm resistance yjiML reporter | This study |
| pUA66- yjiML -gfpmut2 kana | kana resistance yjiML reporter | Thermo Scientific |
| pUA66-tdcBCDEFG-gfpmut2 cm | Cm resistance tdcBCDEFG reporter | This study |
| pUA66- tdcBCDEFG –gfpmut2 kana | kana resistance tdcBCDEFG reporter | Thermo Scientific |
| pUA66-gntKU-gfpmut2 cm | Cm resistance gntKU reporter | This study |
| pUA66- gntKU –gfpmut2 kana | kana resistance gntKU reporter | Thermo Scientific |
Table II. Proteins lower in abundance in the ΔyfgM strains. Numbers indicate an average ratio of protein expression levels calculated over three biological replicates (p < 0.01). A full analysis of all proteomic data is available in supplementary Table S4.
| Log2 scale | Fold change | Log2 scale | Fold change | Log2 scale | Fold change | |
|---|---|---|---|---|---|---|
| Protein | ΔyfgM/WT | ΔskpΔyfgM/Δskp | ΔsurAΔyfgM/ΔsurA | |||
| AldB | −0.85 ± 0.06 | 0.56 ± 0.02 | ||||
| AmyA | −0.81 ± 0.08 | 0.57 ± 0.03 | ||||
| AnsB | −1.14 ± 0.06 | 0.46 ± 0.02 | −1.43 ± 0.25 | 0.37 ± 0.07 | −2.23 ± 0.21 | 0.21 ± 0.03 |
| AsnC | −0.59 ± 0.06 | 0.66 ± 0.03 | ||||
| AspA | −0.66 ± 0.07 | 0.63 ± 0.03 | ||||
| Bfr | −1.09 ± 0.10 | 0.47 ± 0.03 | ||||
| CadA | −3.27 ± 0.26 | 0.10 ± 0.02 | ||||
| Cfa | −0.71 ± 0.12 | 0.61 ± 0.05 | ||||
| CspI | −1.53 ± 0.24 | 0.35 ± 0.06 | ||||
| CysD | −1.10 ± 0.08 | 0.47 ± 0.03 | ||||
| DkgA | −0.58 ± 0.03 | 0.67 ± 0.01 | ||||
| DmsA | −0.98 ± 0.17 | 0.51 ± 0.06 | −1.76 ± 0.30 | 0.30 ± 0.06 | ||
| DmsB | −1.18 ± 0.05 | 0.44 ± 0.01 | ||||
| EvgS | −0.77 ± 0.13 | 0.59 ± 0.05 | ||||
| FbaB | −1.05 ± 0.13 | 0.48 ± 0.04 | ||||
| FdnG | −3.02 ± 0.38 | 0.12 ± 0.03 | ||||
| FrdA | −0.77 ± 0.09 | 0.58 ± 0.04 | −1.02 ± 0.17 | 0.49 ± 0.06 | ||
| FrdB | −1.32 ± 0.21 | 0.40 ± 0.06 | ||||
| FumB | −1.46 ± 0.10 | 0.36 ± 0.03 | ||||
| Ggt | −0.75 ± 0.08 | 0.59 ± 0.03 | ||||
| GrcA | −1.96 ± 0.25 | 0.26 ± 0.04 | −1.55 ± 0.24 | 0.34 ± 0.06 | −1.70 ± 0.25 | 0.31 ± 0.06 |
| GrxB | −0.87 ± 0.15 | 0.55 ± 0.06 | ||||
| HchA | −1.00 ± 0.15 | 0.50 ± 0.05 | ||||
| HdeB | −2.63 ± 0.33 | 0.16 ± 0.04 | −1.72 ± 0.20 | 0.30 ± 0.04 | −2.96 ± 0.38 | 0.13 ± 0.04 |
| HisC | −0.75 ± 0.07 | 0.60 ± 0.03 | ||||
| HisG | −0.81 ± 0.07 | 0.57 ± 0.03 | ||||
| HybE | −1.22 ± 0.08 | 0.43 ± 0.02 | ||||
| MalE | −0.62 ± 0.06 | 0.65 ± 0.02 | ||||
| MalF | −0.85 ± 0.10 | 0.56 ± 0.04 | ||||
| MalP | −0.65 ± 0.02 | 0.64 ± 0.01 | ||||
| MalQ | −0.69 ± 0.04 | 0.62 ± 0.02 | ||||
| MdtE | −2.34 ± 0.16 | 0.20 ± 0.02 | ||||
| MelA | −1.31 ± 0.20 | 0.40 ± 0.06 | ||||
| NarG | −2.83 ± 0.49 | 0.14 ± 0.05 | ||||
| NarH | −3.38 ± 0.40 | 0.10 ± 0.03 | ||||
| NirB | −2.74 ± 0.38 | 0.15 ± 0.04 | ||||
| NirD | −3.49 ± 0.44 | 0.09 ± 0.03 | ||||
| NrdD | −0.72 ± 0.04 | 0.61 ± 0.02 | ||||
| OsmC | −0.84 ± 0.11 | 0.56 ± 0.04 | ||||
| PflB | −0.90 ± 0.10 | 0.54 ± 0.04 | ||||
| PoxB | −0.91 ± 0.13 | 0.53 ± 0.05 | ||||
| Prr | −0.58 ± 0.10 | 0.67 ± 0.05 | ||||
| PyrI | −0.81 ± 0.05 | 0.57 ± 0.02 | ||||
| RnlA | −0.87 ± 0.14 | 0.55 ± 0.05 | ||||
| TalA | −1.00 ± 0.13 | 0.50 ± 0.04 | ||||
| TdcB | −3.21 ± 0.08 | 0.11 ± 0.01 | −1.96 ± 0.20 | 0.26 ± 0.04 | ||
| TdcC | −2.78 ± 0.28 | 0.15 ± 0.03 | ||||
| TdcD | −3.85 ± 0.25 | 0.07 ± 0.01 | ||||
| TdcE | −2.96 ± 0.23 | 0.13 ± 0.02 | ||||
| UspD | −073 ± 0.05 | 0.60 ± 0.02 | ||||
| WrbA | −0.97 ± 0.05 | 0.51 ± 0.02 | ||||
| YbeL | −0.63 ± 0.10 | 0.65 ± 0.04 | ||||
| YcgK | −0.77 ± 0.05 | 0.59 ± 0.02 | ||||
| YdjI | −0.84 ± 0.11 | 0.56 ± 0.04 | ||||
| YeaG | −0.61 ± 0.07 | 0.66 ± 0.03 | ||||
| YfhB | −1.46 ± 0.18 | 0.36 ± 0.04 | ||||
| YgaU | −0.69 ± 0.09 | 0.62 ± 0.04 | −0.61 ± 0.09 | 0.66 ± 0.04 | ||
| YgeY | −1.18 ± 0.20 | 0.44 ± 0.06 | ||||
| YgfK | −2.07 ± 0.35 | 0.24 ± 0.06 | ||||
| YjbJ | −0.99 ± 0.05 | 0.50 ± 0.02 | ||||
| YjiL | −0.95 ± 0.10 | 0.52 ± 0.04 | ||||
| YjiM | −2.33 ± 0.29 | 0.20 ± 0.04 | ||||
| YjjI | −1.04 ± 0.11 | 0.49 ± 0.04 | ||||
| YnjE | −0.67 ± 0.08 | 0.63 ± 0.04 | ||||
| YtfH | −1.96 ± 0.16 | 0.26 ± 0.03 | ||||
Table III. Proteins higher in abundance in the ΔyfgM strains. Numbers indicate an average ratio of protein expression levels calculated over three biological replicates (p < 0.01). A full analysis of all proteomic data is available in supplementary Table S4.
| Log2 scale | Fold change | Log2 scale | Fold change | Log2 scale | Fold change | |
|---|---|---|---|---|---|---|
| Protein | ΔyfgM/WT | ΔskpΔyfgM/Δskp | ΔsurAΔyfgM/ΔsurA | |||
| AceA | 0.92 ± 0.16 | 1.89 ± 0.20 | 0.83 ± 0.13 | 1.78 ± 0.16 | ||
| AriR | 2.06 ± 0.14 | 4.17 ± 0.42 | ||||
| DadA | 0.72 ± 0.12 | 1.65 ± 0.14 | ||||
| EntA | 0.64 ± 0.08 | 1.55 ± 0.09 | ||||
| EntC | 1.28 ± 0.21 | 2.43 ± 0.34 | ||||
| EntF | 0.72 ± 0.10 | 1.64 ± 0.11 | ||||
| FadD | 1.04 ± 0.10 | 2.06 ± 0.14 | ||||
| FadJ | 0.76 ± 0.07 | 1.70 ± 0.08 | ||||
| Gcd | 0.68 ± 0.02 | 1.60 ± 0.02 | ||||
| Gcl | 0.80 ± 0.11 | 1.74 ± 0.13 | ||||
| IbpA | 1.91 ± 0.10 | 3.77 ± 0.26 | ||||
| IbpB | 3.22 ± 0.13 | 9.31 ± 0.83 | ||||
| LeuA | 1.14 ± 0.17 | 2.20 ± 0.25 | ||||
| MglA | 0.63 ± 0.07 | 1.54 ± 0.07 | ||||
| Mqo | 0.97 ± 0.10 | 1.95 ± 0.13 | ||||
| NanA | 0.73 ± 0.05 | 1.66 ± 0.06 | ||||
| NanC | 1.67 ± 0.04 | 3.18 ± 0.08 | ||||
| NanE | 0.88 ± 0.12 | 1.84 ± 0.15 | ||||
| NrdE | 0.83 ± 0.14 | 1.77 ± 0.17 | ||||
| OmpF | 0.71 ± 0.05 | 1.63 ± 0.06 | ||||
| RpoS | 1.46 ± 0.24 | 2.76 ± 0.44 | ||||
| SdhC | 1.82 ± 0.17 | 3.53 ± 0.40 | ||||
| SucC | 0.67 ± 0.11 | 1.59 ± 0.12 | ||||
| YciT | 0.64 ± 0.11 | 1.56 ± 0.11 | ||||
Sample Preparation for Proteomics
Strains analyzed by proteomics are listed in Table I. The WT strain was an yfgM knockout strain that had been complemented with a low copy plasmid containing yfgM downstream of its native promoter (ΔyfgM + pSC-yfgM). The ΔyfgM was the same strain with an empty plasmid (ΔyfgM + pSC). A similar set-up was used for experiments in the Δskp and ΔsurA backgrounds. For example, the Δskp strain was a complemented double deletion (ΔskpΔyfgM + pSC-yfgM), and the ΔskpΔyfgM strain is the same strain with an empty plasmid (ΔskpΔyfgM + pSC). In all cases, the expression levels of YfgM were similar to an isogenic parent strain, MC4100 (13). All strains were grown in LB broth supplemented with 50 μg/ml kanamycin and 17 μg/ml chloramphenicol at 37 °C, shaking at 200 rpm to an optical density of OD600 nm ∼0.8. The cells were harvested by centrifugation 8000 × g for 10 min at 4 °C and the cell pellets were kept at −20 °C. Cellular pellets were resuspended in lysis buffer (8 m Urea in 50 mm triethyl ammonium bicarbonate, pH 8.5, one tablet of Complete mini EDTA-free mixture (Roche Applied Science, Madison, WI), one tablet of PhosSTOP phosphatase inhibitor mixture (Roche Applied Science) and 1 mm sodium orthovanadate in 10 ml of lysis buffer) and cells were then lysed by 10 rapid passages through a 23-gauge hypodermic syringe needle and by sonication on ice. After centrifugation (20,000 × g 30 min at 4 °C), the protein concentration was determined by Bradford assay (Pierce). Proteins were reduced with 2 mm DTT at 56 °C for 25 min, alkylated with 4 mm iodoacetamide at room temperature for 30 min in the dark and reduced again with 2 mm DTT at room temperature to prevent over-alkylation. A first enzymatic digestion step was performed in 8 m urea lysis buffer using Lys-C at 37 °C for 4 h (enzyme/substrate ratio 1:50). The sample was diluted four times with 50 mm triethyl ammonium bicarbonate, pH 8.5, and digested overnight at 37 °C with trypsin (enzyme/substrate ratio 1:50). Finally, the digestion was quenched with 5% (v/v) formic acid. The resulting peptides were chemically labeled using stable isotope dimethyl labeling as described before (15). The ΔyfgM lysate was labeled “Medium” (M) and the WT was labeled “Heavy” (H). The ΔskpΔyfgM lysate was labeled “Medium” (M) and the Δskp was labeled “Light” (L). The ΔsurAΔyfgM lysate was labeled “Medium” (M) and the ΔsurA was labeled “Light” (L). Next, an aliquot of each label was measured on a regular LC-MS/MS run, and samples were mixed 1:1 based on their peptide intensities. The procedure was repeated in three biological replica.
Strong Cation Exchange for Peptide Fractionation
The labeled peptides were reconstituted in 10% (v/v) formic acid prior to fractionation using strong cation exchange (SCX)1 as described previously (16) for the protein expression levels analysis. The SCX system consisted of an Agilent 1100 HPLC system (Agilent Technologies, Waldbronn, Germany) with two C18 Opti-Lynx (Optimized Technologies, Oregon City, OR) trapping cartridges and a polysulfoethyl A SCX column (PolyLC, Columbia, MD; 200 mm × 2.1 mm inner diameter, 5 μm, 200 Å). The peptides were dissolved in 10% (v/v) formic acid and loaded onto the trap columns at 100 μl/min and subsequently eluted onto the SCX column with 80% (v/v) acetonitrile (ACN; Biosolve, The Netherlands) and 0.05% formic acid. SCX buffer A was made of 5 mm KH2PO4 (Merck, Germany), 30% (v/v) ACN, and 0.05% (v/v) formic acid, pH 2.7; SCX buffer B consisted of 350 mm KCl (Merck, Germany), 5 mm KH2PO4, 30% (v/v) ACN, and 0.05% (v/v) formic acid, pH 2.7. The gradient was performed as follows: 0% B for 10 min, 0–85% B in 35 min, 85–100% B in 6 min and 100% B for 4 min. After injection of 200 μg of labeled lysate, a total of 45 fractions were collected, dried in a vacuum centrifuge, and stored at −80 °C.
Liquid Chromatography Tandem Mass Spectrometry (LC/MS/MS) Analysis
After reconstituting the SCX fractions in 10% (v/v) formic acid/5% (v/v) DMSO, peptides were analyzed on a Q-Exactive mass spectrometer connected to an Easy UHPLC system (both Thermo Fisher Scientific, Germany). The columns were made in-house from either Aqua™ C18 (5 μm, Phenomenex, Torrance, CA; 20 mm × 100 μm i.d.) for the trap column or Zorbax C18 (1.8 μm, Agilent; 38 cm × 50 μm i.d.) for the analytical column (17). Mobile phase buffers for LC separation consisted of 0.1% formic acid in water (solvent A) and 100% (v/v) ACN/0.1% (v/v) formic acid (solvent B). The peptides were eluted during a 3 h gradient and directly sprayed into the mass spectrometer. The flow rate was set at 100 nL/min, and the LC gradient was as follows: 7–30% solvent B within 151 min, 30–100% solvent B within 3 min, 100% solvent B for 2 min, and 23 min 7% solvent B. Nano spray was achieved using a distally gold-coated fused silica emitter (360 mm o.d.; 20 mm i.d.; 10 mm tip i.d.; constructed in-house) and an applied voltage of 1.7 kV. The Q-Exactive instrument was operated in the data-dependent acquisition mode and was configured to perform a Fourier transform survey scan from 350 to 1500 m/z (resolution 35,000) followed by higher collision energy dissociation fragmentation of the 20 most intense peaks (25% normalized collision energy at a target value of 50,000 ions, resolution 17,500). Quantification was based on unique peptides only.
Data Analysis
All MS data were processed with Proteome Discoverer (version 1.3, Thermo Scientific, Waltham, MA) using standard workflows. The generated peak list with Proteome Discoverer was searched using Mascot software (version 2.3 Matrix Science, U.K.) against Escherichia coli K12 MC4100 database downloaded from UniProt on March 6th, 2013 (4432 entries). The database search was performed with the following parameters: a mass tolerance of ±50 ppm for precursor masses; ±0.05 Da for MS/MS, allowing two missed cleavages, cysteine carbamidomethylation and methionine oxidation as fixed and variable modifications, respectively. The enzyme was specified as trypsin and the fragment ion type was specified as electrospray ionization ESI-QUAD-TOF for the mass spectra. A decoy search was enabled. The results were filtered for a 1% false discovery rate (FDR) at the PSMs level utilizing the percolator-based algorithm (18). In addition, only PSMs with Mascot score ≥20 were accepted and a minimum peptide length was set to six amino acids. Protein ratios were normalized by protein median, spectra were manually inspected, and the corresponding ratios modified accordingly. The mass spectrometry proteomics data have been deposited to the ProteomeXchange Consortium (http://www.proteomexchange.org) via the PRIDE partner repository (19) with the dataset identifier PXD000814. The numbers of distinct peptides assigned for each protein and the % coverage of each protein assigned (for each biological replica and for each pairwise comparison) are reported in supplemental Tables S1–S3. ProteomeXchange accession: PXD000814. Reviewer account: username: reviewer86698@ebi.ac.uk. Password: tCUA4s5B. To access the data please visit: http://tinyurl.com/nrpkjhp.
Statistics
To filter for those proteins that showed a consistent abundance level over three independent biological replica for each mutant, we applied a one-sample t test against 0 (no abundance change). Only those proteins that had a p value < 0.01 and an arbitrary fold change ≥ 1.5 or ≤ −1.5 were considered. If proteins could not be identified in the all three biological replica (e.g. YfgM was absent in all three biological replica of ΔyfgM but present in the WT), the missing quant values were replaced with minimum intensity and manually inspected. Moreover, only significant entries that have been identified with at least two unique peptides were considered.
Acid-stress Assay
Strains used for the acid-stress assay were the same as those used for proteomics analyses (Table I). Following an overnight culture, the strains were back-diluted 1:100 and grown for 5 h at 37 °C with shaking at 200 rpm in LB broth supplemented with kanamycin (50 μg/ml) and chloramphenicol (17 μg/ml). Cells were collected by centrifugation for 10 min at 4000 × g and resuspended in the same volume of LB with pH 2.0 (acid-stress) or pH 7.0 (control) and incubated for either 30 min (WT/ΔyfgM) or 25 min (Δskp/ΔskpΔyfgM and ΔsurA/ΔsurAΔyfgM) at 37 °C. Cells were collected by centrifugation for 10 min at 4000 × g and resuspended in the same volume of PBS, pH 7.4, to neutralize acid potentially remaining in the cell pellet. A volume equivalent to 0.2 OD600 was diluted in series of 1:10 and 5 μl were spotted onto LB agar supplemented with kanamycin (50 μg/ml) and chloramphenicol (17 μg/ml) to determine the number of colony-forming units (CFUs).
Promoter Activity Assay
In these assays a WT strain and a ΔyfgM strain were used (Table I). Reporter plasmids were obtained from the E. coli promoter collection (Thermo Scientific). To ensure compatibility with the strains the kanamycin resistance cassette was replaced with a chloramphenicol resistance cassette by USER cloning. Chemically competent host strains were transformed with the reporter plasmids and selected on LB agar supplemented with 17 μg/ml chloramphenicol and kanamycin (50 μg/ml) when required. Cells were grown to an optical density of approximately OD600 0.8 before they were harvested by centrifugation at 4000 × g for 10 min at 4 °C and resuspended in 200 μl buffer G (50 mm Tris-HCl, pH 8.0, 200 mm NaCl, and 15 mm EDTA). GFP fluorescence was measured (488 nm excitation – 512 nm emission) in a Spectramax GEMINI EM microplate reader (Molecular Devices, Sunnyvale, CA) and normalized by the corresponding OD600 value. All experiments were done as three biological replica.
Pulse-chase Experiments
In these assays a WT strain and a ΔyfgM strain were obtained in the BL21(DE3) background (Table I). Strains were transformed with plasmid encoded phdeB-HA and cultured in M9 minimal medium supplemented with 100 μg/ml thiamine, 0.2% (w/v) glucose, 1 mm MgSO4, 50 μm CaCl2, 2 mg/ml Complete Supplement Mixture amino acids minus methionine at 37 °C, and shaking until an OD600 of ∼0.6. The expression of hdeB-HA was induced by adding 0.5 mm IPTG for 5 min, and then proteins were labeled with 15 μCi/ml [35S]-methionine for 2 min. The labeling reaction was quenched, by adding 3 mm cold methionine. The reaction was stopped at indicated time points by precipitating all proteins in 10% (v/v) TCA. Immunoprecipitation was done as described previously (20), except that 1 μl of monoclonal HA11 antibody (Nordic BioSite, Sweden) was used to bind and precipitate HdeB-HA.
RESULTS
Comparative Proteomic Analyses of Strains Lacking yfgM
Initially we carried out a comparative proteomic analysis of an E. coli strain lacking yfgM (denoted ΔyfgM) and the same strain complemented with a plasmid-encoded copy of yfgM (denoted WT). Thus, the genetic backgrounds of both strains were identical and the only difference was the presence or absence of YfgM. The strains were grown to mid-log phase in LB, then proteins were extracted, digested with Lys-C/Trypsin and the peptides labeled using the dimethyl approach (15). The peptide pools were mixed in a 1:1 ratio, fractionated by SCX, and analyzed by LC/MS/MS (Fig. 1A). This approach enabled the identification and quantification of proteins in all compartments of the cell. In total, 2079 proteins were quantified in all three biological replica, out of which forty-three were significantly higher/lower in abundance with a fold change greater than 1.5 fold (p < 0.01). Furthermore three proteins were absent in the ΔyfgM strain compared with the WT (YfgM, YjhP, and GntK) (Fig. 1B). This interpretation of the data is conservative as we applied stringent cut-offs (p < 0.01 and a minimum number of identified unique peptides ≥2).
Fig. 1.

Comparative proteomic analyses of strains lacking yfgM. A, Workflow of the proteomic strategy used in this study. Differences in protein expression between B, ΔyfgM and WT, C, ΔskpΔyfgM and Δskp, and D, ΔsurAΔyfgM and ΔsurA are represented in Volcano plots. Proteins with a p value <0.01 and a fold change greater than 1.5 are labeled in green. Fold differences are displayed in Tables II and III. nUP indicates the number of proteins that were higher in abundance; nDOWN indicates the number of proteins that were lower in abundance. Tables summarizing the results of each proteomic experiment are displayed under the Volcano plot. A full analysis of the dataset can be found in supplemental Table S4.
Thirty-three proteins were either lower in abundance or absent in the ΔyfgM strain (Fig. 2A). Some of these could be grouped according to their biological function, for example proteins required for maltose metabolism (MalF, MalP, and MalQ) (21), anaerobic growth with dimethyl sulfoxide (DmsA and DmsB) (22), and survival during gastrointestinal stresses such as low pH and exposure to bile salts (TdcB, TdcC, TdcD, TdcE, Cfa, CadA, GrcA, and HdeB) (23, 24). Around a third of the proteins were localized to the cell envelope (as noted by (25, 26)) and could be potential substrates of YfgM. They were Ggt, EvgS, OsmC, MalF, TdcB, TdcC, YfhB, YtfH, AnsB, and HdeB. Thirteen proteins were higher in abundance, among them were the chaperones IbpA and IbpB, which are involved in disaggregation of misfolded/mistargeted proteins in the cytosol (27).
Fig. 2.

Summary of differentially expressed proteins in strains lacking YfgM. A, Venn diagram of proteins that were lower in abundance in three different experiments. B, Venn diagram of proteins that were higher in abundance in three different experiments. Fold differences are displayed in Tables II and III. Protein names that are underlined were not detected in strains lacking YfgM. Protein names marked in bold text are implicated in acid-stress, as indicated in (23, 24).
Since our previous work had suggested that the role of YfgM overlapped with SurA and Skp (13), it was possible that these periplasmic chaperones compensated for the loss of YfgM in the ΔyfgM strain. We therefore deleted yfgM in the Δskp and ΔsurA backgrounds and repeated the same proteomic workflow (Fig. 1C and D). In these experiments, we compared double knockout strains to their respective single knockout (ΔyfgMΔskp versus Δskp and ΔyfgMΔsurA versus ΔsurA), so that we could focus only on the consequences of deleting yfgM (the analyses of the single knockouts skp and surA have been reported previously (28, 29)).
In the ΔyfgMΔskp strain, two proteins were absent (YfgM and HdeA) and seventeen were lower in abundance (Fig. 2A). Again, the list included proteins involved in maltose metabolism (MalE) (21), survival during gastrointestinal stresses (HdeA, HdeB, GrcA, and TdcB) (23, 24) and growth under anaerobic conditions (FrdA and FrdB) (30). Six of the proteins that were lower in abundance in this experiment are localized in the envelope, thus they could be potential substrates for YfgM. They include HdeA, HdeB, AnsB, TdcB, MalE, and YnjE. Some of these (HdeA, MalE, and YnjE) had not previously been identified in the ΔyfgM single knockout strain versus WT, most likely because Skp can chaperone them if YfgM is absent.
In the ΔyfgMΔsurA strain five proteins were absent (YfgM, TdcA, CusS, XylG, and YnjE) and twenty-eight were lower in abundance (Fig. 2A). Two of these proteins are required for survival during gastrointestinal stresses (HchA and MtdE) (23, 24). Seven of the proteins are localized in the envelope, thus they could be potential substrates for YfgM. They include HdeB, AnsB, YnjE, CusS, YbeL, YcgK, and MtdE. Some of these (CusS, YbeL, YcgK, and MtdE) had not been identified previously in the pairwise comparison of ΔyfgM strain versus WT. We therefore speculate that SurA could chaperone these proteins if YfgM is absent.
A standout observation from the proteomic analysis was that twelve proteins required for survival during gastrointestinal stresses, such as low pH and exposure to bile salts, were missing or lower in abundance in the three strains lacking yfgM (marked in bold, Fig. 2A). The most obvious were HdeB and GrcA, as they were lower in abundance in all three experiments. HdeB is an acid-activated chaperone that keeps periplasmic chaperones soluble and folded upon acidic conditions (31). GrcA is an acid-induced, alternate pyruvate formate lyase subunit that is localized in the cytoplasm (32). Other acid-stress proteins that were missing or lower in abundance showed significant changes in only one of the three strain backgrounds. They included the periplasmic chaperone HdeA, the cytoplasmic chaperone HchA (or Hsp31), the lysine decarboxylase CadA, the cyclopropane fatty acyl phospholipid synthase Cfa, and TdcABCDE, which are required for transport and degradation of threonine (see 23, 24 for an overview of their roles in acid-stress).
Cells Lacking yfgM Are More Sensitive to Low pH
To determine whether the lower levels of proteins required for survival during gastrointestinal stresses had an influence on viability at low pH, we carried out a phenotypic assay where cells were incubated at pH 2.0 (acid-stress) or pH 7.0 (control) for 25–30 min and the number of viable cells was determined by plating on LB agar. All strains were equally viable following incubation at pH 7.0, however those lacking yfgM were less viable than the respective parent strain upon incubation at pH 2.0 (Fig. 3). Thus, the phenotypic assay confirmed the major observation of the proteomic analysis.
Fig. 3.
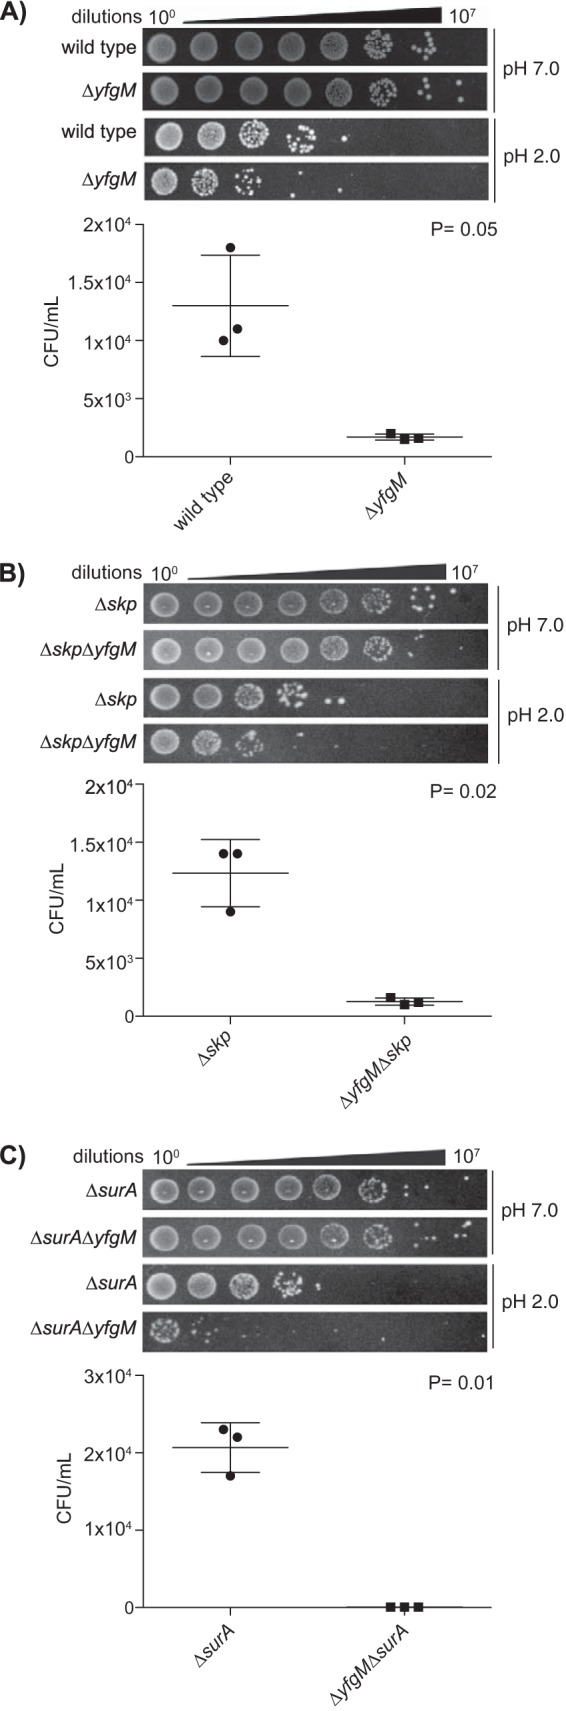
Strains devoid of YfgM show a decreased survival rate at low pH. A, WT and ΔyfgM strains were exposed to LB at pH 7.0 (upper panels) or pH 2.0 (lower panels) for 30 min and the survival rate was determined by counting the colony forming units (CFUs) on LB agar. The mean and S.E. were calculated from three biological replicas and summarized in the accompanying graph. Significance was assessed by a two-tailed Students t test assuming unequal variance. B, Δskp and ΔskpΔyfgM and C, ΔsurA and ΔsurAΔyfgM were assayed as in described above, except the incubation time in acid was decreased to 25 min to prevent complete lethality.
Potential Substrates of YfgM
The major goal of this study was to identify cell envelope proteins that were dependent on YfgM for biogenesis, as they would be potential substrates. Our hypothesis was that the synthesis of these proteins would not be affected, rather that they would be incorrectly trafficked or folded in the ΔyfgM strains, and therefore degraded more quickly. We collated a list of proteins that were: (1) localized to the cell envelope, and (2) lower in abundance in the ΔyfgM strains. This list included nine inner membrane proteins (CusS, EvgS, MalF, OsmC, TdcB, TdcC, WrbA, YfhB, and YtfH) and seven periplasmic proteins (HdeA, HdeB, AnsB, Ggt, MalE, YcgK, and YnjE), but it did not include any lipoproteins or outer membrane proteins. Although these putative substrates did not contain any obvious sequence similarities, it is anticipated that their trafficking into the envelope takes place through the SecYEG translocon, as we did not detect any known substrates of the Twin Arginine Translocation (TAT) system (33), or YidC (when independent of SecYEG) (34). This observation is consistent with the observation that YfgM operates at the SecYEG translocon (13).
For two of the inner membrane proteins (TdcB and TdcC) and three of the periplasmic proteins (HdeA, HdeB, and AnsB), we ruled out the possibility that their genes were transcriptionally down-regulated using a reporter plasmid that contained the promoter region adjacent to the sequence encoding for the green fluorescent protein. Thus, whole cell fluorescent readings could be used as a measure of the transcriptional activity of these genes/operons. In all cases, fluorescence readings from the reporter plasmid were comparable or higher relative to the WT (Fig. 4A). This observation suggests that lower levels of HdeA, HdeB, AnsB, TdcB, and TdcC in the ΔyfgM strain are caused by defects in protein stability rather than transcriptional regulation. We validated this conclusion for HdeB using a pulse-chase approach. In this experiment, plasmid encoded HdeB was genetically fused to a C-terminal HA-tag and radiolabeled with [35S]methionine for 2 mins. The reaction was quenched by the addition of an excess of methionine, then HdeB-HA was immunoprecipitated at various time points and analyzed by SDS-PAGE and autoradiography. The assay indicated that HdeB-HA was considerably less stable in the ΔyfgM strain (t1/2 ∼10 min) than in the WT strain (t1/2 ∼25 min) (Fig. 4B).
Fig. 4.
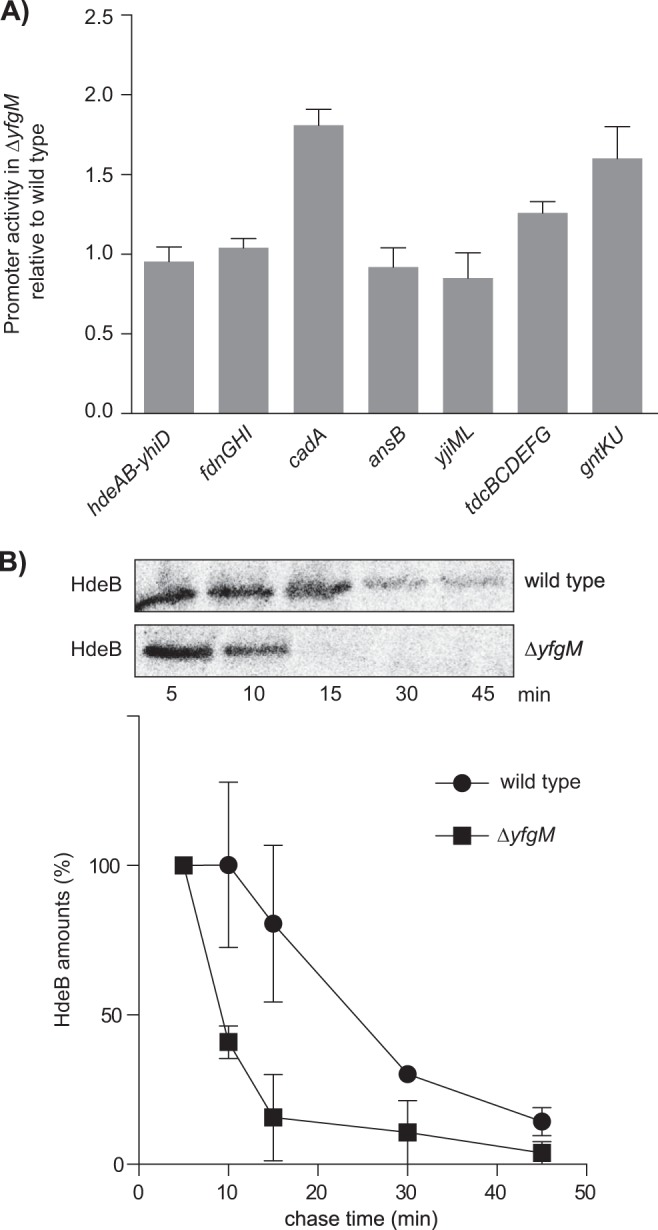
HdeB-HA shows decreased stability in a ΔyfgM strain. A, Transcriptional activity from selected promoter regions was monitored by fusing them to gfp. Whole cell fluorescence was determined in WT (MC4100) and ΔyfgM (MC4100 yfgM::kan) cells. The fluorescence was normalized to the OD600 nm and expressed as a ratio (ΔyfgM/ WT). All experiments were replicated three times and plotted as a mean with S.D. B, Plasmid encoded HdeB was fused to an HA-tag and was pulse-labeled for 2 min in WT [BL21(DE3)] or ΔyfgM strains [BL21(DE3) yfgM::kan]. The [35S]-methionine labeled HdeB-HA was chased for 45 min, then immunoprecipitated and analyzed by SDS-PAGE and autoradiography.
DISCUSSION
A key goal in the post genomics era is to understand the function(s) of all predicted proteins. The study presented here aimed to better understand the function of YfgM by identifying potential substrates. We reasoned that substrates would be lower in abundance because of misfolding/mistargeting and subsequent proteolysis in the absence of YfgM (the loss-of-function rationale), thus we used a comparative proteomic approach on a strain lacking yfgM. As YfgM is localized to the cell envelope (11), we reasoned that substrates would also be in this location. We identified ten cell envelope proteins that were lower in abundance and that could be potential substrates of YfgM. These proteins were Ggt, EvgS, OsmC, MalF, TdcB, TdcC, YfhB, YtfH, AnsB, and HdeB. We also observed a few proteins that were higher in abundance, such as the cytosolic chaperones, IbpA and IbpB. These chaperones are involved in the disaggregation of misfolded proteins (27), most likely the ones that fail to pass the inner membrane because of the loss of yfgM and accumulate in the cytosol. Interestingly, IbpA and IbpB are also higher in abundance in strains lacking proteins involved in translocation and targeting across the inner membrane (i.e. SecB, SecE, and YidC) (35–37).
One limitation of using the ΔyfgM strain is that, in the absence of YfgM, other periplamic chaperones could carry out its role. Previous work in our lab has shown that phenotypes identified in the Δskp and ΔsurA strains (i.e. compromised outer membrane integrity and activation of cell envelope stress responses) are exacerbated when yfgM is deleted (13). It is therefore possible that Skp and SurA compensate for the absence of YfgM and prevent the identification of some potential substrates. To identify these substrates we also compared the proteomes of a Δskp ΔyfgM and a ΔsurA ΔyfgM strain to the respective single deletions of Δskp or ΔsurA. Overall, the experiments would reveal: 1) potential substrates of YfgM, and 2) potential substrates that required YfgM that might have been chaperoned by either Skp or SurA in the previous experiment. Merging and analyzing the data from these experiments enabled us to identify six additional cell envelope proteins that are lower in abundance and therefore potential substrates (CusS, WrbA, HdeA, MalE, YcgK, and YnjE). Thus, in total we had identified sixteen potential substrates of YfgM. They were HdeA, HdeB, AnsB, MalE, MalF, TdcB, TdcC, CusS, Ggt, EvgS, OsmC, YfhB, YtfH, WrbA, YcgK, and YnjE.
Significantly, AnsB and HdeB, were lower in abundance in all three experiments where yfgM had been deleted (each of which was carried out in three biological replica). For both proteins, we ruled out the possibility that their genes were transcriptionally down-regulated, thus it is highly likely that these proteins are misfolded or mistargeted, and turned-over in the absence of YfgM. For HdeB we validated this conclusion in a pulse-chase experiment, which showed that HdeB was turned-over at a higher rate in a ΔyfgM strain. Three scenarios can be envisaged to explain the increased turn-over of HdeB: (1) YfgM is required for folding of HdeB as it leaves the SecYEG translocon and enters the periplasm; (2) YfgM mediates the transfer of HdeB to other periplasmic chaperones, or (3) YfgM stabilizes HdeB. The identification of HdeB and other cell envelope proteins as potential substrates will be a valuable resource for follow-up experiments that aim to delineate the molecular function of YfgM.
A growing body of evidence indicates that YfgM is linked to a periplasmic chaperone network, which includes HdeA, HdeB, SurA, Skp, DegP, and PpiD. This conclusion is partially based in the fact that YfgM interacts with PpiD and the SecYEG translocon (the guilt-by-association principle; Fig. 5A and 5B (11, 13)). It is also based on the observation that the role of YfgM partially overlaps with SurA and Skp (Fig. 5C; (13)). Furthermore, YfgM is required for the biogenesis of HdeB, and to some extent HdeA (Fig. 5D; this study). And finally, HdeA can refold acid-damaged SurA, DegP, and PpiD (Fig. 5E; (38)).
Fig. 5.
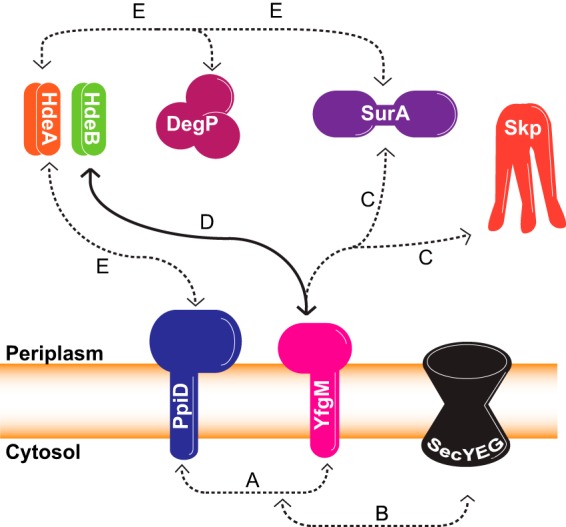
A growing body of evidence indicates that YfgM is linked to a periplasmic chaperone network. See text for details.
The data presented here also provide unexpected insight into the physiological consequences of deleting yfgM. In particular, we observed that a number of proteins that are required for adaptation to gastrointestinal stresses (TdcCDE) and acid-stress (HdeAB) are lower in abundance, and that cells lacking yfgM have reduced viability following acid-stress. HdeA and HdeB have been reported to play a direct role in the acid-stress response, as they ensure the survival of the bacterium during the transit through the acidic pH of the stomach, hence enabling the microbiotica to reach and colonize the intestine (2, 39). It seems unlikely that YfgM plays a direct role in this process, as it is not induced by acid-stress (40–43). Rather we believe that it has a more general role, chaperoning proteins as they enter the cell envelope through the SecYEG translocon.
Supplementary Material
Acknowledgments
We thank the PRIDE Team for technical support.
Footnotes
Author contributions: H.G., G.M., and D.O.D. designed research; H.G., C.M., and G.M. performed research; H.G., G.M., and D.O.D. analyzed data; H.G., G.M., and D.O.D. wrote the paper; A.M.A. and A.J.H. supervised the research.
* This work was supported by a grant from the Swedish Research Council (VR) to DOD. G.M. was awarded of an International postdoc grant from VR and a Blanceflor-Ludovici scholarship, Sweden. A.F.M.A. and A.J.R.H. were supported by the Netherlands Proteomics Center, embedded in The Netherlands Genomics Initiative, and the PRIME-XS Project, Grant Agreement 262067, funded by the European Union Seventh Framework Program. A.F.M.A. was supported by the Netherlands Organisation for Scientific Research (NWO) with a VIDI grant (723.012.102). This work has been supported by the PRIME-XS project, grant agreement number 262067, funded by the European Union 7th Framework Programme.
 This article contains supplemental Tables S1 to S4.
1 The abbreviations used are:
- SCX
- Strong Cation Exchange
- CFU
- Colony Forming Unit
- CSM
- Complete Supplement Mixture
- DMSO
- Dimethylsulfoxide
- DTT
- Dithiothreitol
- ESI
- Electro Spray Ionization
- FDR
- False discovery rate
- GFP
- Green Fluorescent Protein
- HA
- Hemaglutinin Antigen
- HPLC
- High Performance Liquid Chromatography
- LB
- Luria Bertani Medium
- LC-MS
- Liquid Chromatography–Mass Spectrometry
- PBS
- Phosphate Buffered Saline
- PCR
- Polymerase Chain Reaction
- QUAD
- Quadrupole
- SDS-PAGE
- Sodium Dodecyl Sulfate Polyacrylamide Gel Electrophoresis
- UHPLC
- Ultra High Performance Liquid Chromatography.
REFERENCES
- 1. Silhavy T. J., Kahne D., Walker S. (2010) The bacterial cell envelope. Cold Spring Harb. Perspect. Biol. 2, a000414. [DOI] [PMC free article] [PubMed] [Google Scholar]
- 2. Hong W., Wu Y. E., Fu X., Chang Z. (2012) Chaperone-dependent mechanisms for acid resistance in enteric bacteria. Trends Microbiol. 20, 328–335 [DOI] [PubMed] [Google Scholar]
- 3. Croxen M. A., Finlay B. B. (2010) Molecular mechanisms of Escherichia coli pathogenicity. Nat. Rev. Microbiol. 8, 26–38 [DOI] [PubMed] [Google Scholar]
- 4. Dalbey R. E., Kuhn A. (2012) Protein traffic in Gram-negative bacteria–how exported and secreted proteins find their way. FEMS Microbiol. Rev. 36, 1023–1045 [DOI] [PubMed] [Google Scholar]
- 5. Economou A. (2000) Bacterial protein translocase: a unique molecular machine with an army of substrates. FEBS Lett. 476, 18–21 [DOI] [PubMed] [Google Scholar]
- 6. Park E., Rapoport T. A. (2012) Mechanisms of Sec61/SecY-mediated protein translocation across membranes. Annu. Rev. Biophys. 41, 21–40 [DOI] [PubMed] [Google Scholar]
- 7. Rapoport T. A. (2007) Protein translocation across the eukaryotic endoplasmic reticulum and bacterial plasma membranes. Nature 450, 663–669 [DOI] [PubMed] [Google Scholar]
- 8. du Plessis D. J., Nouwen N., Driessen A. J. (2011) The Sec translocase. Biochim. Biophys. Acta 1808, 851–865 [DOI] [PubMed] [Google Scholar]
- 9. Lycklama A Nijeholt J. A., Driessen A. J. (2012) The bacterial Sec-translocase: Structure and mechanism. Philos. Trans. R. Soc. Lond. B. Biol. Sci. 367, 1016–1028 [DOI] [PMC free article] [PubMed] [Google Scholar]
- 10. Merdanovic M., Clausen T., Kaiser M., Huber R., Ehrmann M. (2011) Protein quality control in the bacterial periplasm. Annu. Rev. Microbiol. 65, 149–168 [DOI] [PubMed] [Google Scholar]
- 11. Maddalo G., Stenberg-Bruzell F., Gotzke H., Toddo S., Bjorkholm P., Eriksson H., Chovanec P., Genevaux P., Lehtio J., Ilag L. L., Daley D. O. (2011) Systematic analysis of native membrane protein complexes in Escherichia coli. J. Proteome Res. 10, 1848–1859 [DOI] [PubMed] [Google Scholar]
- 12. Toddo S., Soderstrom B., Palombo I., von Heijne G., Norholm M. H., Daley D. O. (2012) Application of split-green fluorescent protein for topology mapping membrane proteins in Escherichia coli. Protein Sci. 21, 1571–1576 [DOI] [PMC free article] [PubMed] [Google Scholar]
- 13. Gotzke H., Palombo I., Muheim C., Perrody E., Genevaux P., Kudva R., Muller M., Daley D. O. (2014) YfgM is an ancillary subunit of the SecYEG translocon in Escherichia coli. J. Biol. Chem. 289, 19089–19097 [DOI] [PMC free article] [PubMed] [Google Scholar]
- 14. Nour-Eldin H. H., Hansen B. G., Norholm M. H., Jensen J. K., Halkier B. A. (2006) Advancing uracil-excision based cloning towards an ideal technique for cloning PCR fragments. Nucleic Acids Res. 34, e122. [DOI] [PMC free article] [PubMed] [Google Scholar]
- 15. Boersema P. J., Raijmakers R., Lemeer S., Mohammed S., Heck A. J. (2009) Multiplex peptide stable isotope dimethyl labeling for quantitative proteomics. Nat. Protoc. 4, 484–494 [DOI] [PubMed] [Google Scholar]
- 16. Helbig A. O., Gauci S., Raijmakers R., van Breukelen B., Slijper M., Mohammed S., Heck A. J. (2010) Profiling of N-acetylated protein termini provides in-depth insights into the N-terminal nature of the proteome. Mol. Cell Proteomics 9, 928–939 [DOI] [PMC free article] [PubMed] [Google Scholar]
- 17. Cristobal A., Hennrich M. L., Giansanti P., Goerdayal S. S., Heck A. J., Mohammed S. (2012) In-house construction of a UHPLC system enabling the identification of over 4000 protein groups in a single analysis. Analyst 137, 3541–3548 [DOI] [PubMed] [Google Scholar]
- 18. Kall L., Canterbury J. D., Weston J., Noble W. S., MacCoss M. J. (2007) Semi-supervised learning for peptide identification from shotgun proteomics datasets. Nat. Methods 4, 923–925 [DOI] [PubMed] [Google Scholar]
- 19. Vizcaino J. A., Cote R. G., Csordas A., Dianes J. A., Fabregat A., Foster J. M., Griss J., Alpi E., Birim M., Contell J., O'Kelly G., Schoenegger A., Ovelleiro D., Perez-Riverol Y., Reisinger F., Rios D., Wang R., Hermjakob H. (2013) The PRoteomics IDEntifications (PRIDE) database and associated tools: Status in 2013. Nucleic Acids Res. 41, D1063–D1069 [DOI] [PMC free article] [PubMed] [Google Scholar]
- 20. Ojemalm K., Botelho S. C., Studle C., von Heijne G. (2013) Quantitative analysis of SecYEG-mediated insertion of transmembrane alpha-helices into the bacterial inner membrane. J. Mol. Biol. 425, 2813–2822 [DOI] [PubMed] [Google Scholar]
- 21. Fetsch E. E., Davidson A. L. (2003) Maltose transport through the inner membrane of E. coli. Front. Biosci. 8, d652–d660 [DOI] [PubMed] [Google Scholar]
- 22. Sambasivarao D., Turner R. J., Simala-Grant J. L., Shaw G., Hu J., Weiner J. H. (2000) Multiple roles for the twin arginine leader sequence of dimethyl sulfoxide reductase of Escherichia coli. J. Biol. Chem. 275, 22526–22531 [DOI] [PubMed] [Google Scholar]
- 23. Kanjee U., Houry W. A. (2013) Mechanisms of acid resistance in Escherichia coli. Annu. Rev. Microbiol. 67, 65–81 [DOI] [PubMed] [Google Scholar]
- 24. Hsieh P. F., Lin H. H., Lin T. L., Wang J. T. (2010) CadC regulates cad and tdc operons in response to gastrointestinal stresses and enhances intestinal colonization of Klebsiella pneumoniae. J. Infect. Dis. 202, 52–64 [DOI] [PubMed] [Google Scholar]
- 25. Bernsel A., Daley D. O. (2009) Exploring the inner membrane proteome of Escherichia coli: which proteins are eluding detection and why? Trends Microbiol. 17, 444–449 [DOI] [PubMed] [Google Scholar]
- 26. Weiner J. H., Li L. (2008) Proteome of the Escherichia coli envelope and technological challenges in membrane proteome analysis. Biochim. Biophys. Acta 1778, 1698–1713 [DOI] [PubMed] [Google Scholar]
- 27. Ratajczak E., Zietkiewicz S., Liberek K. (2009) Distinct activities of Escherichia coli small heat shock proteins IbpA and IbpB promote efficient protein disaggregation. J. Mol. Biol. 386, 178–189 [DOI] [PubMed] [Google Scholar]
- 28. Vertommen D., Ruiz N., Leverrier P., Silhavy T. J., Collet J. F. (2009) Characterization of the role of the Escherichia coli periplasmic chaperone SurA using differential proteomics. Proteomics 9, 2432–2443 [DOI] [PMC free article] [PubMed] [Google Scholar]
- 29. Denoncin K., Schwalm J., Vertommen D., Silhavy T. J., Collet J. F. (2012) Dissecting the Escherichia coli periplasmic chaperone network using differential proteomics. Proteomics 12, 1391–1401 [DOI] [PMC free article] [PubMed] [Google Scholar]
- 30. Iverson T. M., Luna-Chavez C., Cecchini G., Rees D. C. (1999) Structure of the Escherichia coli fumarate reductase respiratory complex. Science 284, 1961–1966 [DOI] [PubMed] [Google Scholar]
- 31. Kern R., Malki A., Abdallah J., Tagourti J., Richarme G. (2007) Escherichia coli HdeB is an acid stress chaperone. J. Bacteriol. 189, 603–610 [DOI] [PMC free article] [PubMed] [Google Scholar]
- 32. Wyborn N. R., Messenger S. L., Henderson R. A., Sawers G., Roberts R. E., Attwood M. M., Green J. (2002) Expression of the Escherichia coli yfiD gene responds to intracellular pH and reduces the accumulation of acidic metabolic end products. Microbiology 148, 1015–1026 [DOI] [PubMed] [Google Scholar]
- 33. Palmer T., Berks B. C. (2012) The twin-arginine translocation (tat) protein export pathway. Nat. Rev. Microbiol. 10, 483–496 [DOI] [PubMed] [Google Scholar]
- 34. Dalbey R. E., Kuhn A., Zhu L., Kiefer D. (2014) The membrane insertase YidC. Biochim. Biophys. Acta 1843, 1489–1496 [DOI] [PubMed] [Google Scholar]
- 35. Baars L., Ytterberg A. J., Drew D., Wagner S., Thilo C., van Wijk K. J., de Gier J. W. (2006) Defining the role of the Escherichia coli chaperone SecB using comparative proteomics. J. Biol. Chem. 281, 10024–10034 [DOI] [PubMed] [Google Scholar]
- 36. Price C. E., Otto A., Fusetti F., Becher D., Hecker M., Driessen A. J. (2010) Differential effect of YidC depletion on the membrane proteome of Escherichia coli under aerobic and anaerobic growth conditions. Proteomics 10, 3235–3247 [DOI] [PubMed] [Google Scholar]
- 37. Baars L., Wagner S., Wickstrom D., Klepsch M., Ytterberg A. J., van Wijk K. J., de Gier J. W. (2008) Effects of SecE depletion on the inner and outer membrane proteomes of Escherichia coli. J. Bacteriol. 190, 3505–3525 [DOI] [PMC free article] [PubMed] [Google Scholar]
- 38. Zhang M., Lin S., Song X., Liu J., Fu Y., Ge X., Fu X., Chang Z., Chen P. R. (2011) A genetically incorporated crosslinker reveals chaperone cooperation in acid resistance. Nat. Chem. Biol. 7, 671–677 [DOI] [PubMed] [Google Scholar]
- 39. Hingorani K. S., Gierasch L. M. (2013) How bacteria survive an acid trip. Proc. Natl. Acad. Sci. U.S.A. 110, 5279–5280 [DOI] [PMC free article] [PubMed] [Google Scholar]
- 40. Maurer L. M., Yohannes E., Bondurant S. S., Radmacher M., Slonczewski J. L. (2005) pH regulates genes for flagellar motility, catabolism, and oxidative stress in Escherichia coli K-12. J. Bacteriol. 187, 304–319 [DOI] [PMC free article] [PubMed] [Google Scholar]
- 41. House B., Kus J. V., Prayitno N., Mair R., Que L., Chingcuanco F., Gannon V., Cvitkovitch D. G., Barnett Foster D. (2009) Acid-stress-induced changes in enterohaemorrhagic Escherichia coli O157: H7 virulence. Microbiology 155, 2907–2918 [DOI] [PubMed] [Google Scholar]
- 42. Stincone A., Daudi N., Rahman A. S., Antczak P., Henderson I., Cole J., Johnson M. D., Lund P., Falciani F. (2011) A systems biology approach sheds new light on Escherichia coli acid resistance. Nucleic Acids Res. 39, 7512–7528 [DOI] [PMC free article] [PubMed] [Google Scholar]
- 43. Kannan G., Wilks J. C., Fitzgerald D. M., Jones B. D., Bondurant S. S., Slonczewski J. L. (2008) Rapid acid treatment of Escherichia coli: Transcriptomic response and recovery. BMC Microbiol. 8, 37–2180-8–37 [DOI] [PMC free article] [PubMed] [Google Scholar]
Associated Data
This section collects any data citations, data availability statements, or supplementary materials included in this article.