

Abstract
Protein redox regulation plays important roles in many biological processes. Protein cysteine thiols are sensitive to redox changes and may function as redox switches, which turn signaling and metabolic pathways on or off to ensure speedy responses to environmental stimuli or stresses. Here we report a novel integrative proteomics method called cysTMTRAQ that combines two types of isobaric tags, cysteine tandem mass tags and isobaric tag for relative and absolute quantification, in one experiment. The method not only enables simultaneous analysis of cysteine redox changes and total protein level changes, but also allows the determination of bona fide redox modified cysteines in proteins through the correction of protein turnover. Overlooking the factor of protein-level changes in the course of protein posttranslational modification experiments could lead to misleading results. The capability to analyze protein posttranslational modification dynamics and protein-level changes in one experiment will advance proteomic studies in many areas of biology and medicine.
Changes in the redox states of protein cysteine thiols serve as regulatory switches in diverse biological processes (1). The redox cycle is regulated by well-known factors such as the ferredoxin-thioredoxin and glutathione-glutaredoxin systems, which reduce oxidized cysteines. Other oxidoreductases and oxidants such as reactive oxygen species act primarily to oxidize cysteine thiol groups (2, 3). In order to map and quantify cysteine redox modifications on the proteome scale, several approaches and methods have been developed, mostly using thiol-specific reagents and isotope tags. Two-dimensional gel electrophoresis technology combined with fluorescent dye labeling (e.g. monobromobimane (4, 5) and cyanine dyes (6, 7)) and gel-free technology with isotope tagging (e.g. isotope-coded affinity tagging (6–8), cysTMT1 (9), and iTRAQ labeling of enriched cysteine-containing peptides (10–14)) are often used to identify potential redox-sensitive cysteine residues and quantify redox changes.
In addition to the well-known capabilities and limitations associated with two-dimensional gel electrophoresis–based and gel-free approaches (15), each method has its strengths and weaknesses in redox proteomics. For example, the two-dimensional gel electrophoresis methods allow the inspection of spot patterns related to redox and protein-level changes. However, spot-volume-based quantification becomes problematic, as each spot often contains more than one protein species from complex samples. In addition, the limited number of fluorescent reagents compromises multiplexing capability, and the use of cyanine dyes does not allow mapping of the modified cysteines (6, 7). Other thiol labeling approaches such as the use of N-ethylmaleimide, biotin-N-[6-(Biotinamido)hexyl]-3-(2-pyridyldithio) propionamide (16), and isotope-coded affinity tags allow specific enrichment of cysteine-containing peptides, mapping of cysteine modification sites, and duplex experiments in the case of isotope-coded affinity tags (6, 7). To enable multiplexing, 4- or 8-plex iTRAQ tags were recently used to label cysteine-containing peptides isolated from thiol-affinity chromatography (10, 11, 14, 16). Another multiplexing technology, cysTMT, was developed to specifically label cysteines with free thiol groups of proteins from six different samples (9). Although these multiplexing technologies have found utility, they do not address the issue of protein turnover in the course of experiments, and many researchers have overlooked this important factor that could lead to misleading results (8, 13, 14, 17). Only a small number of researchers have attempted to compare potential redox changes determined in proteomics experiments to total protein-level changes obtained from parallel or different studies (6, 7, 16). However, the success of this strategy is often low because many proteins quantified in redox experiments are either absent or not quantified with confidence in total proteomics experiments as a result of experimental variation and mass spectrometry stochastical sampling issues (18, 19).
To overcome this challenge, we have developed a double-labeling strategy that uses iTRAQ and cysTMT in one experiment for the simultaneous determination of quantifiable cysteine redox changes and protein-level changes. This new strategy, named cysTMTRAQ, utilizes each of the tags for their specific chemical properties. cysTMT tags (m/z 126, 127, 128, 129, 130, and 131 for six samples) were used to label protein thiols responsive to a treatment, and iTRAQ tags (m/z 114, 115, 116, 117, 119, and 121 for six samples) were used to label the N termini of peptides for analysis of protein-level changes during the experiments. By taking advantage of the different mass tags and their labeling specificities, one can quantify changes in protein redox and total levels in the same experiment. As protein redox regulation is a ubiquitous process (1, 2, 12), the utility of this new integrative cysTMTRAQ method is expected to greatly advance redox proteomic studies in many fields of biology and medicine, and thus benefit a broad range of scientists.
EXPERIMENTAL PROCEDURES
Sample Preparation
A six-protein mixture containing bovine serum albumin, α-lactabumin, β-galactosidase, lysozyme, apotransferrin, and β-lactoglobulin from the AB Sciex iTRAQ labeling kit (AB Sciex Inc., Foster City, CA) was used for optimization of the double-labeling procedure and oxidation experiments. Proteins were solubilized in a lysis buffer containing 6 m urea, 50 mm Tris, and 1 mm ethylenediaminetetraacetic acid, pH 7.5, reduced with 5 mm tris(2-carboxyethyl)phosphine for 1 h at room temperature. Oxidation treatment was performed with 1 mm H2O2 for 1 h at room temperature. Zeba columns (Thermo Scientific Inc.) were utilized after treatment to remove the reducing and oxidizing agents. Ellman's test for free thiols was performed to determine the free thiol concentration as described previously (20). Samples for optimization of the labeling procedure were prepared in 10-μg, 20-μg, and 40-μg replicates in order to examine 1:2:4 fold change ratios. Two independent replicates of each concentration were prepared. Samples for the identification of redox proteins and cysteines were prepared at a fixed amount of 20 μg and included reduced, four ratios of combined oxidized and reduced (1:1, 1:2, 1:4, and 1:8), and oxidized samples. Culture of Escherichia coli (F− 80lacZΔM15 Δ(lacZYA-argF) U169 recA1 endA1 hsdR17 (rk−, mk+) phoA supE44 λ− thi−1 gyrA96 relA1) was grown aerobically in LB medium to an A600 of 0.4 at 37 °C and treated with 500 μm NaOCl for 1 h. Protein extraction was conducted as previously described (21).
cysTMT and iTRAQ Labeling
Direct and reverse labeling of thiols were performed as suggested by the manufacturer (Thermo Scientific Inc., Bremen, Germany) and Parker et al. (22), respectively. Protein samples used for optimization of the labeling procedure were directly labeled after treatment with tris(2-carboxyethyl)phosphine and Zeba column clean-up. We labeled samples with a 1× fold change with 126 m/z and 127 m/z, those with a 2× fold change with 128 m/z and 129 m/z, and those with a 4× fold change with 130 m/z and 131 m/z. Reverse labeling was performed for the redox experiments. The reduced and oxidized samples underwent alkylation with 10 mm 2-iodoacetamide for 1 h at 37 °C. Reduced thiols for reverse labeling were produced through treatment with 5 mm tris(2-carboxyethyl)phosphine for 1 h at room temperature. A quick clean-up with a Zeba column was performed for both samples before cysTMT labeling. Samples were combined in ratios of oxidized to reduced sample, increasing the amount of reduced sample with each ratio while maintaining a constant total amount of protein. Ratios included 1:1 (127 m/z), 1:2 (128 m/z), 1:4 (129 m/z), and 1:8 (130 m/z). Fully reduced and oxidized samples were labeled with 126 m/z and 131 m/z, respectively. For each labeling method, a 3-fold excess of cysTMT tag to calculated free thiols was used, and labeling was performed at room temperature for 2 h. A 1:10-fold trypsin (Promega, Madison, WI) digestion was performed according to the iTRAQ manual (AB Sciex Inc.) at 37 °C for 12 h (9). Peptides were subsequently cleaned up with C18 desalting columns (The Nest Group Inc., Southborough, MA) and then lyophilized to dryness.
For iTRAQ labeling, lyophilized samples were resuspended in 0.5 m triethylammonium bicarbonate. Samples were labeled according to the manufacturer's manual (AB Sciex Inc.), and a final concentration of 70% isopropanol was used for all the iTRAQ tags. After labeling, the samples were quenched with H2O, combined, and lyophilized. Samples for optimization of the double-labeling procedure underwent direct labeling with 114 m/z and 115 m/z to examine a 1× fold change, 116 m/z and 117 m/z for a 2× fold change, and 119 m/z and 121 m/z for a 4× fold change. Samples for the redox experiment, the reduced sample, 1:1, 1:2, 1:4, 1:8, and oxidized sample were labeled with 114 m/z, 115 m/z, 116 m/z, 117 m/z, 119 m/z, and 121 m/z. For the E. coli samples, three control biological replicates were labeled with cysTMT tags (126 m/z, 128 m/z, and 130 m/z) and then with iTRAQ tags (113 m/z, 117 m/z, and 119 m/z). The three NaOCl-treated biological replicates were labeled with cysTMT tags (127 m/z, 129 m/z, and 131 m/z) and then with iTRAQ tags (114 m/z, 116 m/z, and 121 m/z).
Strong Cation Exchange and LC-MS/MS
Peptides were dissolved in strong cation exchange solvent A (25% (v/v) acetonitrile, 10 mm ammonium formate, and 0.1% (v/v) formic acid, pH 2.8) and fractionated using an Agilent HPLC 1260 system with a polysulfoethyl A column (2.1 × 100 mm, 5 μm, 300 Å). Peptides were eluted with a linear gradient of 0% to 20% solvent B (25% (v/v) acetonitrile and 500 mm ammonium formate, pH 6.8) over 50 min followed by ramping up to 100% solvent B in 5 min. Six fractions were collected by monitoring the absorbance at 280 nm. The fractions were lyophilized and dissolved in 10 μl of loading solvent (3% v/v acetonitrile, 0.1% v/v acetic acid) and loaded onto a C18 PepMap nanoflow column (75-μm internal diameter, 3 μm, 100 Å, Dionex Inc., Bannockburn, IL). The elution gradient started at 97% solvent A (0.1% v/v acetic acid, 3% v/v acetonitrile)/3% solvent B (0.1% v/v acetic acid, 96.9% v/v acetonitrile) and finished at 40% solvent A/60% solvent B within 90 min. After each run, the column was washed with 90% solvent B and re-equilibrated with solvent A. MS/MS analysis was carried out on an LTQ Orbitrap XL mass spectrometer in a positive mode applying data-dependent MS scanning and MS/MS acquisition (Thermo Scientific, Bremen, Germany). Survey full-scan MS spectra (m/z 400–1800) were acquired in the Orbitrap with resolution r = 60,000 at m/z 400. Data-dependent analysis of the 10 most intense ions with detection in MS/MS for acquiring HCD was set at 7500 at 400 m/z resolution with a 30,000 signal threshold, 5-ms activation time at 35 normalized collision energy, and dynamic exclusion enabled for 30 s with a repeat count of 1. Typical mass spectrometric conditions include a spray voltage of 2.2 kV, no sheath and auxiliary gas flow, a heated capillary temperature of 200 °C, a capillary voltage of 44 V, a tube lens voltage of 165 V, and an ion isolation width of 1.0 m/z. The mass spectrometer calibration was performed according to the manufacturer's guidelines using a mixture of SDS, sodium taurocholate, the MRFA peptide, and Ultramark.
Database Searching and Data Analysis
Proteome Discoverer 1.4 with the SEQUEST algorithm (Thermo Scientific Inc., Bremen, Germany) was used to search a database composed of sequences of the six-protein mixture (AB Sciex Inc.) in the background of an IPI Homo sapiens sequence database (downloaded on July 12, 2012; 91,464 entries) for the six-protein samples and a bacterial database from NCBI (downloaded on April 3, 2013; 14,961,948 entries) for the E. coli samples. Proteome Discoverer nodes for spectrum grouper and spectrum selector were set to default with the spectrum properties filter set to a minimum and maximum precursor mass of 300 Da and 5 kDa, respectively. The SEQUEST algorithm was used for protein identification. Parameters were set to two maximum missed cleavage sites of trypsin digestion, absolute XCorr threshold of 0.4, and fragment ion cutoff percentage at 0.1. Tolerances were set to a 10-ppm precursor mass tolerance and a 0.01-Da fragment mass tolerance. Dynamic modifications included phosphorylation (+79.966 (S,T,Y)), oxidation (+15.995 Da (M)), carbamidomethyl (+57.021 Da (C)), iTRAQ8plex (+304.205 Da (K), and cysTMT6plex (+304.177 Da (C)). The N-terminal modification was set for iTRAQ8plex (+304.205 Da). Percolator was used for protein identification with parameters of a strict target false discovery rate of 0.01 and a relaxed target false discovery rate of 0.05. The reporter ion quantifier node was set with a peak integration tolerance of 20 ppm, and the event detector used mass precision set at 2 ppm with a signal-to-noise ratio threshold of 3. Quantification was performed for both cysTMT and iTRAQ reporter ion peak intensities. Peptide results were filtered to include only peptides with false discovery rate confidence and cysteine residues.
After peptide and protein identification, cysTMT and iTRAQ datasets were analyzed, and fold changes were compared among the respective reporter ions. The reporter ion peak intensities of identical peptides were summed, and those values were log2 transformed. Outliers were removed as described previously (23). Ratios generated during the optimization experiment were set relative to 1×, and means were normalized to their respective replicates (24). Ratios generated during the application of redox treatment were set relative to 1:1, and background peak intensity values generated for the reduced sample were subtracted from all sample peak intensities. Means were also normalized to their respective replicates (24). For protein quantification, at least three unique peptides were required. Protein quantification was performed by summing the reporter ion peak intensities of all corresponding peptides (25), and ratios were generated as described above. To analyze the data from biological samples, we calculated the ratios accordingly from the median normalized peak intensity values, as reported above. Student's t test (two-tail) on the log2-transformed treated/control ratio was performed, and the p values were further corrected via the q-value false discovery rate method (26). A peptide with a q-value less than 0.05 and a fold change greater than 1.2 or less than 0.8 was considered statistically significant. The significant peptides labeled with cysTMT were confronted with the significant proteins quantified via iTRAQ. Student's t test was conducted between the fold change of cysTMT-labeled peptides and the fold change of the corresponding proteins quantified via iTRAQ. A correction factor was applied to the fold change of cysTMT-labeled peptides, taking into account the fold change of the protein quantified via iTRAQ (supplemental Fig. S1).
The list of all peptides and proteins identified can be found in the supplemental material (supplemental Tables S2, S3, and S4).
RESULTS
Optimization of CysTMT and iTRAQ Double-labeling CysTMTRAQ Procedures
To test the feasibility of double-labeling of peptides derived from a six-protein mixture with cysTMT and iTRAQ tags, a direct labeling method was implemented, and the amounts of different samples were controlled in order to observe the experimental fold changes between samples (supplemental Fig. S2). Proteins were aliquoted into six samples, two at 10 μg, two at 20 μg, and two at 40 μg. After reduction, the cysTMT tags were used to label the six samples. The samples then underwent trypsin digestion and iTRAQ labeling followed by mixing to create theoretical fold changes of 1:1:2:2:4:4. Reporter ion ratios were exported from Proteome Discoverer, and tagging efficiency was determined by examining the deviation of the median values of the reporter ion ratios from the expected values for both peptides and proteins. Using 1×, 2×, and 4× fold changes to examine the double-labeling efficiency, we found that cysteine-containing peptides labeled with cysTMT followed the expected fold changes (Fig. 1A, supplemental Fig. S3). Peptides with amine-labeling iTRAQ tags also showed the expected fold changes (Fig. 1A, supplemental Fig. S3). The greater variability observed in the iTRAQ quantification relative to the cysTMT quantification might be due to the difference in the number of peptides analyzed. When only the cysteine-containing peptides were analyzed, the variations in both cysTMT and iTRAQ quantification were similar, (supplemental Fig. S4). Interestingly, the peptide-level quantification can be extended to the protein level (i.e. the protein-level changes also followed the expected ratios) (supplemental Fig. S5). MS/MS spectral analysis of cysteine peptides revealed that the fold changes of iTRAQ tags in the low-mass region were similar to the fold changes of cysTMT tags (Fig. 1B), suggesting both iTRAQ and cysTMT tags labeled the peptides at different functional groups with the same efficiency. Correlation analysis of the iTRAQ quantitative data and the cysTMT quantitative data showed that the two datasets were highly correlated (R2 = 0.94) (Fig. 1C). These results demonstrate that double-labeling of peptides is feasible using the different isobaric tags (iTRAQ and cysTMT). The expected fold changes of the samples can be determined at both peptide and protein levels.
Fig. 1.

cysTMTRAQ labeling feasibility and performance. A, box plots showing the measured (box and whiskers) and expected values (dashed red lines 0, 1, and 2) of peptide ratios obtained using both cysTMT and iTRAQ quantification. B, a representative MS/MS spectrum of peptide MPCTEDYLSLILNR showing 1:1:2:2:4:4 fold changes with iTRAQ tags (m/z 114, 115, 116, 117, 119, and 121) and cysTMT tags (m/z 126, 127, 128, 129, 130, and 131). C, high correlation between cysTMT and iTRAQ quantification showing no bias in the double-labeling cysTMTRAQ method (R2 = 0.94).
Establishment of CysTMTRAQ in Identification of Redox Proteins and Cysteines
To implement the double-labeling method in a redox experiment, two sets of proteins were reduced and oxidized respectively, and then combined in different ratios while maintaining a constant total protein amount in each sample (supplemental Fig. S6). An indirect labeling procedure was used in which the six protein mixtures underwent thiol alkylation, reduction of oxidized thiols, and subsequent labeling with the thiol-specific cysTMT tags and amine-labeling iTRAQ tags (supplemental Fig. S6). CysTMT ratios of the treated samples reflected the relative amounts of oxidized proteins in the samples, and the experimental ratios turned out to fit the expected values for all the samples (Fig. 2A, supplemental Fig. S7A). Analysis of iTRAQ tags revealed that the peptide amounts did not change among the samples (Fig. 2B, supplemental Fig. S7B), and the results at the protein level were consistent with those at the peptide level (supplemental Fig. S8). Spectral analysis showed a similar trend in cysTMT and iTRAQ labeling of cysteine-containing peptides (Fig. 2C), and no change in iTRAQ labeling in non-cysteine-containing peptides (Fig. 2D). These results clearly demonstrate that the double isobaric tag labeling procedure allows one to examine cysteine redox changes while monitoring protein level changes, if any.
Fig. 2.
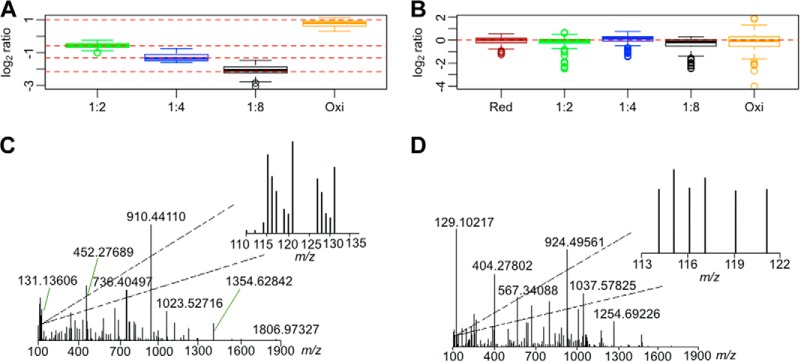
Identification and quantification of cysteine redox changes and protein-level changes using cysTMTRAQ. Box plot showing the measured (box and whiskers) and expected values (dashed red lines −0.58, −1.32, −2.17, and 1) of cysteine peptide ratios obtained with cysTMT tags (A) and non-cysteine-containing peptide levels obtained with iTRAQ tags (expected value of 0) (B) in samples ranging from oxidized to reduced at ratios of 1:2, 1:4, and 1:8. C, a representative MS/MS spectrum of cysteine-containing peptide FLDDDLTDDIMCVK showing cysteine redox changes with iTRAQ tags (m/z 114, 115, 116, 117, 119, and 121) and cysTMT tags (m/z 126, 127, 128, 129, 130, and 131). D, a representative MS/MS spectrum of non-cysteine-containing peptide VYVEELKPTPEGDLEILLQK showing no significant protein-level changes with iTRAQ tags (m/z 114, 115, 116, 117, 119, and 121).
Application of cysTMTRAQ in Redox Proteomics of E. coli Cells under Oxidative Stress
We further tested the application of cysTMTRAQ in redox proteomics of complex samples. To expose the cells to oxidative stress, we treated exponentially growing E. coli cells with 500 μm NaOCl for 1 h to induce both cellular redox and protein-level changes (supplemental Fig. S9). Cell culture was harvested directly into ice-cold 100% (w/v) TCA. This “acid trap” step is extremely important because the addition of TCA not only lyses the cells but also protonates all thiolates, which significantly slows thiol-disulfite exchange reactions (27). In total, we identified 912 cysteine-containing peptides, and 96.5% of them had both iTRAQ and cysTMT labels. Out of the 912 cysteine-containing peptides, 33 were significantly redox-regulated, showing a q-value of ≤0.05 and either a ≥1.2-fold increase or a ≤0.8-fold decrease (supplemental Table S1). Among the redox-regulated proteins, 10 (e.g. outer membrane protein A, glycerol-3-phosphate dehydrogenase, and malate dehydrogenase) were previously reported to have redox-sensitive cysteines (supplemental Table S1). When the protein-level change was taken into account, 5 of the 33 peptides containing redox-sensitive cysteines also showed significant protein-amount changes (Fig. 3A). Colicin receptor I and fructose-bisphosphate aldolase were assigned as redox regulated when only cysTMT quantification was analyzed. However, when the protein-turnover correction was applied (based on iTRAQ quantification), these proteins did not show significant redox regulation (Fig. 3B).
Fig. 3.
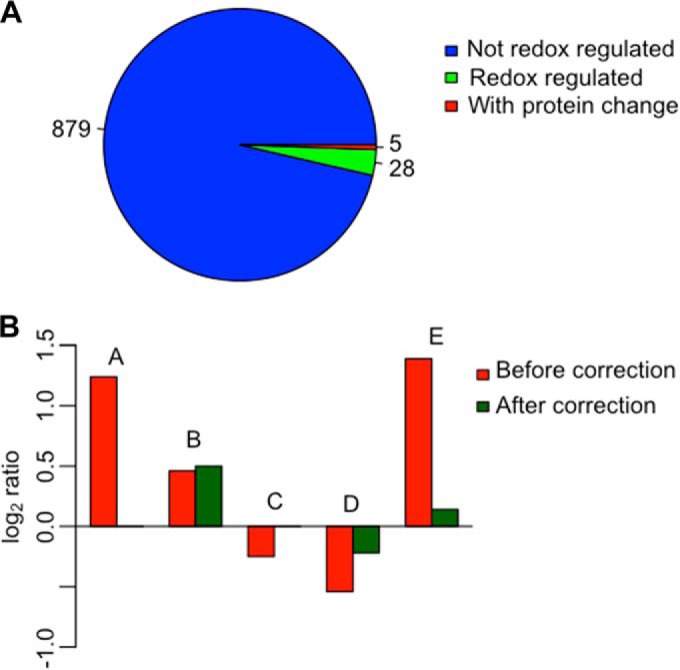
Biological application of cysTMTRAQ. A, number of cysteine-containing peptides, redox-regulated peptides, and peptides with protein-level changes identified. A cysteine peptide with a fold change of ≥1.2 or ≤0.8 in cysTMT tags and a q-value of ≤0.05 was considered redox regulated. The same criteria were used to determine peptides with iTRAQ tags for protein-level change. B, cysteine redox quantification of five peptides identified as redox regulated before and after correction for protein turnover: (A) CFEDNGLLYDLLEQNGR, (B) NVGSFDNNDENVGSGMVGAPACGDVMK, (C) APSLLQLSPDWTSNSCR, (D) GCGALDWGMQSR, and (E) ILLECVVK.
DISCUSSION
The results presented here have demonstrated that double-labeling of proteins with two different series of isobaric tags, cysTMT and iTRAQ, is feasible and can be used to examine protein redox and total amount changes simultaneously in one experiment. Because no enrichment step of cysteine peptides is involved, the method has the potential to reveal the stoichiometry of redox modifications. However, an enrichment step can be included to capture low-abundance redox proteins after the double-labeling procedure. In this case, both the enriched fraction and the flow-through will need to be analyzed via LC-MS/MS.
Compared with existing redox proteomics approaches (e.g. 6, 7, 16), this newly developed cysTMTRAQ method is advantageous because it allows researchers to accurately identify and quantify redox cysteines, peptides, and proteins and obtain high efficiency in the correlation between redox changes and total protein changes. Because cysTMT and iTRAQ are employed in the same experiment with the same samples, the sample variation and complication of protein-level changes in redox peptide/protein determination are resolved. High confidence and accuracy in the determination of the redox sensitivity of cysteine peptides can be achieved with high efficiency. Because this method acquires both redox and total protein-level information, samples in small quantities such as stomata preparations and patient biopsies can be preserved. In contrast to the use of two different experiments that lead to low correlation and high variation of identified peptides and proteins, this integrated cysTMTRAQ method is efficient and effective. However, it should be noted that the inherent problem of precursor interference associated with MS2 tandem mass tag and iTRAQ technologies has caused ratio compression (28, 29). The MS3 function on the new generation of mass spectrometers (e.g. the Thermo Scientific Orbitrap Fusion) can overcome this problem. Nevertheless, this cysTMTRAQ technological breakthrough will stimulate progression in redox proteomics, as well as other posttranslational modification proteomics, in many areas of biology and medicine.
Supplementary Material
Acknowledgments
The mass spectrometry data have been deposited to the ProteomeXchange Consortium via the PRIDE partner repository with the dataset submission number 27189.
Footnotes
Author contributions: S.C. designed research; J.P., K.B., and N.Z. performed research; J.P., K.B., and F.Z. analyzed data; J.P., K.B., and S.C. wrote the paper; F.Z. assisted with sample preparation.
* We thank the Howard Hughes Medical Institute for providing an undergraduate research award to F. Zhu. This work was supported by awards from the National Science Foundation (MCB 0818051 and MCB 1412547) to S. Chen.
 This article contains supplemental material.
1 The abbreviations used are:
- cysTMT
- cysteine reactive tandem mass tags
- iTRAQ
- isobaric tags for relative and absolute quantitation
- cysTMTRAQ
- cysteine reactive tandem mass tags with isobaric tags for relative and absolute quantitation
- HCD
- high-energy collision dissociation.
REFERENCES
- 1. Go Y. M., Jones D. P. (2013) Mapping the cysteine proteome: analysis of redox-sensing thiols. J. Biol. Chem. 288, 26512–26520 [DOI] [PubMed] [Google Scholar]
- 2. Ghezzi P., Bonetto V. (2003) Redox proteomics: identification of oxidatively modified proteins. Proteomics 3, 1145–1153 [DOI] [PubMed] [Google Scholar]
- 3. Barty J. W., Hampton M. B., Winterbourn C. C. (2005) Proteomic detection of hydrogen peroxide-sensitive thiol proteins in Jurkat cells. Biochem. J. 389, 785–795 [DOI] [PMC free article] [PubMed] [Google Scholar]
- 4. Alkhalfioui F., Renard M., Vensel W. H., Wong J., Tanaka C. K., Hurkman W. J., Buchanan B. B., Montrichard F. (2007) Thioredoxin-linked proteins are reduced during germination of Medicago truncatula seeds. Plant Physiol. 144, 1559–1579 [DOI] [PMC free article] [PubMed] [Google Scholar]
- 5. Alvarez S., Wilson G. H., Chen S. (2009) Proteomic analysis of in vivo redox regulated proteins in Arabidopsis. J. Chromatogr. B 877, 101–104 [DOI] [PubMed] [Google Scholar]
- 6. Fu C., Hu J., Liu T., Ago T., Sadoshima J., Li H. (2008) Quantitative analysis of redox-sensitive proteome with DIGE and ICAT. J. Proteome Res. 7, 3789–3802 [DOI] [PMC free article] [PubMed] [Google Scholar]
- 7. Zhu M., Zhu N., Song W., Harmon A., Assmann S. M., Chen S. (2014) Thiol-based redox proteins in abscisic acid and methyl jasmonate signaling in Brassica napus guard cells. Plant J. 78, 491–515 [DOI] [PMC free article] [PubMed] [Google Scholar]
- 8. Go Y. M., Roede J. R., Orr M., Liang Y., Jones D. P. (2014) Integrated redox proteomics and metabolomics of mitochondria to identify mechanisms of Cd toxicity. Toxicol. Sci. 139, 59–73 [DOI] [PMC free article] [PubMed] [Google Scholar]
- 9. Parker J., Zhu N., Zhu M., Chen S. (2012) Profiling thiol redox proteome using isotope tagging mass spectrometry. J. Vis. Exp. 61, 3766–3791 [DOI] [PMC free article] [PubMed] [Google Scholar]
- 10. McDonagh B., Martínez-Acedo P., Várquez J., Padilla A., Sheehan D., Bárcena J. A. (2012) Application of iTRAQ reagents to relatively quantify the reversible redox state of cysteine residues. Int. J. Proteomics 2012, 1–9 [DOI] [PMC free article] [PubMed] [Google Scholar]
- 11. Tambor V., Hunter C. L., Seymour S. L., Kacerovsky M., Stulik J., Lenco J. (2012) cysTRAQ—a combination of iTRAQ and enrichment of cysteinyl peptides for uncovering and quantifying hidden proteomes. J. Proteomics 75, 857–867 [DOI] [PubMed] [Google Scholar]
- 12. Mermelekas G., Makridakis M., Koeck T., Vlahou A. (2013) Redox proteomics: from residue modifications to putative biomarker identification by gel- and LC-MS-based approaches. Expert Rev. Proteomics 10, 537–549 [DOI] [PubMed] [Google Scholar]
- 13. Liu P., Zhang H., Wang H., Xia Y. (2014) Identification of redox-sensitive cysteines in the Arabidopsis proteome using OxiTRAQ, a quantitative redox proteomics method. Proteomics 14, 750–762 [DOI] [PubMed] [Google Scholar]
- 14. Su D., Gaffrey M. J., Guo J., Hatchell K. E., Chu R. K., Clauss T. R. W., Aldrich J. T., Wu S., Purvine S., Camp D. G., Smith R. D., Thrall B. D., Qian W. (2014) Proteomic identification and quantification of S-glutathionylation in mouse macrophages using resin-assisted enrichment and isobaric labeling. Radic. Biol. Med. 67, 460–470 [DOI] [PMC free article] [PubMed] [Google Scholar]
- 15. Chen S., Harmon A. (2006) Advance in plant proteomics. Proteomics 6, 5504–5516 [DOI] [PubMed] [Google Scholar]
- 16. Izquierdo-Alvarez A., Ramos E., Villanueva J., Hernansanz-Augustín P., Fernández-Rodriguez R., Tello D., Carrascal M., Martínez-Ruiz A. (2012) Differential redox proteomics allows identification of proteins reversibly oxidized at cysteine residues in endothelial cells in response to acute hypoxia. J. Proteomics 75, 5449–5462 [DOI] [PubMed] [Google Scholar]
- 17. Muthuramalingam M., Matros A., Scheibe R., Mock H. P., Dietz K. J. (2013) The hydrogen-sensitive proteome of the chloroplast in vitro and in vivo. Front. Plant Sci. 19, 4–54 [DOI] [PMC free article] [PubMed] [Google Scholar]
- 18. Chong P. K., Gan C. S., Pham T. K., Wright P. C. (2006) Isobaric tags for relative and absolute quantification (iTRAQ) reproducibility: implication of multiple injections. J. Proteome Res. 5, 1232–1240 [DOI] [PubMed] [Google Scholar]
- 19. Lee J., Koh H. J. (2011) A label-free quantitative shotgun proteomics analysis of rice grain development. Proteome Sci. 9, 51–61 [DOI] [PMC free article] [PubMed] [Google Scholar]
- 20. Bulaj G., Kortemme T., Goldenber D. P. (1998) Ionization-reactivity relationships for cysteine thiols in polypeptides. Biochem. 37, 8965–8972 [DOI] [PubMed] [Google Scholar]
- 21. Leichert L. I., Gehrke F., Gudiseva H. V., Blachwell T., Ilbert M., Walker A. K., Strahler J. R., Andrews P. C., Jakob U. (2008) Quantifying changes in the thiol redox proteome upon oxidative stress in vivo. Proc. Natl. Acad. Sci. U.S.A. 105, 8197–8202 [DOI] [PMC free article] [PubMed] [Google Scholar]
- 22. Parker J., Zhu N., Zhu M., Chen S. (2012) Profiling thiol redox proteome using isotope tagging mass spectrometry. J. Vis. Exp. 61, 3766–3791 [DOI] [PMC free article] [PubMed] [Google Scholar]
- 23. Cho H., Kim Y., Jun H. J., Lee S., Lee J. W. (2008) OutlierD: an R package for outlier detection using quantile regression on mass spectrometry data. Bioinformatics 24, 882–884 [DOI] [PubMed] [Google Scholar]
- 24. Hebert A. S., Merrill A. E., Bailey D. J., Still A. J., Westphall M. S., Strieter E. R., Pagliarini D. J., Coon J. J. (2013) Neutron-encoded mass signatures for multiplexed proteome quantification. Nat. Methods 10, 332–334 [DOI] [PMC free article] [PubMed] [Google Scholar]
- 25. Carrillo B., Yanofsky C., Laboissiere S., Nadon R., Kearney R. E. (2010) Methods for combining peptide intensities to estimate relative protein abundance. Bioinformatics 26, 98–103 [DOI] [PubMed] [Google Scholar]
- 26. Storey J. D. (2002) A direct approach to false discovery rates. J. R. Stat. Soc. B 64, 479–498 [Google Scholar]
- 27. Lichert L. I., Jakob U. (2004) Protein thiol modifications visualized in vivo. PLoS Biol. 2, e333. [DOI] [PMC free article] [PubMed] [Google Scholar]
- 28. Ting L., Rad R., Gygi S. P., Haas W. (2011) MS3 eliminates ratio distortion in isobaric multiplexed quantitative proteomics. Nat. Methods 8, 937–940 [DOI] [PMC free article] [PubMed] [Google Scholar]
- 29. Wenger C. D., Lee M. V., Hebert A. S., McAlister G. C., Phanstiel D. H., Westphall M. S., Coon J. J. (2011) Gas-phase purification enables accurate, multiplexed proteome quantification with isobaric tagging. Nat. Methods 8, 933–935 [DOI] [PMC free article] [PubMed] [Google Scholar]
Associated Data
This section collects any data citations, data availability statements, or supplementary materials included in this article.