

Abstract
Amplification of MYCN is the most well-known prognostic marker of neuroblastoma risk classification, but still is only observed in 25% of cases. Recent evidence points to the cyclic adenosine monophosphate (cAMP) elevating ligand prostaglandin E2 (PGE2) and β-catenin as two novel players in neuroblastoma. Here, we aimed to define the potential role of PGE2 and cAMP and its potential interplay with β-catenin, both of which may converge on neuroblastoma cell behaviour. Gain and loss of β-catenin function, PGE2, the adenylyl cyclase activator forskolin and pharmacological inhibition of cyclooxygenase-2 (COX-2) were studied in two human neuroblastoma cell lines without MYCN amplification. Our findings show that PGE2 enhanced cell viability through the EP4 receptor and cAMP elevation, whereas COX-2 inhibitors attenuated cell viability. Interestingly, PGE2 and forskolin promoted glycogen synthase kinase 3β inhibition, β-catenin phosphorylation at the protein kinase A target residue ser675, β-catenin nuclear translocation and TCF-dependent gene transcription. Ectopic expression of a degradation-resistant β-catenin mutant enhances neuroblastoma cell viability and inhibition of β-catenin with XAV939 prevented PGE2-induced cell viability. Finally, we show increased β-catenin expression in human high-risk neuroblastoma tissue without MYCN amplification. Our data indicate that PGE2 enhances neuroblastoma cell viability, a process which may involve cAMP-mediated β-catenin stabilization, and suggest that this pathway is of relevance to high-risk neuroblastoma without MYCN amplification.
Keywords: neuroblastoma, prostaglandin E2, cyclic AMP, β-catenin
Introduction
Neuroblastomas are heterogeneous tumours that vary to a large extent in prognosis and disease outcome and are responsible for 15% of all childhood cancer deaths [1]. Although recent studies have focused on the link between proliferation, differentiation and programmed cell death in neuroblastoma, understanding of the molecular mechanisms driving neuroblastoma heterogeneity is poor. The most extensively defined factor associated with neuroblastoma is the Myc oncoprotein family member MYCN, which is especially amplified in the most aggressive and often metastatic forms of neuroblastoma [2,3]. Although MYCN has important prognostic value, amplification is only observed in about 25% of neuroblastoma cases and it remains largely to be defined what other factors contribute to high-risk neuroblastoma.
Expression of cyclooxygenase-2 (COX-2) and prostaglandin E2 (PGE2) have been found increased in a variety of malignant tumours, including neuroblastoma [4,5] and pharmacological inhibition of COX-2 has been shown to attenuate cell cycle progression in malignant cells [6–9]. PGE2 is produced by a multistep enzymatic process in which the rate-limiting step is mediated by COX enzymes. PGE2 binds to its membrane bound E-type prostanoid receptors, of which prostanoid receptors type 2 and 4 are known to couple to Gαs and are thereby able to increase intracellular cyclic adenosine monophosphate (cAMP) levels. cAMP is involved in the regulation of diverse cellular processes, including regulation of cytoskeletal dynamics, cellular differentiation, proliferation and programmed cell death in a variety of cells including neural-like cells [10,11].
Of particular interest are recent research lines that focus on molecular interactions between PGE2, cAMP and β-catenin. β-catenin contributes to other malignancies such as hepatocellular carcinoma and colorectal carcinoma and its role in paediatric malignancies is well documented [12]. Also, its role in normal physiological development of pluripotent cells from the neural crest has been well-established [13–15]. Regarding neuroblastoma, β-catenin expression is increased in MYCN non-amplified neuroblastoma cell lines and β-catenin target gene transcription is increased in neuroblastoma tumours without MYCN amplification [16].
Distinct pools of β-catenin exhibit distinct cellular functions. β-Catenin associates with membrane junctional complexes where it binds to cadherins and α-actin. Free cytosolic β-catenin is rapidly tagged for proteasomal degradation by a multiprotein destruction complex comprised of the kinases glycogen synthase kinase 3β (GSK3β), casein kinase 1 and adaptor proteins like axin2, which is the limiting component in the assembly of this complex [17–19]. Stabilized β-catenin translocates to the nucleus, where it activates transcription of TCF/Lef target genes. The result is expression of mitogenic and survival genes including Myc oncogene family members [20] and cyclin D1 [21]. Interestingly, PGE2 has been shown to enhance β-catenin nuclear localization via dissociation of GSK3β from axin by Gαs [22] and by activating protein kinase A (PKA) [23]. Activated PKA can directly phosphorylate β-catenin at residue ser675 [24] and GSK3β at residue ser9 [10,25,26].
In this paper, we aim to identify the contribution of a molecular link between PGE2 and β-catenin to cell proliferation and inhibition of apoptosis, independent of MYCN amplification.
Materials and methods
Cell culture
Human neuroblastoma cell lines SK-N-AS and SK-N-SH were obtained from ATCC (Manassas, VA, USA). Both cell lines are of epithelial morphology. Cells were maintained in DMEM (1.0 g/l glucose, HEPES) supplemented with 10% v/v heat-inactivated FCS, non-essential amino acids and antibiotics (penicillin 100 U/ml, streptomycin 100 μ/ml) in a humidified atmosphere of 5% CO2 at 37°C. Cells were washed with HBSS (400 mg/l KCl, 60 mg/l KH2PO4, 8 g/l NaCl, 350 mg/l NaHCO3, 50 mg/l Na2HPO4·H2O, 1 g/l glucose, pH 7.4), dissociated from the plate with trypsin EDTA and seeded in appropriate cell culture plate format. Cells were serum-deprived for 24 hrs before stimulation. Inhibitors (XAV939, celecoxib and niflumic acid) or antagonists (AH6809 and L-161,982) were added 30 min. prior to stimulation with PGE2.
Cell viability assay
Experiments were performed in 24-well cell culture plates. Prior to measurement, cells were washed with calcium containing HBSS (400 mg/l KCl, 60 mg/l KH2PO4, 8 g/l NaCl, 140 mg/l CaCl2, 100 mg/l MgCl2·6H2O, 100 mg/l MgSO4·7H2O, 90 mg/l Na2HPO4·7H2O, 1 g/l glucose, pH 7.4) and then incubated with 5% v/v AlamarBlue (Invitrogen, Carlsbad, CA, USA) followed by fluorescence spectrophotometry. Treated cultures were normalized to control cultures.
cAMP assay
Experiments were performed in 24-well cell culture plates. When indicated, cells were pre-incubated with niflumic acid for 2 hrs. Cells were incubated in serum-free DMEM supplemented with 0.1 mM 3-Isobutyl-1-methylxanthine for 10 min at 37°C with indicated stimuli. A radioactive competitive binding assay was used to determine cAMP levels, as described earlier [27–30].
Colony formation assay
Cells were seeded in six-well plates. Cells were incubated in DMEM for 14 days with indicated stimuli. Medium was refreshed every 3 days. Cells were fixed with paraformaldehyde (PFA) and stained with 0.05% Crystal Violet. Plates were photographed and confluency was quantified using ImageJ software.
PGE2 ELISA
Cells were cultured in 24-well plates and PGE2 production was measured in culture medium from overnight cultures incubated with niflumic acid using the PGE2 ELISA assay from Cisbio (Codolet, France).
Fluorescence-activated cell sorting
Cells were cultured on 60 mm plates and incubated for 24 hrs with designated stimuli. For cell cycle analysis, cells were incubated for 30 min. with 30 μM bromodeoxyuridine (BrdU). Cells were dissociated from the plate with accutase, fixed with 95% EtOH and DNA was denatured using 2M HCl. Cells were incubated with anti-BrdU FITC-conjugated antibody, propidium iodide (PI) and RNAse A. A total of 40,000 stained cells in FACS buffer (PBS containing 1% v/v BSA, 20 mM EDTA) were analysed in FACSCalibur (BD Biosciences, Franklin Lakes, NJ, USA). ModFit LT software was used to determine the distribution of cells over the cell cycle phases designated G0/G1, S and G2/M. For detection of apoptosis, cells were washed with binding buffer (140 mM NaCl, 4 mM KCl, 0.75 mM MgCl2, 10 mM HEPES). A total of 400,000 cells were resuspended in ice-cold binding buffer supplemented for 15 min. with 2 mM CaCl2, PI (1 μg/ml) and FITC-conjugated annexin V antibody (IQ Products, Groningen, The Netherlands). A total of 10,000 stained cells were analysed by Kaluza Flow Analysis Software (Beckman Coulter, Brea, CA, USA).
JC-1 mitochondrial membrane polarization assay
Cells were seeded in 24-well plates and incubated with designated stimuli for 24 hrs and mitochondrial membrane polarization was measured using the Mitochondrial Staining Kit (Sigma-Aldrich, Munich, Germany).
Isolation of mRNA and real-time PCR analysis
Total mRNA extraction was performed with the NucleoSpin RNA II Kit (Machery-Nagel, Düren, Germany). cDNA was acquired using reverse transcription by AMV Reverse Transcriptase Kit (Promega, Madison, WI, USA). qPCR was performed with the Illumina Eco Personal qPCR System (Westburg, Leusden, The Netherlands). Cycle parameters (30 sec. each): denaturation at 94°C, annealing at 60°C and extension at 72°C. Target genes were normalized to the geometric mean of reference genes GAPDH, SDHA and YWHAZ [29]. Primer sequences are listed in Table 1.
Table 1.
Primer sequences
| Gene | Forward | Reverse |
|---|---|---|
| MYCN | CTAAACGTTGGTGACGGTTG | GGTATCAAATGGCAAACCCC |
| CCND1 | ATGCCAACCTCCTCAACGAC | GGCTCTTTTTCACGGGCTCC |
| EP1 | TTGGGTGTACATCCTACTGC | TGTGCTTAGAAGTGGCTGAG |
| EP2 | TGGCTATCATGACCATCACC | TCCTTTCGGGAAGAGGTTTC |
| EP3 | TAGCTCTTCGCATAACTGGG | GTTGCAGGAAAAGGTGACTG |
| EP4 | GAACATCCTGGCTTTTGAGC | TGTGACCACAATCCTCTGTC |
| GAPDH | CCAGCAAGAGCACAAGAGGA | GAGATTCAGTGTGGTGGGGG |
| SDHA | TGGGAACAAGAGGGCATCTG | CCACCACTGCATCAAATTCATG |
| WYHAZ | ACTTTTGGTACATTGTGGCTTCAA | CCGCCAGGACAAACCAGTAT |
Transfection
Cells grown to 60% confluence were transfected in serum- and antibiotics-free DMEM with plasmid DNA [TOPflash, FOPflash, renilla luciferase (Upstate Biotechnology, Charlottesville, VA, USA), β-cateninS33Y (AddGene plasmid 19286, Cambridge, MA, USA) [30], pcDNA3 vector] using X-tremeGENE 9 DNA transfection reagent (Roche Applied Science, Penzberg, Germany).
TOP flash assay
TOPflash- or FOPflash-transfected cells were subjected to stimulation in serum-free DMEM for 16 hrs, and luciferase activity was assayed via the Dual Reporter luciferase assay system (Promega).
Preparation of nuclear fractions
Cell were seeded in 100 mm cell culture dishes and dissociated with a cell scraper. Cells were incubated with hypotonic buffer (25 mM HEPES pH 7.5, 10 mM KCl, 1 mM EDTA, 0.2 mM Na3VO4, 50 mM NaF, β-glycerophosphate, 10% v/v glycerol, pepstatin A, leupeptin, apoprotinin) for 10 min. on ice and 15 min. with 0.1% v/v IGEPAL added. After centrifugation at 3000 × g for 3 min., the supernatant (cytosolic fraction) was collected and pellets were resuspended in ice-cold cell extraction buffer (25 mM HEPES pH 7.5, 420 mM NaCl, 10% w/v sucrose, 10 mM KCl, 1 mM EDTA, 10% v/v glycerol, 50 mM NaF, 0.2 mM Na3VO4, β-glycerophosphate, pepstatin A, leupeptin, apoprotinin) for 30 min. After centrifugation at 14,000 × g for 10 min., supernatant (nuclear fraction) was collected.
Immunoblotting
Cells were lysed in ice-cold RIPA buffer supplemented with phosphatase and protease inhibitors (aprotinin, leupeptin, pepstatin A, Na3VO4, NaF, β-glycerophosphate). Equal amounts of protein were subjected to electrophoresis on polyacrylamide gels and transferred to nitrocellulose membranes. Membranes were blocked with 5% w/v BSA or 5% w/v milk in tris-buffered saline with 0.1% v/v Tween-20. Protein expression was determined by specific primary and horseradish peroxidase (HRP)-conjugated secondary IgGs. Antibodies used are listed in Table 2. Protein expression was visualized by ECL in the Syngene G:BOX HR iChemi gel documentation system (Syngene, Cambridge, UK). Band was quantified by densitometry using ImageJ software.
Table 2.
Primary antibodies
| Antibody | Source (catalogue number) | Dilution |
|---|---|---|
| Cyclin D1 | Cell Signaling (2926) | 1:1000 |
| Histone H3 | Cell Signaling (9715) | 1:500 |
| PARP | Cell Signaling (9542) | 1:1000 |
| p-GSK3α/β (ser21/9) | Cell Signaling (9331) | 1:500 |
| p-β-Catenin (ser675) | Cell Signaling (4176) | 1:2000 |
| α-Tubulin | Millipore (05-829) | 1:2000 |
| Active β-Catenin | Millipore (05-665) | 1:1000 |
| β-Catenin (total) | BD Biosciences (610153) | 1:2000 |
Immunofluorescence
Cells were grown on LabTek II Chamber Slides (Thermo Fisher Scientific, Marietta, OH, USA), fixed with PFA and permeabilized with 0.3% w/v Triton X-100 in cytoskeletal buffer (10 mM Tris, 150 mM NaCl, 5 mM EGTA, 5 mM MgCl2, 5 mM glucose, pH 6.1). Cells were blocked using 1% w/v BSA and 2% v/v donkey serum in CytoTBS-T (20 mM Tris, 154 mM NaCl, 2 mM EGTA, 2 mM MgCl2, 0.1% v/v Tween-20, pH 7.2). p-β-Catenin (ser675) IgG was applied overnight, secondary FITC-conjugated donkey anti-rabbit IgG (Jackson Laboratories, Bar Harbor, ME, USA) was applied for 3 hrs. Nucleus was visualized with 1 μg/ml Hoechst 33342 (Invitrogen). Slides were mounted with ProLong® Gold Antifade Reagent (Life Technologies, Marietta, OH, USA). Images were captured with a Leica DM4000 B Fluorescence microscope (Leica Microsystems, Wetzlar, Germany) equipped with a Leica DFC 345 FX camera.
Study population and samples
Formalin-fixed paraffin-embedded tumour samples from 31 neuroblastomas were analysed. All samples were collected at our own hospital between 1984 and 2012 according to the Research Code of the University Medical Center Groningen (https://www.umcg.nl/en/research/researchers/general/researchcode/pages/default.aspx) and national ethical and professional guidelines (Code of Conduct; Dutch Federation of Biomedical Scientific Societies; http://www.federa.org). Tumour specimens were subdivided based on risk group assessment in low risk, medium risk and high risk according to Children's Oncology Group risk groups (Table 3).
Table 3.
The Children's Oncology Group (COG) risk group classification
| Risk group | Stage (INSS) | Age | Histology | DNA Ploidy | MYCN |
|---|---|---|---|---|---|
| Low risk | Stage 1 | Any | Any | Any | Any |
| Stage 2A/B | <12 months | Any | Any | Any | |
| Stage 2A/B | >12 months | Any | Any | Non-Amplified | |
| Stage 4S | <12 months | Favourable | Hyperdiploid | Non-Amplified | |
| Medium risk | Stage 3 | <12 months | Any | Any | Non-Amplified |
| Stage 3 | >12 months | Favourable | Any | Non-Amplified | |
| Stage 4 | <12 months | Any | Any | Non-Amplified | |
| Stage 4S | <12 months | And/or Unfavourable | And/or Normal | Non-Amplified | |
| High risk | Stage 2A/B | >12 months | Any | Any | Amplified |
| Stage 3 | Any | Any | Any | Amplified | |
| Stage 3 | >18 months | Unfavourable | Any | Any | |
| Stage 4 | Any | Any | Any | Amplified | |
| Stage 4 | >18 months | Any | Any | Any | |
| Stage 4 | >12 months <18 months | And/or Unfavourable | And/or Normal | And/or Amplified | |
| Stage 4S | <12 months | Any | Any | Amplified |
Fluorescence in situ hybridization
Fluorescence in situ hybridization was performed to exclude MYCN-amplified tumours from the study population. Tissue sections were hybridized with Vysis LSI N-MYC (2p24) SpectrumGreen/CEP2 SpectrumOrange Probe (Abbott Molecular, Green Oaks, IL, USA). The LSI N-MYC (2p24) probe hybridizes to the 2p24 region and contains sequences that flank both 5′ and 3′ ends of the MYCN gene. The CEP2 (2p11.1-q11.1) probe hybridizes to alpha satellite sequences specific to chromosome 2. Images were captured using a Leica DMRA2 Fluorescence microscope (Leica Microsystems) equipped with a Leica DC350F camera. The number of spots in 20 adjacent tumour cells was counted for MYCN and CEP2. When ratio between the two signals exceeded 2, the tumour was scored as MYCN amplified.
Immunohistochemistry
For determination of β-catenin protein expression, deparaffinized tumour sections were incubated with anti-β-catenin IgG (1:25 in 1% v/v goat serum, 1% v/v human serum) overnight and subsequent with HRP-conjugated rabbit antimouse IgG (1:1000; DAKO, Glostrup, Denmark). Staining was performed with 0.5 mg/ml 3,3′-diaminobenzidine in 30 mM imidazole containing 0.03% v/v H2O2 and 1 mM EDTA, pH 7.0. As a negative control, the primary antibodies were omitted. For each sample, expression was quantified by measuring the average staining intensity on a scale of 256 channels using ImageJ software in four different random selected regions within the tumour (using haematoxylin and eosin-stained sections). Differences between the groups were tested for significance using the Kruskal–Wallis test. All procedures were performed blind.
Reagents
BrdU, mouse anti-BrdU antibody, PI, L-161,982 and celecoxib were purchased from Sigma-Aldrich. 16,16-dimethyl-PGE2, XAV939, AH6809 and forskolin were from Tocris Bioscience (Bristol, UK). Niflumic acid was from Cayman Chemical (Ann Arbor, MI, USA). All other chemicals were of analytical grade.
Statistics
Data represent means ± SEM, from n separate experiments. Normality and equal variance were evaluated by Shapiro–Wilk test and f-test. Statistical significance of differences was evaluated by Student's t-test and one-way or two-way anova followed by a Tukey multiple comparison test. Non-parametric data were evaluated with the Kruskal–Wallis test followed by Dunn's multiple comparison test. Differences were considered to be statistically significant when P < 0.05.
Results
cAMP and PGE2 enhance neuroblastoma cell viability
To study the effects of cAMP elevation on MYCN non-amplified neuroblastoma cell viability, SK-N-AS cells were incubated for the indicated periods of time with the direct adenylyl cyclase activator forskolin or PGE2 (Fig. 1A). Forskolin or PGE2 enhanced time-dependently cellular viability compared to control treated cells. To determine that PGE2 could act via elevation of cAMP, we measured intracellular cAMP levels. Cells show increase in cAMP levels after incubation with forskolin compared to basal. Similar, 16,16-dimethyl-PGE2 (in this paper referred to as PGE2) induces cAMP elevation (Fig. 1B).
Fig. 1.

Effect of PGE2 and forskolin on SK-N-AS cell viability. (A) Cell viability after 24- and 48-hr incubation with 10 μM forskolin or 3 μM PGE2. (B) cAMP formation under basal (1.8 ± 0.38 pmol/min/mg/protein), forskolin (23.04 ± 0.31/pmol/min/mg protein) and PGE2 (4.79 ± 0.64 pmol/min/mg protein)-treated conditions. (C) Representative Western blot images showing expression of cyclin D1 after 8-hr incubation with forskolin or PGE2. (D) qRT-PCR detection of EP1-4 mRNA expression (Cq values) and representative bands on agarose gel. (E) Cell viability after 48-hr incubation with 10 μM AH6809 and 3 μM L-161,982 in combination with PGE2. Data represent mean ± SE of the mean of four separate experiments. *P < 0.05, **P < 0.01, ***P < 0.001 compared to DMSO-treated cells.
In addition, expression of cyclin D1, a cell cycle regulatory protein involved in G1/S-phase transition, is increased by both forskolin and PGE2 (Fig. 1C).
Prostaglandin E2 mediates its effects through activation of four subtypes of E-type prostanoid receptors, termed EP1-4. Of these receptors, EP2 and EP4 are known to be Gαs-coupled and enhance intracellular cAMP. SK-N-AS neuroblastoma cells express all four receptor subtypes (Fig. 1D). To study which receptor is involved in enhancement of cell viability by PGE2, the EP2 and EP4 receptor were antagonized using AH6809 and L-161,982 respectively. AH6809 did not affect PGE2-enhanced cell viability. However, L-161,982 completely prevented enhancement of cell viability by PGE2 (Fig. 1E), demonstrating that the effects of PGE2 are mediated through the Gαs-coupled EP4 receptor.
Cyclooxygenase-2 inhibition attenuates neuroblastoma cell viability
Prostaglandin E2 is produced by a multistep enzymatic process from arachidonic acid, in which the rate-limiting step is mediated by COX. Expression of COX-2 is increased in many cancers, including neuroblastoma, resulting in high PGE2 production [31]. As PGE2 enhances cell cycle progression, inhibition of PGE2 production by COX-2 inhibition should attenuate cell proliferation. In overnight culture, neuroblastoma cells produce PGE2 (150 pg/ml) and COX-2 inhibition with niflumic acid decreases PGE2 (6 pg/ml). Importantly, niflumic acid decreases dose-dependently viability of SK-N-AS cells (Fig. 2A). To confirm that the niflumic acid data were the result of COX-2 inhibition, another COX-2 inhibitor was used, celecoxib. Similar to niflumic acid, celecoxib treatment resulted in a marked decrease in cell viability (Fig. 2B). To visualize decreased cell survival over a longer time, cells were cultured for 14 days in a colony formation assay in the presence or absence of either niflumic acid (Fig. 2C) or celecoxib (Fig. 2D). Confluency was markedly decreased in the presence of specific COX-2 inhibitors which was more pronounced when higher concentrations of COX-2 inhibitor were used.
Fig. 2.

Effect of specific COX-2 inhibition on SK-N-AS cell viability. (A) Cell viability after 48-hr incubation with indicated concentrations of niflumic acid (IC50 SK-N-AS 355 μM). (B) Cell viability after 48-hr incubation with 50 μM celecoxib. (C and D) Representative pictures of a colony formation assay. Data represent mean ± SE of the mean of 4–10 separate experiments. **P < 0.01, ***P < 0.001 compared to DMSO-treated cells.
Cyclooxygenase-2 inhibition blocks cell cycle progression and activates an apoptotic response
To clarify mechanisms underlying the reduction in cell survival by COX-2 inhibition, we studied cell cycle progression and apoptotic pathway activation. Cell cycle progression was first studied by BrdU incorporation followed by fluorescence-activated cell sorting using cytometry (Fig. 3A). PI was used to measure the overall DNA content of cells. Niflumic acid reduced the amount of BrdU-positive cells and cells with a ploidy between 2n (cells in G0/G1) and 4n (cells in G2/M), indicating a lower fraction of cells in S-phase. In contrast, induction of apoptosis was studied by sorting cells based on membrane expression of annexin V (Fig. 3B). Viable cells are located in the lower left quadrant (double negative), early apoptotic cells are located in the lower right quadrant (annexin V positive, PI negative) and late apoptotic cells are located in the upper right quadrant (double positive). Niflumic acid treatment exerts a higher percentage of cells in late apoptosis, while the percentage of cells in early apoptosis was not affected. To confirm apoptotic pathway activation, we measured aggregation of the JC-1 dye at mitochondrial membranes. A distinctive feature of the early stages apoptosis is the disruption of active mitochondria, which includes changes in the membrane potential. In healthy, polarized membranes, the JC-1 dye spontaneously forms aggregates with red fluorescence (EM 590 nm), while in apoptotic cells, the JC-1 dye remains in its monomeric form (EM 529 nm). Inhibition of COX-2 with niflumic acid results in attenuated mitochondrial membrane polarization (Fig. 3C). Valinomycin served as a positive control.
Fig. 3.
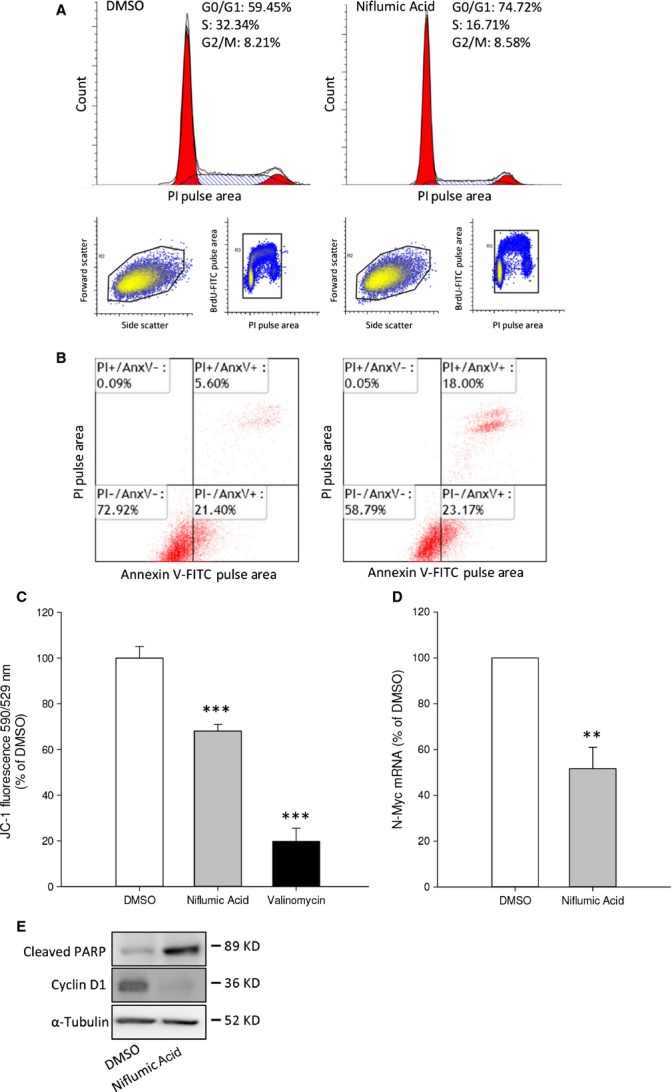
COX-2 inhibition decreases cell cycle progression and induces apoptotic events in SK-N-AS cells. (A) Cell cycle analysis after 200 μM niflumic acid. (B) Niflumic acid-induced apoptosis was analysed by annexin V labelling. Lower left: viable cells; lower right: early apoptotic cells; upper right: late apoptotic/necrotic cells. (C) Mitochondrial membrane polarization was measured with JC-1 in cells incubated with niflumic acid. (D) qPCR data showing N-Myc mRNA expression after 16-hr incubation with niflumic acid. (E) Representative Western blot images showing niflumic acid-induced PARP cleavage and expression of Cyclin D1 after 24 hrs. Data represent mean ± SE of the mean of 4–10 separate experiments. ***P < 0.001 compared to DMSO-treated cells.
Amplification and thereby increased expression of N-Myc is the best known marker for neuroblastoma risk profile [1–3]. N-Myc is a positive regulator of cell cycle progression and a negative regulator of programmed cell death. COX-2 inhibition with niflumic acid decreased expression of N-Myc mRNA (Fig. 3D). To further distinguish between inhibition of cell cycle progression and induction of apoptotic signalling, we looked for expression of cyclin D1. Niflumic acid attenuated expression of cyclin D1, which is consistent with the cell cycle analysis shown in Figure 3A. Finally, niflumic acid-induced cleavage of the apoptosis linked Poly ADP ribose polymerase (PARP) (Fig. 3E).
Rescue of cyclooxygenase-2-dependent cell survival by exogenous prostaglandin E2
To confirm that the decreased viability of neuroblastoma cells in response to COX-2 inhibition (Fig. 2) is a result of lower PGE2 levels, cells were incubated with niflumic acid absence or presence of exogenous PGE2. We used a concentration of niflumic acid that results in ±75% viability compared to control-treated cells. Reduced viability resulting from COX-2 inhibition by niflumic acid was completely restored by exogenous PGE2 in a dose-dependent manner (Fig. 4A). In addition, niflumic acid treatment resulted in a marked decrease in cAMP production, which was rescued by simultaneous addition of exogenous PGE2 (Fig. 4B).
Fig. 4.

Attenuated cell viability of SK-N-AS cells in response to COX-2 inhibition can be restored by PGE2. (A) Viability after 48-hr incubation with niflumic acid in the absence or presence of the indicated concentrations of PGE2. (B) cAMP formation in response to niflumic acid with and without PGE2. (C) Representative pictures of a colony formation assay. (D) Cell viability after 48-hr incubation with 25 μM celecoxib and PGE2. Data represent mean ± SE of the mean of four separate experiments. *P < 0.05, **P < 0.01 compared to DMSO-treated cells, #P < 0.05, ##P < 0.01 compared to COX-2 inhibitor-treated cells.
Likewise, exogenous PGE2 prevented inhibition of colony formation induced by COX-2 inhibition (Fig. 4C). Similarly, celecoxib attenuated neuroblastoma cell viability, which was restored by exogenous PGE2 (Fig. 4D).
cAMP enhances β-catenin stability and activates β-catenin target gene transcription
β-catenin stability and transcriptional activity are known to determine the balance between cell proliferation and differentiation and are involved in the progression of several cancers [32]. Because several recent reports suggest that PGE2 can enhance β-catenin stability and transcriptional activity [22,33–36], we aimed to identify the effects of forskolin and PGE2 on β-catenin stability and transcriptional activity. In response to cAMP elevation, PKA is activated. PKA can phosphorylate β-catenin and GSK3β (see introduction). β-catenin not phosphorylated by GSK3β is stable and translocates to the nucleus. In this paper, we refer to this stable form of β-catenin as active β-catenin. Neuroblastoma cells stimulated with forskolin or PGE2 were analysed for protein levels of phosphorylated β-catenin and GSK3β. Forskolin and PGE2 induced phosphorylation of β-catenin (ser675), p-GSK3β (ser9) and concomitant higher levels of active, unphosphorylated, β-catenin (Fig. 5A). It has been reported that phosphorylation of β-catenin by PKA (ser675) enhances β-catenin stability and its nuclear translocation [24,37,38]. β-Catenin localization was determined by analysis of cytosolic (C) and nuclear fractions (N) (Fig. 5B). Phosphorylation of β-catenin (ser675) was increased in both nuclear and cytosolic fractions by cAMP and PGE2. Levels of active β-catenin were increased in nuclear fractions by cAMP and PGE2. To visualize localization of p-β-catenin (ser675), neuroblastoma cells were stimulated with forskolin or PGE2 after which p-β-catenin (ser675) was visualized by immunofluorescence (Fig. 5C). Both forskolin and PGE2 transiently increased levels of p-β-catenin (ser675) and induced accumulation of p-β-catenin (ser675) in (peri)nuclear regions (white arrows, Fig. 5C), which was followed by a rapid decline. To assess β-catenin/TCF target gene transcription in response to forskolin or PGE2, neuroblastoma cells were transfected with a TCF luciferase reporter gene construct (TOPflash) containing multiple TCF-binding sites or a construct with mutated TCF-binding sites (FOPflash). Either forskolin or PGE2 induced TCF reporter gene expression, as measured by luciferase activity in cell lysates (Fig. 5D).
Fig. 5.

β-Catenin activity is enhanced by PGE2 and forskolin in SK-N-AS cells. (A) Representative Western blot images of active β-catenin, p-β-catenin (ser675) and p-GSK3β (ser9) in cells incubated with forskolin or PGE2 for 30 min. (B) Representative Western blot images of cytosolic (C) and nuclear fractions (N) of active β-catenin and p-β-catenin (ser675) in cells incubated with forskolin or PGE2 for 30 min. (C) Representative immunofluorescence images of p-β-catenin (ser675) in response to forskolin or PGE2 for the indicated periods of time. White arrows indicate presence at (peri)nuclear regions. (D) TOPFlash assay of cells incubated with forskolin or PGE2. Data represent mean ± SE of the mean of four separate experiments. *P < 0.05, ***P < 0.001 compared to DMSO-treated cells.
β-Catenin is involved in neuroblastoma cell survival
To study if the effects of forskolin and PGE2 on cell survival are mediated via β-catenin-dependent gene transcription in a non-Wnt ligand-dependent manner, neuroblastoma cells were transfected with the stable active mutant of β-catenin (β-cateninS33Y). Transfection with β-cateninS33Y increased protein levels of β-catenin (Fig. 6A). Functionally, β-cateninS33Y increased TCF reporter gene activity (Fig. 6B). In addition, active β-catenin could enhance cellular viability and cell cycle progression. Overexpression of β-cateninS33Y enhanced cell viability compared to cells expressing the empty vector (Fig. 6D).
Fig. 6.

Overexpression of a degradation-resistant mutant of β-catenin (β-cateninS33Y) in SK-N-AS cells and inhibition of β-catenin by XAV939. (A) Representative Western blot images of β-cateninS33Y expression. (B) TOPFlash assay of cells expressing of β-cateninS33Y. (C) Representative Western blot images of β-catenin expression in cells after 1 μM XAV939 treatment for 24 hrs. (D) Cell viability of cells expressing of β-cateninS33Y. (E) Cell viability of cells incubated with PGE2 absence or presence of XAV939. Data represent mean ± SE of the mean of four separate experiments. *P < 0.05, ***P < 0.001 compared to DMSO-treated cells, #P < 0.05 compared to PGE2-treated cells.
Conversely, we addressed whether β-catenin is required for PGE2-induced neuroblastoma cell viability. To study this, we lowered active (non-phosphorylated) β-catenin by enhancing the stability of axin2, the limiting factor of the APC/GSK3β/CK1 destruction complex that targets β-catenin for proteasomal degradation, with the tankyrase inhibitor XAV939 [39]. Levels of active β-catenin were reduced by XAV939 treatment, while total levels of β-catenin remained unchanged (Fig. 6C). Importantly, while XAV939 prevented PGE2-induced cell viability, it did not affect neuroblastoma cell viability at a basal level (Fig. 6E). Thus, our data indicate that the effects of PGE2 on neuroblastoma involve active β-catenin.
SK-N-SH human neuroblastoma cells
Cancer cell lines are often characterized by cell line-specific (genetic) abrogations that do not accurately reflect the behaviour of other cancer cell lines originating from the same disease. We therefore repeated key experiments in a different human neuroblastoma cell line without MYCN amplification, SK-N-SH. Similar to SK-N-AS, forskolin and PGE2 enhanced SK-N-SH neuroblastoma cell viability, while antagonism of the EP4 receptor with L-161,982 prevented PGE2-enhanced cell viability which was not affected by antagonism of the EP2 receptor using AH6809 (Fig. 7A and data not shown). In addition, overexpression of β-cateninS33Y enhanced cell viability (Figs 6D and 7B). Specific COX-2 inhibition with niflumic acid or celecoxib (data not shown) attenuated cell viability in a dose-dependent manner (Figs 2A and 7C). SK-N-SH cells were more sensitive towards COX-2 inhibition compared to SK-N-AS. The PGE2-induced enhanced cell viability was prevented by attenuating active β-catenin with the tankyrase inhibitor XAV939 (Figs 6E and 7D). Thus, SK-N-SH and SK-N-AS human neuroblastoma cell lines behave similarly in response to manipulation of PGE2 or β-catenin signalling properties.
Fig. 7.

Viability of SK-N-SH human neuroblastoma cells after modulation by PGE2 and β-catenin. (A) Cell viability after 48 hrs of cells incubated with forskolin or PGE2 and L-161,982. (B) Cell viability of cells expressing of β-cateninS33Y. (C) Cell viability after 48-hr incubation with indicated concentrations of niflumic acid. (D) Cell viability of cells incubated with PGE2 in the absence or presence of XAV939. Data represent mean ± SE of the mean of 4–10 separate experiments. *P < 0.05, **P < 0.01, ***P < 0.001 compared to DMSO-treated cells, #P < 0.05 compared to PGE2-treated cells.
High-risk neuroblastoma without amplification of MYCN exhibit high β-catenin expression
Finally, we examined a potential correlation between β-catenin expression in neuroblastoma tumour sections with neuroblastoma risk profile. We investigated tumour specimens that were collected and stored for diagnosis for expression of β-catenin protein by immunohistochemistry. Characteristics of the investigated risk group populations are listed in Table 4. We were only interested in cases without MYCN amplification as it has previously been reported that β-catenin expression is increased in neuroblastoma tumours and cell lines without amplification of MYCN [16]. Fluorescence in situ hybridization was performed to identify amplification status of neuroblastoma specimens. We regarded tumour specimens that scored positive for MYCN amplification as a separate group of tumours. β-Catenin expression was determined by scoring the average staining intensity of the tumour. β-Catenin was found predominantly at the periphery of the cell body and within the neuropil, areas of the tumour that are comprised of non-myelinated axons, dendrites and synaptic dense regions. We did not observe β-catenin-positive nuclei. When high-risk tumours with MYCN amplification were compared to high-risk tumours without MYCN amplification, higher levels of β-catenin were found in high-risk tumours without MYCN amplification. Importantly, we observed higher levels of β-catenin in tumour specimens from high-risk tumours compared to expression in low- and medium-risk cases (P = 0.042) (Fig. 8C).
Table 4.
Characteristics of study population
| Risk (COG) | n | Sex | Age (in months) | Stage (INSS) | Me | St | Pr | Re | De | ||||
|---|---|---|---|---|---|---|---|---|---|---|---|---|---|
| 1 | 2a/b | 3 | 4 | 4S | |||||||||
| Low | 7/22 | M5/F2 | Median: 2 Range: 0–68 | 2/7 | 4/7 | 0/7 | 0/7 | 1/7 | 1/7 | 2/7 | 0/7 | 5/7 | 1/7 |
| Medium | 9/22 | M7/F2 | Median: 7 Range: 0–12 | 0/9 | 0/9 | 8/9 | 1/9 | 0/9 | 1/9 | 1/9 | 0/9 | 8/9 | 1/9 |
| High | 6/22 | M3/F3 | Median: 112 Range: 13–267 | 0/6 | 0/6 | 1/6 | 5/6 | 0/6 | 5/6 | 2/6 | 2/6 | 2/6 | 3/6 |
COG, Children's Oncology Group; INSS, International Neuroblastoma Staging System; M: male; F: female; Me: metastatic; St: stable; Pr: progressing; Re: remission; De: deceased.
Fig. 8.
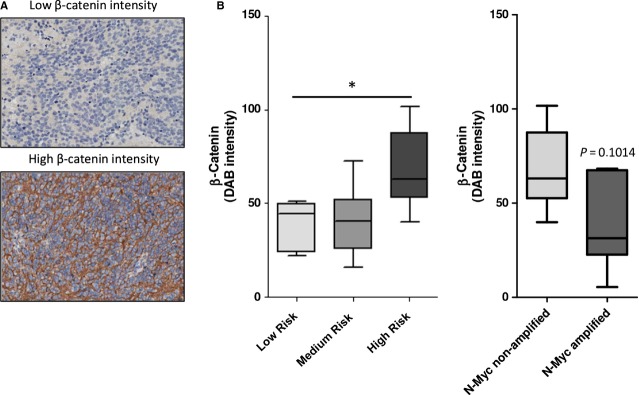
β-Catenin expression is increased in high-risk neuroblastoma tumours without amplification of MYCN. (A) Characteristics of study population. For this study, we focused on tumours that have no MYCN amplification. (B) Representative IHC pictures of low and high β-catenin expression. (C) Quantification of average β-catenin intensity in tumours without amplification of MYCN. Boxes represent Q1, median (Q2) and Q3. Whiskers represent minimum and maximum. *P < 0.05 (Kruskal–Wallis).
Discussion
The development of neural crest-derived tissues is under tight control of molecular mechanisms that regulate proliferation, differentiation and programmed cell death. When these core molecular pathways become deregulated, malignancies such as neuroblastoma can develop. The most extensively defined factor contributing to neuroblastoma pathogenesis is amplification of the Myc oncoprotein family member MYCN. Amplification of MYCN is only observed in about one-fourth of neuroblastomas [1,3]. In this study, we focused on the contribution of PGE2 and β-catenin to progression of neuroblastomas without MYCN amplification. Our findings in MYCN non-amplified neuroblastoma cell lines show that PGE2 enhances cell viability through the EP4 receptor, whereas this was attenuated by inhibition of PGE2 with specific COX-2 inhibitors. Elevating cAMP using forskolin mimicked the effects of PGE2 on cell viability. PGE2 and cAMP promoted GSK3β inhibition, phosphorylation of β-catenin at the PKA target residue ser675, β-catenin nuclear translocation and TCF-dependent gene transcription. Furthermore, we show that expression of a degradation-resistant β-catenin mutant enhances neuroblastoma cell viability and that inhibition of β-catenin with XAV939 prevents PGE2-induced viability. β-Catenin expression in tumour sections was increased in high-risk neuroblastoma without MYCN amplification compared to expression in low- or medium-risk sections. These data suggest that autocrine PGE2 enhances neuroblastoma cell viability via a mechanism involving cAMP-mediated β-catenin stabilization, and suggest that this pathway is of relevance to high-risk neuroblastoma without MYCN amplification.
Increased PGE2 levels and concomitant up-regulation of COX-2 are frequently observed in malignant tissues of epithelial origin [5,40]. Studies have revealed that inhibition of COX enzymes have potential in anticancer therapy [40]. Regarding neuroblastoma, studies indicate that COX-2 and PGE2 are involved in progression of neuroblastoma [4,5], although it is largely unknown which downstream molecular pathways are involved. PGE2 functions by binding to its membrane bound E-type prostanoid receptors which are all expressed in neuroblastoma cells. Of the four receptor subtypes, EP2 and EP4 are Gαs-coupled and stimulate adenylyl cyclase activation and thus intracellular cAMP levels [41]. Indeed, we found that PGE2 incubation elevated cellular cAMP levels in neuroblastoma. Conversely, inhibiting endogenous PGE2 synthesis with COX-2 inhibitors decreased cAMP levels. The rise in cAMP levels, either through receptor-mediated adenylyl cyclase activation by PGE2 or via direct activation of adenylyl cyclase by forskolin, increased cell viability of neuroblastoma cells. Further, we demonstrate that enhancement of cell viability by PGE2 is mediated through the EP4 receptor as antagonism of the EP4 receptor using L-161,982 completely abolished the enhancement of cell viability by PGE2, whereas antagonism of the EP2 receptor using AH6809 did not affect this. In earlier studies, Rasmuson et al. demonstrated that exogenous PGE2 enhanced viability of MYCN-amplified SK-N-BE(2) neuroblastoma cells, suggesting that PGE2 is involved in neuroblastoma cell viability independent of amplification of MYCN [4].
Inhibition of COX enzymes has been shown to inhibit neuroblastoma cell survival in vitro [7,42] and to inhibit tumour growth in vivo [5]. Indeed, COX-2 inhibitors attenuated cell viability in neuroblastoma cells. In other studies, inhibition of COX-2 by celecoxib or diclofenac changed mitochondrial membrane potential and subsequent activation of caspase-9- and caspase-3-dependent apoptosis [7,43], while no activation of caspase-8 or BID cleavage were observed, suggesting involvement of the intrinsic apoptotic pathway. In this study, we observed altered mitochondrial membrane potential after treatment with COX-2 inhibitors. In addition, we found that COX-2 inhibition induces apoptosis in neuroblastoma cells. Furthermore, we observed attenuated cell cycle progression after COX-2 inhibition resulting from a cell cycle block between G1 and S-phase. This cell cycle block was further confirmed by decreased expression of cell cycle regulatory protein cyclin D1. Although it seems evident that the effects of COX-2 inhibition are mediated by decreased PGE2 production, there are several reports that indicate that accumulation of arachidonic acid, the precursor for PGE2 synthesis, is also involved. For instance, combined treatment with arachidonic acid and COX inhibitors results in a synergistic effect on cell survival [44]. However in this study, we show that COX-2 inhibition with niflumic acid or celecoxib complemented with exogenous PGE2, rescues neuroblastoma cells from decreased viability as a result of COX-2 inhibition. This is also reflected on intracellular cAMP levels, which are decreased by niflumic acid, but restored by simultaneous addition of exogenous PGE2.
Of particular interest are emerging research lines that focus on molecular interactions between PGE2 and β-catenin. In 2002, Fujino et al. showed that PGE2 stimulates TCF/Lef promoter activity through EP2 and EP4 receptor signalling [33]. Downstream of EP2 and EP4, an increase in cAMP levels activates PKA. Phosphorylation of GSK3β at ser9 by PKA inhibits its kinase activity and thereby enhances β-catenin stability, nuclear translocation and TCF/Lef-dependent gene transcription [23,32,33]. It was, however, unknown if this molecular interaction occurs in neuroblastoma. Stimulation of neuroblastoma cells with forskolin or PGE2 increased p-GSK3β (ser9) and elevated levels of unphosphorylated β-catenin at the GSK3β residues. In addition, we found increased nuclear localization of active β-catenin. These findings are in agreement with studies in different malignant cell models. In non-small cell lung cancer and colorectal cancer, PGE2 enhances β-catenin nuclear localization and inhibits GSK3β by phosphorylation which is dependent on cAMP and kinase activity of PKA [34,36]. Apart from inhibiting GSK3β, PKA has been shown to directly activate β-catenin by phosphorylation at residue ser675 [24,37,38]. Indeed, we observed increased p-β-catenin (ser675) in response to PGE2 or forskolin. Subsequently, we observed a transient increase in p-β-catenin (ser675) at the (peri)nuclear regions. Importantly, we also found increased TCF-dependent gene transcription, which confirms earlier studies in HEK cells in which PKA-dependent p-β-catenin (ser675) resulted in increased TCF luciferase activity [24,37]. More recently, increased TCF-dependent gene transcription downstream of PGE2 and subsequent PKA activity was found in in vitro and in vivo models for colorectal cancer [23,34]. Conversely, inhibition of PGE2 synthesis using the COX-2 inhibitor celecoxib has been found to attenuate β-catenin stability, nuclear translocation and TCF luciferase activity in colorectal cancer [34,35], non-small cell lung cancer [36], and osteosarcoma [45], with concomitant lower expression of cyclin D1 and cell survival.
The contribution of β-catenin and TCF-dependent gene transcription in colorectal carcinoma has been well-established. In neuroblastoma, it has been shown that β-catenin expression is increased in MYCN non-amplified neuroblastoma cell lines [16]. The result of β-catenin transcriptional activity is expression of mitogenic and survival genes. In this study, we demonstrate increased TCF-dependent gene transcription and enhanced cellular viability in neuroblastoma cells transfected with a β-catenin mutant that is untargetable for proteasomal degradation (β-cateninS33Y). Importantly, the enhanced cell viability resulting from PGE2 was completely prevented by the tankyrase inhibitor XAV939. XAV939 prevents tankyrase-mediated degradation of axin2, thereby stabilizing axin2 which is the concentration-limiting component of the destruction complex that sequesters β-catenin and GSK3β. Thereby, XAV939 functions as an inhibitor of β-catenin activity [39]. Thus, β-catenin is, at least to some extent, responsible for PGE2-induced enhanced cellular viability. Recently, XAV939 has been shown to decrease neuroblastoma cell survival by inhibiting β-catenin transcriptional activity and decreasing expression of cyclin D1 in both MYCN-amplified and non-amplified cell lines [46]. Moreover, knockdown of β-catenin using RNA interference has been shown to inhibit cell cycle progression and induce apoptosis in neuroblastoma cells [47]. This, together with our data indicates that β-catenin plays a crucial role in neuroblastoma cell survival.
Interestingly, investigation of β-catenin expression in neuroblastoma tumour sections without MYCN amplification revealed particularly high expression in high-risk tumours. This further strengthens our hypothesis that β-catenin plays an important role in neuroblastoma, not only in vitro cell models but also in a clinically more relevant context. Other recent studies have also found increased expression of β-catenin in neuroblastoma, which was involved in maintaining a neuroblast-like phenotype of neuroblastoma cells and conferring resistance to chemotherapeutic agents [48,49]. However, these studies did not distinguish between MYCN-amplified and non-amplified tumours. We are aware that based on our study, we cannot draw strong conclusions on the functional role of increased β-catenin in high-risk neuroblastoma tumours as expression of β-catenin was found predominantly at the cell periphery and the neuropil, where it exerts a different function than in the nucleus. However, during epithelial–mesenchymal transition, which is an early step in the metastatic cascade in cancer [50], β-catenin is liberated from the junctional complexes where it is sequestered. In such an event in the presence of a β-catenin stabilizing stimulus such as PGE2, β-catenin translocates to the nucleus and activates TCF/Lef-dependent transcriptional programmes, thereby enhancing survival and metastatic potential [51].
The promising therapeutic potential of COX-2 inhibitors has resulted in multiple compounds that have reached the clinical market. These compounds were, however, rejected as a consequence of concerns regarding drug safety [40]. Recent insight in the systemic effects of COX-2 inhibition and its metabolites, questions the notion that the safety issues are the result of COX-2 inhibition and not COX-1 [52,53]. We believe that with better insights in the molecular events that occur downstream of COX inhibition, more specific chemopreventive compounds might be developed that exploit the therapeutic potential of specific COX-2 inhibition, but circumvent the safety issues.
Taken together, our results demonstrate that PGE2 is an important factor being involved in the regulation of neuroblastoma cell viability. cAMP activates PKA and thereby stabilizes β-catenin either directly or indirectly by inhibiting GSK3β, resulting in increased β-catenin activity and neuroblastoma cell viability. The increased expression of β-catenin in high-risk neuroblastoma, without MYCN amplification, suggests that β-catenin could play a major role in neuroblastoma. Thus, strategies that target either PGE2 production by the tumour (COX-2 inhibitors) or target the interaction between PGE2 and β-catenin warrant further investigation.
Acknowledgments
This study was financially supported by GUIDE and the Van der Meer-Boerema Stichting. Prof. Ed Schuuring contributed to in situ hybridization for MYCN. IH and EF contributed to data collection. CE performed the cAMP assay. WT contributed to collection of tumour tissue and analysis of IHC. RH performed IHC. RG, EdB and MS contributed to research design. SJ contributed to research design, data collection and analysis and wrote the manuscript. All authors have contributed to, read and approved the final manuscript.
Conflicts of interest
The authors declare that they have no competing interests.
References
- 1.Maris JM. Recent advances in neuroblastoma. N Engl J Med. 2010;362:2202–11. doi: 10.1056/NEJMra0804577. [DOI] [PMC free article] [PubMed] [Google Scholar]
- 2.Buechner J, Einvik C. N-myc and noncoding RNAs in neuroblastoma. Mol Cancer Res. 2012;10:1243–53. doi: 10.1158/1541-7786.MCR-12-0244. [DOI] [PubMed] [Google Scholar]
- 3.Huang M, Weiss WA. Neuroblastoma and MYCN. Cold Spring Harb Perspect Med. 2013;3:a014415. doi: 10.1101/cshperspect.a014415. [DOI] [PMC free article] [PubMed] [Google Scholar]
- 4.Rasmuson A, Kock A, Fuskevag OM, et al. Autocrine prostaglandin E2 signaling promotes tumor cell survival and proliferation in childhood neuroblastoma. PLoS ONE. 2012;7:e29331. doi: 10.1371/journal.pone.0029331. [DOI] [PMC free article] [PubMed] [Google Scholar]
- 5.Johnsen JI, Lindskog M, Ponthan F, et al. Cyclooxygenase-2 is expressed in neuroblastoma, and nonsteroidal anti-inflammatory drugs induce apoptosis and inhibit tumor growth in vivo. Cancer Res. 2004;64:7210–5. doi: 10.1158/0008-5472.CAN-04-1795. [DOI] [PubMed] [Google Scholar]
- 6.Bell E, Ponthan F, Whitworth C, et al. Cell survival signalling through PPARdelta and arachidonic acid metabolites in neuroblastoma. PLoS ONE. 2013;8:e68859. doi: 10.1371/journal.pone.0068859. [DOI] [PMC free article] [PubMed] [Google Scholar]
- 7.Johnsen JI, Lindskog M, Ponthan F, et al. NSAIDs in neuroblastoma therapy. Cancer Lett. 2005;228:195–201. doi: 10.1016/j.canlet.2005.01.058. [DOI] [PubMed] [Google Scholar]
- 8.Kaneko M, Kaneko S, Suzuki K. Prolonged low-dose administration of the cyclooxygenase-2 inhibitor celecoxib enhances the antitumor activity of irinotecan against neuroblastoma xenografts. Cancer Sci. 2009;100:2193–201. doi: 10.1111/j.1349-7006.2009.01280.x. [DOI] [PMC free article] [PubMed] [Google Scholar]
- 9.Parashar B, Shafit-Zagardo B. Inhibition of human neuroblastoma in SCID mice by low-dose of selective Cox-2 inhibitor nimesulide. J Neurooncol. 2006;78:129–34. doi: 10.1007/s11060-005-9079-8. [DOI] [PubMed] [Google Scholar]
- 10.Li M, Wang X, Meintzer MK, et al. Cyclic AMP promotes neuronal survival by phosphorylation of glycogen synthase kinase 3beta. Mol Cell Biol. 2000;20:9356–63. doi: 10.1128/mcb.20.24.9356-9363.2000. [DOI] [PMC free article] [PubMed] [Google Scholar]
- 11.Schmidt M, Dekker FJ, Maarsingh H. Exchange protein directly activated by cAMP (epac): a multidomain cAMP mediator in the regulation of diverse biological functions. Pharmacol Rev. 2013;65:670–709. doi: 10.1124/pr.110.003707. [DOI] [PubMed] [Google Scholar]
- 12.Koesters R, von Knebel Doeberitz M. The Wnt signaling pathway in solid childhood tumors. Cancer Lett. 2003;198:123–38. doi: 10.1016/s0304-3835(03)00367-7. [DOI] [PubMed] [Google Scholar]
- 13.Lee HY, Kleber M, Hari L, et al. Instructive role of Wnt/beta-catenin in sensory fate specification in neural crest stem cells. Science. 2004;303:1020–3. doi: 10.1126/science.1091611. [DOI] [PubMed] [Google Scholar]
- 14.Reya T, Clevers H. Wnt signalling in stem cells and cancer. Nature. 2005;434:843–50. doi: 10.1038/nature03319. [DOI] [PubMed] [Google Scholar]
- 15.Kuwahara A, Hirabayashi Y, Knoepfler PS, et al. Wnt signaling and its downstream target N-myc regulate basal progenitors in the developing neocortex. Development. 2010;137:1035–44. doi: 10.1242/dev.046417. [DOI] [PubMed] [Google Scholar]
- 16.Liu X, Mazanek P, Dam V, et al. Deregulated Wnt/beta-catenin program in high-risk neuroblastomas without MYCN amplification. Oncogene. 2008;27:1478–88. doi: 10.1038/sj.onc.1210769. [DOI] [PubMed] [Google Scholar]
- 17.Behrens J, Jerchow BA, Wurtele M, et al. Functional interaction of an axin homolog, conductin, with beta-catenin, APC, and GSK3beta. Science. 1998;280:596–9. doi: 10.1126/science.280.5363.596. [DOI] [PubMed] [Google Scholar]
- 18.Hart MJ, de los Santos R, Albert IN, et al. Downregulation of beta-catenin by human Axin and its association with the APC tumor suppressor, beta-catenin and GSK3 beta. Curr Biol. 1998;8:573–81. doi: 10.1016/s0960-9822(98)70226-x. [DOI] [PubMed] [Google Scholar]
- 19.Kishida M, Koyama S, Kishida S, et al. Axin prevents Wnt-3a-induced accumulation of beta-catenin. Oncogene. 1999;18:979–85. doi: 10.1038/sj.onc.1202388. [DOI] [PubMed] [Google Scholar]
- 20.He TC, Sparks AB, Rago C, et al. Identification of c-MYC as a target of the APC pathway. Science. 1998;281:1509–12. doi: 10.1126/science.281.5382.1509. [DOI] [PubMed] [Google Scholar]
- 21.Tetsu O, McCormick F. Beta-catenin regulates expression of cyclin D1 in colon carcinoma cells. Nature. 1999;398:422–6. doi: 10.1038/18884. [DOI] [PubMed] [Google Scholar]
- 22.Castellone MD, Teramoto H, Williams BO, et al. Prostaglandin E2 promotes colon cancer cell growth through a Gs-axin-beta-catenin signaling axis. Science. 2005;310:1504–10. doi: 10.1126/science.1116221. [DOI] [PubMed] [Google Scholar]
- 23.Brudvik KW, Paulsen JE, Aandahl EM, et al. Protein kinase A antagonist inhibits beta-catenin nuclear translocation, c-Myc and COX-2 expression and tumor promotion in Apc(Min/+) mice. Mol Cancer. 2011;10:149. doi: 10.1186/1476-4598-10-149. [DOI] [PMC free article] [PubMed] [Google Scholar]
- 24.Hino S, Tanji C, Nakayama KI, et al. Phosphorylation of beta-catenin by cyclic AMP-dependent protein kinase stabilizes beta-catenin through inhibition of its ubiquitination. Mol Cell Biol. 2005;25:9063–72. doi: 10.1128/MCB.25.20.9063-9072.2005. [DOI] [PMC free article] [PubMed] [Google Scholar]
- 25.Fang X, Yu SX, Lu Y, et al. Phosphorylation and inactivation of glycogen synthase kinase 3 by protein kinase A. Proc Natl Acad Sci USA. 2000;97:11960–5. doi: 10.1073/pnas.220413597. [DOI] [PMC free article] [PubMed] [Google Scholar]
- 26.Tanji C, Yamamoto H, Yorioka N, et al. A-kinase anchoring protein AKAP220 binds to glycogen synthase kinase-3beta (GSK-3beta) and mediates protein kinase A-dependent inhibition of GSK-3beta. J Biol Chem. 2002;277:36955–61. doi: 10.1074/jbc.M206210200. [DOI] [PubMed] [Google Scholar]
- 27.Gkoumassi E, Dekkers BG, Droge MJ, et al. Virodhamine and CP55,940 modulate cAMP production and IL-8 release in human bronchial epithelial cells. Br J Pharmacol. 2007;151:1041–8. doi: 10.1038/sj.bjp.0707320. [DOI] [PMC free article] [PubMed] [Google Scholar]
- 28.Sipma H, van der Zee L, van den Akker J, et al. The effect of the PKC inhibitor GF109203X on the release of Ca2+ from internal stores and Ca2+ entry in DDT1 MF-2 cells. Br J Pharmacol. 1996;119:730–6. doi: 10.1111/j.1476-5381.1996.tb15733.x. [DOI] [PMC free article] [PubMed] [Google Scholar]
- 29.Vandesompele J, De Preter K, Pattyn F, et al. Accurate normalization of real-time quantitative RT-PCR data by geometric averaging of multiple internal control genes. Genome Biol. 2002;3:RESEARCH0034. doi: 10.1186/gb-2002-3-7-research0034. [DOI] [PMC free article] [PubMed] [Google Scholar]
- 30.Kolligs FT, Hu G, Dang CV, et al. Neoplastic transformation of RK3E by mutant beta-catenin requires deregulation of Tcf/Lef transcription but not activation of c-myc expression. Mol Cell Biol. 1999;19:5696–706. doi: 10.1128/mcb.19.8.5696. [DOI] [PMC free article] [PubMed] [Google Scholar]
- 31.Greenhough A, Smartt HJ, Moore AE, et al. The COX-2/PGE2 pathway: key roles in the hallmarks of cancer and adaptation to the tumour microenvironment. Carcinogenesis. 2009;30:377–86. doi: 10.1093/carcin/bgp014. [DOI] [PubMed] [Google Scholar]
- 32.Clevers H, Nusse R. Wnt/beta-catenin signaling and disease. Cell. 2012;149:1192–205. doi: 10.1016/j.cell.2012.05.012. [DOI] [PubMed] [Google Scholar]
- 33.Fujino H, West KA, Regan JW. Phosphorylation of glycogen synthase kinase-3 and stimulation of T-cell factor signaling following activation of EP2 and EP4 prostanoid receptors by prostaglandin E2. J Biol Chem. 2002;277:2614–9. doi: 10.1074/jbc.M109440200. [DOI] [PubMed] [Google Scholar]
- 34.Shao J, Jung C, Liu C, et al. Prostaglandin E2 Stimulates the beta-catenin/T cell factor-dependent transcription in colon cancer. J Biol Chem. 2005;280:26565–72. doi: 10.1074/jbc.M413056200. [DOI] [PubMed] [Google Scholar]
- 35.Tuynman JB, Vermeulen L, Boon EM, et al. Cyclooxygenase-2 inhibition inhibits c-Met kinase activity and Wnt activity in colon cancer. Cancer Res. 2008;68:1213–20. doi: 10.1158/0008-5472.CAN-07-5172. [DOI] [PubMed] [Google Scholar]
- 36.Zhang S, Da L, Yang X, et al. Celecoxib potentially inhibits metastasis of lung cancer promoted by surgery in mice, via suppression of the PGE2-modulated beta-catenin pathway. Toxicol Lett. 2014;225:201–7. doi: 10.1016/j.toxlet.2013.12.014. [DOI] [PubMed] [Google Scholar]
- 37.Taurin S, Sandbo N, Qin Y, et al. Phosphorylation of beta-catenin by cyclic AMP-dependent protein kinase. J Biol Chem. 2006;281:9971–6. doi: 10.1074/jbc.M508778200. [DOI] [PubMed] [Google Scholar]
- 38.Spirli C, Locatelli L, Morell CM, et al. Protein kinase a-dependent pSer(675) -beta-catenin, a novel signaling defect in a mouse model of congenital hepatic fibrosis. Hepatology. 2013;58:1713–23. doi: 10.1002/hep.26554. [DOI] [PMC free article] [PubMed] [Google Scholar] [Retracted]
- 39.Huang SM, Mishina YM, Liu S, et al. Tankyrase inhibition stabilizes axin and antagonizes Wnt signalling. Nature. 2009;461:614–20. doi: 10.1038/nature08356. [DOI] [PubMed] [Google Scholar]
- 40.Vosooghi M, Amini M. The discovery and development of cyclooxygenase-2 inhibitors as potential anticancer therapies. Expert Opin Drug Discov. 2014;9:255–267. doi: 10.1517/17460441.2014.883377. [DOI] [PubMed] [Google Scholar]
- 41.Regan JW. EP2 and EP4 prostanoid receptor signaling. Life Sci. 2003;74:143–53. doi: 10.1016/j.lfs.2003.09.031. [DOI] [PubMed] [Google Scholar]
- 42.Ikegaki N, Hicks SL, Regan PL, et al. S(+)-ibuprofen destabilizes MYC/MYCN and AKT, increases p53 expression, and induces unfolded protein response and favorable phenotype in neuroblastoma cell lines. Int J Oncol. 2014;44:35–43. doi: 10.3892/ijo.2013.2148. [DOI] [PMC free article] [PubMed] [Google Scholar]
- 43.Jendrossek V, Handrick R, Belka C. Celecoxib activates a novel mitochondrial apoptosis signaling pathway. FASEB J. 2003;17:1547–9. doi: 10.1096/fj.02-0947fje. [DOI] [PubMed] [Google Scholar]
- 44.Chan TA, Morin PJ, Vogelstein B, et al. Mechanisms underlying nonsteroidal antiinflammatory drug-mediated apoptosis. Proc Natl Acad Sci USA. 1998;95:681–6. doi: 10.1073/pnas.95.2.681. [DOI] [PMC free article] [PubMed] [Google Scholar]
- 45.Xia JJ, Pei LB, Zhuang JP, et al. Celecoxib inhibits beta-catenin-dependent survival of the human osteosarcoma MG-63 cell line. J Int Med Res. 2010;38:1294–304. doi: 10.1177/147323001003800411. [DOI] [PubMed] [Google Scholar]
- 46.Tian XH, Hou WJ, Fang Y, et al. XAV939, a tankyrase 1 inhibitior, promotes cell apoptosis in neuroblastoma cell lines by inhibiting Wnt/beta-catenin signaling pathway. J Exp Clin Cancer Res. 2013;32:100. doi: 10.1186/1756-9966-32-100. 9966-32-100. [DOI] [PMC free article] [PubMed] [Google Scholar]
- 47.Yao W, Li K, Zheng S, et al. Knockdown of beta-catenin expression inhibits neuroblastoma cell growth in vitro and in vivo. J Pediatr Surg. 2013;48:2466–73. doi: 10.1016/j.jpedsurg.2013.08.024. [DOI] [PubMed] [Google Scholar]
- 48.Zhi F, Gong G, Xu Y, et al. Activated beta-catenin forces N2A cell-derived neurons back to tumor-like neuroblasts and positively correlates with a risk for human neuroblastoma. Int J Biol Sci. 2012;8:289–97. doi: 10.7150/ijbs.3520. [DOI] [PMC free article] [PubMed] [Google Scholar]
- 49.Vangipuram SD, Buck SA, Lyman WD. Wnt pathway activity confers chemoresistance to cancer stem-like cells in a neuroblastoma cell line. Tumour Biol. 2012;33:2173–83. doi: 10.1007/s13277-012-0478-0. [DOI] [PubMed] [Google Scholar]
- 50.Nozato M, Kaneko S, Nakagawara A, et al. Epithelial-mesenchymal transition-related gene expression as a new prognostic marker for neuroblastoma. Int J Oncol. 2013;42:134–40. doi: 10.3892/ijo.2012.1684. [DOI] [PMC free article] [PubMed] [Google Scholar]
- 51.Schmalhofer O, Brabletz S, Brabletz T. E-cadherin, beta-catenin, and ZEB1 in malignant progression of cancer. Cancer Metastasis Rev. 2009;28:151–66. doi: 10.1007/s10555-008-9179-y. [DOI] [PubMed] [Google Scholar]
- 52.Warner TD, Mitchell JA. Cyclooxygenases: new forms, new inhibitors, and lessons from the clinic. FASEB J. 2004;18:790–804. doi: 10.1096/fj.03-0645rev. [DOI] [PubMed] [Google Scholar]
- 53.Kirkby NS, Lundberg MH, Harrington LS, et al. Cyclooxygenase-1, not cyclooxygenase-2, is responsible for physiological production of prostacyclin in the cardiovascular system. Proc Natl Acad Sci USA. 2012;109:17597–602. doi: 10.1073/pnas.1209192109. [DOI] [PMC free article] [PubMed] [Google Scholar]