

Abstract
Importance: While “omics” studies have advanced our understanding of inflammatory skin diseases, metabolomics is mostly an unexplored field in dermatology.
Objective: We sought to elucidate the pathogenesis of psoriatic diseases by determining the differences in metabolomic profiles among psoriasis patients with or without psoriatic arthritis and healthy controls.
Design: We employed a global metabolomics approach to compare circulating metabolites from patients with psoriasis, psoriasis and psoriatic arthritis, and healthy controls.
Setting: Study participants were recruited from the general community and from the Psoriasis Clinic at the University of California Davis in United States.
Participants: We examined metabolomic profiles using blood serum samples from 30 patients age and gender matched into three groups: 10 patients with psoriasis, 10 patients with psoriasis and psoriatic arthritis and 10 control participants.
Main outcome(s) and measures(s): Metabolite levels were measured calculating the mean peak intensities from gas chromatography time-of-flight mass spectrometry.
Results: Multivariate analyses of metabolomics profiles revealed altered serum metabolites among the study population. Compared to control patients, psoriasis patients had a higher level of alpha ketoglutaric acid (Pso: 288 ± 88; Control: 209 ± 69; p=0.03), a lower level of asparagine (Pso: 5460 ± 980; Control: 7260 ± 2100; p=0.02), and a lower level of glutamine (Pso: 86000 ± 20000; Control: 111000 ± 27000; p=0.02). Compared to control patients, patients with psoriasis and psoriatic arthritis had increased levels of glucuronic acid (Pso + PsA: 638 ± 250; Control: 347 ± 61; p=0.001). Compared to patients with psoriasis alone, patients with both psoriasis and psoriatic arthritis had a decreased level of alpha ketoglutaric acid (Pso + PsA: 186 ± 80; Pso: 288 ± 88; p=0.02) and an increased level of lignoceric acid (Pso + PsA: 442 ± 280; Pso: 214 ± 64; p=0.02).
Conclusions and relevance: The metabolite differences help elucidate the pathogenesis of psoriasis and psoriatic arthritis and they may provide insights for therapeutic development.
Introduction
Psoriasis is a chronic, inflammatory skin disease associated with significant morbidity and mortality 1. Approximately one-third of psoriasis patients develop psoriatic arthritis 2, 3. The exact mechanisms underlying psoriasis remain under investigation. A complex interplay between genetic and environmental factors initiates a cascade of events that lead to activation of dendritic cells 4. The activated dendritic cells stimulate differentiation and migration of effector T cells (Th1 and Th17) to the skin. The subsequent release of inflammatory cytokines promotes further recruitment of immune cells, stimulates keratinocyte proliferation and sustains a state of chronic inflammation 4.
Genomics, proteomics, and transcriptomics research has substantially contributed to the growing body of knowledge concerning psoriasis etiology. For example, genome-wide transcriptional analysis and association studies have identified new susceptibility loci that implicate pathways in psoriasis pathogenesis which integrate epidermal barrier dysfunction with immune dysregulation 5– 7. A recent proteomic analysis of psoriatic skin tissue identified 36 up-regulated proteins associated with the regulation of cell death, defense response, inflammatory response, and reactive oxygen species 8. However, the data beyond genomics and proteomics at the metabolic level can provide new insights into the cellular processes involved in psoriasis.
Metabolomics, the most recent addition to the “omics” fields, is the comprehensive study of all low molecular mass metabolites in the metabolome of an organism under a given set of conditions 9. Examining the metabolic byproducts produced at the transcriptional and translational levels will yield clues to the cellular regulatory processes and underlying molecular networks. Because metabolites are the end products and the most downstream representation of cellular processes, the study of an organism’s metabolome is most reflective of any observable phenotype 9. Metabolomics analysis will enable researchers to gain valuable information regarding the physiology of a system by measuring the amplified output that results from genetic and environmental perturbations 10. To date, metabolomics has not yet been applied to investigate the systemic mechanisms underlying psoriasis.
Because psoriasis is a multifactorial disease at the genomic, protein, and cellular levels, it is important to examine the end products of cellular processes in psoriasis and psoriatic arthritis. In this novel study, we employed a global metabolomics approach using gas chromatography time-of-flight mass spectrometry (GC-TOF-MS) to compare the serum metabolic profiles of patients with psoriasis, patients with psoriasis and psoriatic arthritis, and healthy controls. We then summarized our results within the context of existing literature to generate hypotheses for future targeted analysis. Integrating genomics, proteomics, transcriptomics and metabolomics data from all levels will add to our understanding of the physiological processes underlying this complex disease and will provide potential insights into its associated comorbidities.
Methods
Study design
In this study, we examined the metabolite profiles of psoriasis patients with and without psoriatic arthritis and healthy controls using GC-TOF-MS. Blood serum samples were obtained from 30 patients: 10 patients with psoriasis, 10 patients with both psoriasis and psoriatic arthritis, and 10 healthy control participants. Patient demographics and treatments are summarized in Table 1. Plaque psoriasis is the most common subtype of psoriasis, and the diagnosis made by dermatologists based on characteristic red, scaly patches and plaques on characteristic locations. The Psoriasis Area and Severity Index (PASI) is a validated and widely used outcomes instrument in clinical trials that measures psoriasis severity. Psoriatic arthritis is an inflammatory arthritis that typically affects the peripheral joints but can also have axial manifestations, enthethitis, and dactylitis. In approximately 70–80% of patients with psoriatic arthritis, psoriasis precedes the development of joint symptoms. This study was approved by the Institutional Review Board at University of California, Davis (Protocol 254745-11). The Declaration of Helsinki was followed and the study participants provided their written, informed consent.
Table 1. Patient demographics.
This table describes demographics and clinical information on the patient cohort that contributed their samples to this metabolomics study. Patient demographics indicated for patients with psoriasis (Pso), and patients with psoriasis and psoriatic Arthritis (PsA): age, sex, Body Mass Index (BMI), Psoriasis Area and Severity Index (PASI), duration of condition (in years), and current treatment(s). Demographics of age and sex for control patients are also indicated.
| Psoriasis patients | Psoriasis and PsA patients | Control
patients |
|||||||||||
|---|---|---|---|---|---|---|---|---|---|---|---|---|---|
| Age | Sex | BMI | PASI | Duration
Pso (yrs) |
Current treatment(s) | Age | Sex | BMI | PASI | Duration
Pso/PsA (yrs) |
Current treatment(s) | Age | Sex |
| 60s | M | 22.0 | 23.5 | 44 | Acitretin 25mg qd,
calcipotriene/ betamethasone dipropionate as needed, fluocinolone cream as needed |
60s | M | 31.3 | 7.2 | Pso: 22
PsA: 22 |
Adalimumab 40mg
every other week, clobetasol ointment 0.05% as needed, calcitriol as needed |
60s | M |
| 30s | M | 25.8 | 14.8 | 11 | Ustekinumab 45mg
every 12 weeks, clobetasol cream 0.05% as needed |
30s | M | 37.1 | 21.4 | Pso: 15
PsA: 12 |
Adalimumab 40mg
every week, methotrexate 10mg weekly, calcipotriene as needed, fluocinonide cream as needed |
30s | M |
| 20s | F | 28.8 | 12.2 | 13 | Betamethasone
diproprionate/ calcipotriene combination every day |
40s | F | 28.3 | 16.2 | Pso: 1
PsA: 1 |
NSAIDs, Clobetasol
ointment twice daily, triamcinolone as needed to the intertriginous areas |
20s | F |
| 30s | M | 43.6 | 9.6 | 21 | Triamcinolone 0.1%
cream twice daily |
20s | M | 34.9 | 6.9 | Pso: 4
PsA: 4 |
Adalimumab 40mg
every other week, clobetasol cream 0.05% as needed, calcipotriene twice daily, hydrocortisone 2.5% cream as needed |
30s | M |
| 50s | M | 28.4 | 9.6 | 17 | Clobetasol ointment
0.05% daily, calcipotriene daily, etanercept 50mg every week |
50s | M | 26.3 | 2.6 | Pso: 43
PsA: unknown |
Methotrexate 15mg
weekly, clobetasol cream 0.05% as needed, phototherapy (UVB) twice weekly |
50s | M |
| 40s | M | 34.5 | 8 | 12 | Clobetasol 0.05%
cream as needed, calcipotriene as needed |
40s | M | 28.0 | 22.5 | Pso: 35
PsA: 2 |
Etancercept 50mg
weekly, betamethasone dipropionate cream as needed, coal tar as needed |
50s | M |
| 50s | F | 23.0 | 6 | 45 | triamcinolone cream
0.5% twice daily |
50s | F | 29.2 | 6.8 | Pso: 11
PsA: 9 |
Etanercept 50mg every
week, clobetasol ointment 0.05% as needed |
60s | F |
| 50s | F | 28.3 | 5.2 | 4 | Adalimumab 40mg
every other week, halobetasol cream 0.05% as needed |
50s | F | 28.3 | 27.5 | Pso: 6
PsA: 5 |
NSAIDs, methotrexate
12.5mg every week, clobetasol ointment 0.05% as needed, calcipotriene as needed |
50s | F |
| 40s | F | 22.1 | 4.4 | 9 | Clobetasol cream
0.05% as needed |
40s | F | 29.3 | 11.9 | Unknown | NSAIDs as needed | 40s | F |
| 60s | F | 32.6 | 3.2 | 7 | Etanercept 50mg every
week, clobetasol, calcipotriene/ betamethasone dipropionate as needed |
70s | F | 32.2 | 9 | Unknown | NSAIDs as needed,
fluocinonide cream as needed |
70s | F |
Sample storage and preparation
Blood samples were collected from patients using a BD 5 ml double-gel serum separator tube. After 30 minutes of coagulation, the samples were immediately centrifuged at 2000 rpm for 15 minutes to complete blood fractionation 11. Thereafter, the sera were transferred to Eppendorf tubes, snap-frozen in liquid nitrogen for 60 s, and stored at -80°C until further processing.
GC-TOF
Samples were analyzed using a GC-TOF approach. The study design was entered into the MiniX database 12. A Gerstel MPS2 automatic liner exchange system (ALEX) was used to eliminate cross-contamination from sample matrix occurring between sample runs. 0.5 microliter of sample was injected at 50°C (ramped to 250°C) in splitless mode with a 25 sec splitless time. An Agilent 6890 gas chromatograph (Santa Clara, CA) was used with a 30 m long, 0.25 mm i.d. Rtx5Sil-MS column with 0.25 µm 5% diphenyl film; an additional 10 m integrated guard column was used (Restek, Bellefonte PA) 13– 15. Chromatography was performed at a constant flow of 1 ml/min, ramping the oven temperature from 50°C for to 330°C over 22 min. Mass spectrometry used a Leco Pegasus IV time of flight mass (TOF) spectrometer with 280°C transfer line temperature, electron ionization at −70 V and an ion source temperature of 250°C. Mass spectra were acquired from m/z 85–500 at 17 spectra/sec and 1750 V detector voltage.
Result files were exported to our servers and further processed by our metabolomics BinBase database. All database entries in BinBase were matched against the Fiehn mass spectral library of 1,200 authentic metabolite spectra using retention index and mass spectrum information or the NIST11 commercial library. Identified metabolites were reported if present in at least 50% of the samples per study design group (as defined in the MiniX database); output results were exported to the BinBase database and filtered by multiple parameters to exclude noisy or inconsistent peaks 15. Quantification was reported as peak height using the unique ion as default. Missing values were replaced using the raw data netCDF files from the quantification ion traces at the target retention times, subtracting local background noise 12. Sample-wise metabolite intensities were normalized by the total signal for all annotated analytes. Daily quality controls and standard plasma obtained from NIST were used to monitor instrument performance over the length of the data acquisition.
Data analysis
Statistical analysis was implemented on log2 transformed metabolite values in R 16. The significance levels (i.e. p-values) were adjusted for multiple hypothesis testing according to Benjamini and Hochberg 17 at a false discovery rate (FDR) of 5%.
Orthogonal signal correction partial least squares discriminant analysis (O-PLS-DA) 18 was carried in out in R 16 using the Devium package ( https://github.com/dgrapov/devium).
A biochemical and chemical similarity network 19 was developed for all measured metabolites with KEGG 20 and PubChem CIDs 21 identifiers. Enzymatic interactions were determined based on product-precursor relationships defined in the KEGG RPAIR database. Molecules not directly participating in biochemical transformations, but sharing many structural properties, based on PubChem Substructure Fingerprints 22, were connected at a threshold of Tanimoto similarity ≥ 0.7.
Results
Psoriasis patients compared to control participants
Analysis of the human sera samples using GC-TOF-MS yielded 144 known metabolic structures and a total of 354 molecular features ( Dataset). When comparing the metabolite profiles of psoriasis patients and control patients, the key differences that reached univariate significance were characterized by an increase in alpha ketoglutaric acid (mean peak intensity ± std dev: Pso: 288±88; Control: 209±69; p=0.03), and decreases in asparagine (mean peak intensity ± std dev: Pso: 5460±980; Control: 7260±2100; p=0.02), glutamine (mean peak intensity ± std dev: Pso: 86000±20000; Control: 111000±27000; p=0.02), and beta-sitosterol (mean peak intensity ± std dev: Pso: 217±100; Control: 315±130; p=0.04) in psoriasis patients compared to control patients ( Figure 1, Dataset). OPLS-DA showed that all models performed significantly better (Q 2=0.42±0.1; RMSEP=0.37±0.1) than what is expected based on random chance (permuted: Q 2=-0.51±0.7; RMSEP=0.68±0.1).
Figure 1. Biochemical similarity network analysis for metabolite differences in controls and psoriasis patients.
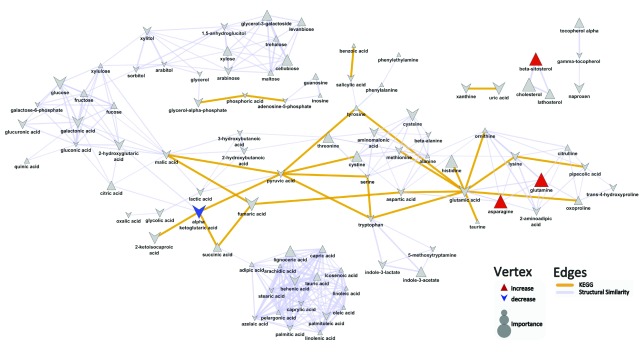
Biochemical and chemical similarity networks were used to map statistical and multivariate modeling results within a biological context. The vertices represent metabolites which are connected by edges based on biochemical relationships (yellow, KEGG) and chemical similarities (lavender, structural similarity). Vertex size represents the metabolite's importance and the color represents the direction of statistically significant changes (blue, decrease; red, increase; gray, insignificant p>0.05).
Patients with psoriasis and psoriatic arthritis compared to patients with psoriasis
Upon comparing the metabolite profiles of patients with both psoriasis and psoriatic arthritis to patients with skin-limited psoriasis, the top metabolite differences were characterized by a decrease in alpha ketoglutaric acid (mean peak intensity ± std dev: Pso+PsA: 186±80; Pso: 288±88; p=0.02), and increases in arabinose (mean peak intensity ± std dev: Pso+PsA: 624±460; Pso: 363±90; p=0.04), lignoceric acid (mean peak intensity ± std dev: Pso+PsA: 442±280; Pso: 214±64; p=0.02), phosphoric acid (mean peak intensity ± std dev: Pso+PsA: 20600±4300; Pso: 17100±3300; p=0.05), and glycerol-3-galactoside (mean peak intensity ± std dev: Pso: 193±140; Pso+PsA: 367±190; p=0.02) in psoriasis patients with concomitant psoriatic arthritis compared to patients with psoriasis alone ( Figure 2, Dataset). The OPLS-DA results suggest that the developed model did not perform significantly better (Q 2=0.66±0.2; RMSEP=0.54±0.1) than what is expected based on random chance (permuted: Q 2=0.47±0.3; RMSEP=0.55±0.1).
Figure 2. Biochemical similarity network analysis for metabolite differences between psoriasis patients with and without arthritis.
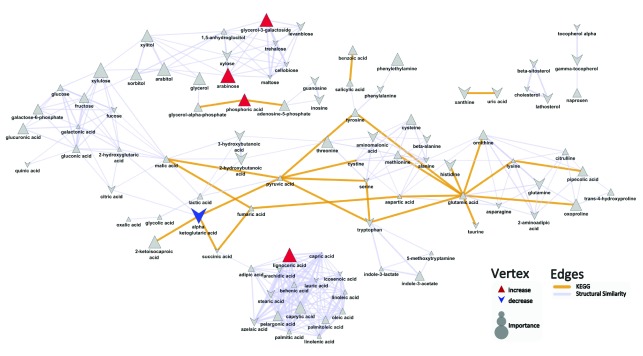
Biochemical and chemical similarity networks were used to map statistical and multivariate modeling results within a biological context. The vertices represent metabolites which are connected by edges based on biochemical relationships (yellow, KEGG) and chemical similarities (lavender, structural similarity). Vertex size represents the metabolite's importance and the color represents the direction of statistically significant changes (blue, decrease; red, increase; gray, insignificant p>0.05)
Patients with psoriasis and psoriatic arthritis compared to control participants
Key metabolite differences between patients with both psoriasis and psoriatic arthritis and healthy controls are characterized by increases in phosphoric acid (mean peak intensity ± std dev: Pso+PsA: 20600±4300; Control: 16300±4000; p=0.02), glucuronic acid (mean peak intensity ± std dev: Pso+PsA: 638±250; Control: 347±61; p=0.001), arabitol (mean peak intensity ± std dev: Pso+PsA: 238±65; Control: 172±61; p=0.03), and arabinose (mean peak intensity ± std dev: Pso+PsA: 624±460; Control: 322±140; p=0.02) in patients with both psoriasis and psoriatic arthritis compared to healthy individuals ( Figure 3, Dataset). OPLS-DA analysis suggested that the developed model performed better (Q 2=0.86±0.1; RMSEP=0.50±0.05) than what is expected based on random chance (permuted: Q 2=0.48±0.4; RMSEP=0.55±0.1) and displays weak predictive performance.
Figure 3. Biochemical similarity network analysis for psoriasis patients with psoriatic arthritis compared to controls.
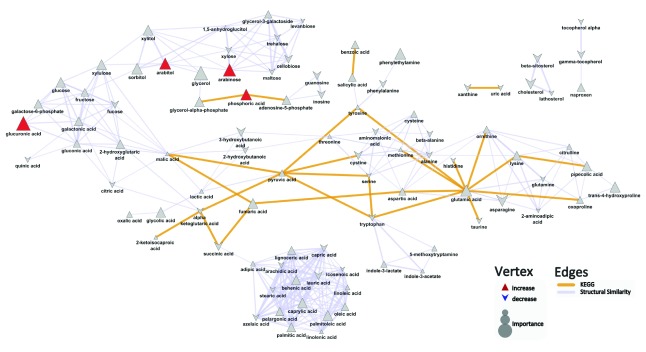
Biochemical and chemical similarity networks were used to map statistical and multivariate modeling results within a biological context. The vertices represent metabolites which are connected by edges based on biochemical relationships (yellow, KEGG) and chemical similarities (lavender, structural similarity). Vertex size represents the metabolite's importance and the color represents the direction of statistically significant changes (blue, decrease; red, increase; gray, insignificant p>0.05).
A detailed legend of the raw data for Figures 1–3 can be found in the text file provided.
Discussion
Psoriasis is widely recognized as a condition that is more than “skin deep”. The infiltration of inflammatory cells in psoriasis dermis and epidermis may be released into systemic circulation, contributing to chronic systemic inflammation 23. To our knowledge, this is the first study that employs a metabolomics approach to analyze human serum and examine metabolite changes in circulation beyond the skin. The spectral results indicated differences in low molecular weight compounds that may help distinguish psoriasis patients from healthy controls, psoriasis patients from patients with both psoriasis and psoriatic arthritis, and psoriasis patients with psoriatic arthritis from healthy controls. Although our metabolomics analysis detected a variety of altered metabolite levels, many of which warrant investigation, herein, we discuss the altered levels of the metabolites where the most relevant literature exists. We place our findings within the context of existing literature and explore their relationship to the immune-mediated and inflammatory nature of the disease.
Psoriasis patients compared to control participants
Glutamine. Glutamine, the most abundant free amino acid in the body, is essential for protein synthesis and cellular growth 24. In this study, GC-TOF-MS analysis revealed a decrease in glutamine levels in the sera of patients with psoriasis when compared to healthy controls. The alteration in glutamine levels may be due to higher rates of protein synthesis, glutamine consumption by immune cells, and/or differences in transglutaminase levels between patients with and without psoriasis.
Psoriasis is characterized by high rates of cellular proliferation, which increases the cellular demand of amino acids, notably glutamine, to accommodate for the higher rate of protein synthesis. This increased demand for glutamine is analogous to alterations of glutamine levels reported in patients with cancer, a condition also characterized by increased cellular proliferation 24, 25. In addition, psoriasis is also characterized by a dysregulated immune system whereby the amount and activity of immune cells are enhanced 4. The proliferation and functions of immune cells are highly dependent upon glutamine. High rates of glutamine consumption exhibited by lymphocytes, macrophages, and neutrophils have been reported in numerous studies in vitro 26, 27. Specifically, glutamine consumption enhances the production of many cytokines, and among them, tumor necrosis factor-α (TNF-α), interferon-γ (IFN-γ), interleukin-1β (IL-1β), and interleukin-6 (IL-6), all of which play an important role in psoriasis innate immunity.
Another possible explanation for the observed decrease in glutamine levels may be related to the up-regulation and increased expression of keratinocyte tranglutaminase in psoriatic lesions 28, 29. Keratinocyte transglutaminase is an enzyme critical for cornified envelope formation and participates in epidermal differentiation. Transglutaminase catalyzes the formation of the N-(γ-glutamyl)-lysine isopeptide bond using the amino acids glutamine and lysine. The inhibition of keratinocyte transglutaminase expression by retinoic acid may explain, in part, one of the beneficial effects of retinoid use to treat psoriasis.
Asparagine. Asparagine, a common non-essential amino acid, is the amide of aspartic acid and is easily hydrolyzed during the cell aging process 30, 31. The spectral results showed a decrease in asparagine levels in the serum of psoriasis patients, which may result from spontaneous asparagine deamidation, a process enhanced by an oxidative microenvironment. Chronic oxidative stress has been reported in patients with psoriasis 32. In asparagine deamidation, a spontaneous post-biosynthetic modification, the asparagine residue undergoes nucleophilic attack and forms a succinimide ring intermediate. The succinimidyl residue is an unstable five-membered ring that hydrolyzes to give a mixture of aspartyl and isoaspartyl forms 30. The resulting isoaspartate residue (isoAsp) is formed through a beta linkage as opposed to the normal alpha conformation, and is favored 3:1 over the normal conformation at physiological conditions 31. The presence of isoAsp residues in proteins has been shown to decrease protein function and can trigger autoimmune responses 31. However, a protein repair system that employs the enzyme L-isoAsp-(D-Asp)-O-methyltransferase (PIMT) has recently been identified. PIMT specifically targets the isoAsp residues and forms an unstable methyl ester (L-isoaspartyl methyl ester), which is rapidly converted back to the L-succinimidyl form. The L-succinimidyl residues are then hydrolyzed to the L-aspartyl form 30. This repair system prevents the accumulation of damaged proteins.
The observed decrease in asparagine is consistent with the findings from a study by D’Angelo et al. (2012), who examined the abnormal isoaspartyl residues in the erythrocyte membranes of psoriasis patients 33. D’Angelo et al. found that L-isoAsp content was highly increased in the red blood cells (RBC) membrane proteins of psoriatic patients. By measuring methyl esterification through an in situ protein methylation approach, the investigators found that protein methyl esterification was increased by 1.5 fold in psoriatic patients compared to controls. To determine whether these data are due either to an increase in deamidation rate or to an impaired repair system in patients with psoriasis, they measured the intracellular levels of S-adenosylmethionine (SAM) and S-adenosylhomocysteine (SAH). D’Angelo et al. found that the transmethylation potential (SAM/SAH) was comparable in patients and controls, indicating a normal repair system in psoriasis patients. Therefore, the increase in methyl esterification is more likely to be attributed to increased protein instability at asparagine sites, which is responsible for asparagine degradation and IsoAsp accumulation in psoriasis patients. Of note, isoAsp residues may confer immunogenicity to previously ignored self-antigens and need to be further explored given the immune-mediated nature of psoriasis 31.
Alpha ketoglutaric acid. Alpha ketoglutarate is an intermediate of the citric acid cycle involved in cellular metabolism. The increase in alpha ketoglutaric acid levels detected in serum of psoriasis patients may be due to enhanced alpha ketoglutarate synthesis. Alpha ketogluarate is synthesized from isocitrate through a process mediated by isocitrate dehydrogenase. Enzymatic assays from previous studies have reported significantly increased enzymatic activities of isocitrate dehydrogenase in psoriasis patients 34.
The increase in alpha ketoglutaric acid levels may be a contributing factor to the increase in cellular proliferation associated with psoriasis. Singh et al. (2013) and Vishnoi et al. (2013) found that the in vitro addition of alpha ketoglutarate greatly enhanced cellular proliferation rates, cell survival, and metabolic activity. Alpha ketoglutarate functions as a scavenger for removing toxic metabolites within cells, thereby enhancing cell viability. Additional studies support alpha ketoglutarate involvement in cellular proliferation through regulation of the mTOR-signaling pathway 35. mTOR, a protein kinase responsible for cell proliferation, cell survival, and protein synthesis, is phosphorylated by alpha ketoglutarate 35. Therefore, increased alpha ketoglutarate levels may also activate mTOR pathways and induce cellular hyperproliferation.
Altered alpha ketoglutaric acid levels may also play a role within the hyperactive immunogenic state of psoriasis, in which lymphocytes, macrophages, and neutrophils secrete the inflammatory cytokines TNF-α, IL-1, and IL-6. In cell cultures, alpha ketoglutarate appears to enhance macrophage cytotoxicity by significantly increasing TNF-α and nitric oxide release 36. Furthermore, TNF-α release from macrophages can activate collagen synthesis in dermal fibroblasts of psoriatic skin. Previous studies have observed that psoriasis is associated with increased collagen synthesis 37– 39. Collagen functions as an abundant connective tissue protein and provides structural integrity for the epidermis. During collagen synthesis, alpha ketoglutarate functions as a cofactor that activates Prolyl-4-Hydroxylase (P4H), an enzyme that mediates the post-translational modification of pre-procollagen peptides essential for formation of the collagen triple helix. Increased enzymatic activity of P4H enhances collagen synthesis in psoriatic lesions. Moreover, alpha ketoglutarate increases the available pool of proline residues required for collagen synthesis. Transamination of alpha ketoglutarate into glutamate, with subsequent conversion into proline, provides P4H with additional proline substrates to synthesize the hydroxyproline required in collagen formation 37. Taken together, higher concentrations of alpha ketoglutaric acid may contribute to the structural properties as well as the immune and inflammatory properties of psoriasis.
Patients with psoriasis and psoriatic arthritis compared to patients with psoriasis
Alpha ketoglutaric acid. As noted earlier, alpha ketoglutarate can act to facilitate collagen synthesis in psoriasis patients. Although psoriasis patients exhibit elevated alpha ketoglutarate levels compared to controls, patients diagnosed with psoriasis and psoriatic arthritis had lower serum alpha ketoglutarate levels. This may be the result of a higher inflammatory burden experienced by these patients. Inflammatory cytokines, particularly interleukins and TNF-α, are up-regulated in the synovial fluid of psoriatic arthritis patients, further enhancing inflammatory joint destruction and periarticular bone loss 40. Collagen functions as the primary structural component in cartilage, bones, and skin. Degradation of joint tissue in patients with psoriasis and psoriatic arthritis may significantly increase the demand for alpha ketoglutarate in an attempt to synthesize new collagen. This increased consumption may account for the decreased alpha ketoglutarate levels in patients with psoriasis and psoriatic arthritis.
Lignoceric acid. Lignoceric acid, a saturated very long-chain fatty acid (VLCA), is a minor fatty acid component found in human tissues and the bloodstream. In this study, serum lignoceric acid levels were elevated in patients with psoriasis with both skin and joint involvement when compared to patients with skin-limited psoriasis. The levels of saturated VLCFA in erythrocytes, specifically lignoceric acid, have been used to evaluate atherogenicity in patients with metabolic syndrome 41. Similarly, Matsumori et al. (2013) found higher levels of lignoceric acid in the erythrocytes of patients with metabolic syndrome when compared to healthy controls 41. This increase significantly correlated with specific atherogenic lipoprotein profiles and systemic inflammation in patients with metabolic syndrome 41. A metabolic syndrome is characterized partly by insulin resistance resulting from chronically elevated levels of plasma free fatty acids that, when released into liver and muscle tissue, inhibit insulin secretion 42. Epidemiologic studies have shown an increased prevalence of metabolic syndrome in patients with psoriatic arthritis compared to patients with psoriasis only 43. As such, the increase in lignoceric acid levels is consistent with the notion that psoriasis patients afflicted with concomitant psoriatic arthritis may experience a greater inflammatory burden than patients with skin involvement alone.
Patients with psoriasis and psoriatic arthritis compared to control participants
Glucuronic acid. Glucuronic acid is one of the main subunits that comprise the backbone of glycosaminoglycans (GAGs). In the present study, levels of glucuronic acid were increased in patients with psoriasis and psoriatic arthritis when compared to healthy controls, which corroborates the role of GAGs in relation to psoriasis. GAGs are complex, negatively-charged polysaccharides that bind with proteins to form proteoglycans. These structures are intimately involved in crucial components of cell signaling, cell adhesion and cell migration as they modulate the activity of the proteins that they bind 44. Of note, GAGs have been proposed to store as well as activate growth factors in the extracellular matrix and cell surface 44, 45. This suggests that GAGs potentially play a significant role in influencing cell proliferation, differentiation, tissue remodeling, and regulation of extracellular matrix composition 45– 49. The GAGs present in the extracellular matrix of these cells may induce keratinocyte hyperproliferation and decrease epidermal differentiation in psoriasis.
Studies have shown elevated levels of GAGs, specifically chondroitin sulfate and dermatan sulfate, in dermatologic and urine samples of patients with psoriasis. Chondroitin sulfate is a class of GAG that consists of a disaccharide backbone composed of alternating D-glucuronic acid and N-acetyl-D-galatosamine, whereas dermatan sulfate is synthesized from the epimerization of the glucuronic acid residues to iduronic acid at the polymer level 50. Using antibody staining against chondroitin sulfate, Smetsers et al. (2004) found that the chondroitin sulfate was primarily expressed in the papillary dermis and the basal keratinocytes in normal skin samples, whereas there was a more diffuse staining extending into the reticular dermis in psoriatic skin samples 51. In a study examining the localization of various GAGs on skin cells of normal and psoriatic skin, Saga et al. (1995) found that psoriatic epidermis exhibited increased chondroitin sulfate as well as dermatan sulfate, verified through digestion by enzymes specific to certain GAGs 52. The researchers also noted a higher concentration of chondroitin sulfate and dermatan sulfate from the stratum basale to the lower stratum spinosum in psoriasis patients compared to patients with normal skin 52. Moreover, Poulsen et al. (1983) reported that the concentration of GAGs increased by 28% and 62% in the dermal and urine samples, respectively, of psoriatic patients versus the healthy controls 53. In another study, Poulsen et al. (1982) noted that the excretion of dermatan sulfate doubled to 104% (p < 0.01) and the excretion of chondroitin sulfate increased by 62% (p < 0.02) in psoriasis patients versus controls 54. However, only the excretion of dermatan sulfate correlated with the fraction of body surface area involved in the psoriasis patients 54. It has been suggested that the increased urinary excretion of GAGs indicates greater catabolism 55.
In patients with psoriasis and psoriatic arthritis, chronic inflammation often leads to irreversible joint destruction 56. Hyaluronan is another class of GAG composed of a D-glucuronic acid and N-acetyl-D-galatosamine backbone 57. As a major component of the extracellular matrix in the articular cartilage, the joint destruction and degradation of hyaluronan into smaller oligosaccharides and its main components may account for the increase in glucuronic acid levels detected in our study. Although literature is scarce regarding the levels of hyaluronan in psoriatic arthritis, studies have reported an increase in serum hyaluronan in patients with rheumatoid arthritis when compared to healthy individuals 58– 61. Of note, hyaluronan has exhibited a diverse biological role with opposing dual functions in the inflammatory process 57. Fragments of hyaluronan have been reported to enhance the inflammatory and catabolic response through the modulation of Toll-like receptor 2 signaling pathways 62. While the suppression of hyaluronan synthesis alleviates inflammatory responses in some arthritic models, hyaluronan can act as an inflammatory activator as well as an inflammatory moderator 63, 64. Taken together, because glucuronic acid is a crucial backbone of GAGs, these results are consistent with our findings of elevated glucuronic acid in psoriatic serum samples.
In this study, a global metabolomics approach allowed an unbiased analysis of the entire pool of low molecular weight metabolites. The metabolomics data generated using this approach must be integrated with prior knowledge to identify specific metabolites for targeted analysis in future studies and to validate/confirm findings. Our study has several limitations. The small sample size may be associated with the inability to detect potential differences in certain metabolites. In this pilot study, while we captured PASI scores, psoriasis patients were allowed to maintain their usual treatment regimens. The effect of different treatment agents on metabolite perturbations could not be determined in this pilot study. Future studies with a larger patient cohort are necessary to confirm these findings.
To our knowledge, this is the first study to evaluate the comprehensive metabolome of patients with psoriasis. Differences in the serum metabolites of psoriasis patients, psoriasis patients with psoriatic arthritis, and control patients were detected through GC-TOF-MS, and further studies with larger sample sizes are necessary to confirm our findings. The development of a well-characterized metabolomics profile for patients with psoriasis and psoriatic arthritis will contribute to understanding pathophysiology of psoriasis and its associated comorbidities. The metabolite differences between psoriasis patients and healthy individuals detected by global metabolomics analysis help elucidate the underlying mechanisms of psoriasis and provide the foundations for therapeutic development.
Data availability
F1000Research: Dataset 1. Data of metabolite differences in psoriasis and psoriatic arthritis, 10.5256/f1000research.4709.d37090 65
Consent
All the participants provided a written informed consent to publish the data reported in this study. This study was approved by the Institutional Review Board at University of California, Davis.
Acknowledgements
We would like to thank Sharon Cam for her contributions to the editing of the manuscript.
Funding Statement
This work is supported by an Agency for Healthcare Quality and Research K08 Career Development Award 1K08HS018341-01 to AWA and a National Institutes of Health grant NIH U24 DK097154 to OF.
The funders had no role in study design, data collection and analysis, decision to publish, or preparation of the manuscript.
v1; ref status: indexed
References
- 1.Rachakonda TD, Schupp CW, Armstrong AW: Psoriasis prevalence among adults in the United States. J Am Acad Dermatol. 2014;70(3):512–6. 10.1016/j.jaad.2013.11.013 [DOI] [PubMed] [Google Scholar]
- 2.Gladman DD, Antoni C, Mease P, et al. : Psoriatic arthritis: epidemiology, clinical features, course, and outcome. Ann Rheum Dis. 2005;64(Suppl 2):ii14–17. 10.1136/ard.2004.032482 [DOI] [PMC free article] [PubMed] [Google Scholar]
- 3.Mease PJ, Gladman DD, Papp KA, et al. : Prevalence of rheumatologist-diagnosed psoriatic arthritis in patients with psoriasis in European/North American dermatology clinics. J Am Acad Dermatol. 2013;69(5):729–735. 10.1016/j.jaad.2013.07.023 [DOI] [PubMed] [Google Scholar]
- 4.Nestle FO, Kaplan DH, Barker J: Psoriasis. N Engl J Med. 2009;361(5):496–509. 10.1056/NEJMra0804595 [DOI] [PubMed] [Google Scholar]
- 5.Genetic Analysis of Psoriasis Consortium & the Wellcome Trust Case Control Consortium, . Strange A, Capon F, et al. : A genome-wide association study identifies new psoriasis susceptibility loci and an interaction between HLA-C and ERAP1. Nat Genet. 2010;42(11):985–990. 10.1038/ng.694 [DOI] [PMC free article] [PubMed] [Google Scholar]
- 6.Palau N, Julia A, Ferrandiz C, et al. : Genome-wide transcriptional analysis of T cell activation reveals differential gene expression associated with psoriasis. BMC Genomics. 2013;14:825. 10.1186/1471-2164-14-825 [DOI] [PMC free article] [PubMed] [Google Scholar]
- 7.Nair RP, Duffin KC, Helms C, et al. : Genome-wide scan reveals association of psoriasis with IL-23 and NF-kappaB pathways. Nat Genet. 2009;41(2):199–204. 10.1038/ng.311 [DOI] [PMC free article] [PubMed] [Google Scholar]
- 8.Ryu J, Park SG, Park BC, et al. : Proteomic analysis of psoriatic skin tissue for identification of differentially expressed proteins: up-regulation of GSTP1, SFN and PRDX2 in psoriatic skin. Int J Mol Med. 2011;28(5):785–792. 10.3892/ijmm.2011.757 [DOI] [PubMed] [Google Scholar]
- 9.Fiehn O: Metabolomics--the link between genotypes and phenotypes. Plant Mol Biol. 2002;48(1–2):155–171. 10.1007/978-94-010-0448-0_11 [DOI] [PubMed] [Google Scholar]
- 10.Eckhart AD, Beebe K, Milburn M: Metabolomics as a key integrator for "omic" advancement of personalized medicine and future therapies. Clin Transl Sci. 2012;5(3):285–288. 10.1111/j.1752-8062.2011.00388.x [DOI] [PMC free article] [PubMed] [Google Scholar]
- 11.Alley WR, Jr, Novotny MV: Glycomic analysis of sialic acid linkages in glycans derived from blood serum glycoproteins. J Proteome Res. 2010;9(6):3062–3072. 10.1021/pr901210r [DOI] [PMC free article] [PubMed] [Google Scholar]
- 12.Scholz M, Fiehn O: SetupX--a public study design database for metabolomic projects. Pac Symp Biocomput. 2007;169–180. [PubMed] [Google Scholar]
- 13.Weckwerth W, Wenzel K, Fiehn O: Process for the integrated extraction, identification and quantification of metabolites, proteins and RNA to reveal their co-regulation in biochemical networks. Proteomics. 2004;4(1):78–83. 10.1002/pmic.200200500 [DOI] [PubMed] [Google Scholar]
- 14.Fiehn O: Extending the breadth of metabolite profiling by gas chromatography coupled to mass spectrometry. Trends Analyt Chem. 2008;27(3):261–269. 10.1016/j.trac.2008.01.007 [DOI] [PMC free article] [PubMed] [Google Scholar]
- 15.Kind T, Tolstikov V, Fiehn O, et al. : A comprehensive urinary metabolomic approach for identifying kidney cancerr. Anal Biochem. 2007;363(2):185–195. 10.1016/j.ab.2007.01.028 [DOI] [PubMed] [Google Scholar]
- 16.R Development Core Team. R: A language and environment for statistical computing. R Foundation for Statistical Computing. 2011; ISBN 3-900051-900007-900050. Reference Source [Google Scholar]
- 17.Benjamini Y, Hochberg Y: Controlling the False Discovery Rate - a Practical and Powerful Approach to Multiple Testing. J Roy Stat Soc B Met. 1995;57(1):289–300 Reference Source [Google Scholar]
- 18.Svensson O, Kourti T, MacGregor JF: An investigation of orthogonal signal correction algorithms and their characteristics. J Chemom. 2002;16(4):176–188 10.1002/cem.700 [DOI] [Google Scholar]
- 19.Barupal DK, Haldiya PK, Wohlgemuth G, et al. : MetaMapp: mapping and visualizing metabolomic data by integrating information from biochemical pathways and chemical and mass spectral similarity. BMC Bioinformatics. 2012;13:99. 10.1186/1471-2105-13-99 [DOI] [PMC free article] [PubMed] [Google Scholar]
- 20.Kanehisa M, Goto S, Sato Y, et al. : KEGG for integration and interpretation of large-scale molecular data sets. Nucleic Acids Res. 2012;40(Database issue):D109–114. 10.1093/nar/gkr988 [DOI] [PMC free article] [PubMed] [Google Scholar]
- 21.Bolton E, Wang Y, Thiessen PA, et al. : PubChem: Integrated Platform of Small Molecules and Biological Activities. Annu Rep Comput Chem.Washington, DC: American Chemical Society;2008;4:217–241 10.1016/S1574-1400(08)00012-1 [DOI] [Google Scholar]
- 22.Cao Y, Charisi A, Cheng LC, et al. : ChemmineR: a compound mining framework for R. Bioinformatics. 2008;24(15):1733–1734. 10.1093/bioinformatics/btn307 [DOI] [PMC free article] [PubMed] [Google Scholar]
- 23.Davidovici BB, Sattar N, Prinz J, et al. : Psoriasis and systemic inflammatory diseases: potential mechanistic links between skin disease and co-morbid conditions. J Invest Dermatol. 2010;130(7):1785–1796. 10.1038/jid.2010.103 [DOI] [PubMed] [Google Scholar]
- 24.Medina MA: Glutamine and cancer. J Nutr. 2001;131(9 Suppl):2539S–2542S; discussion 2550S–2551S. [DOI] [PubMed] [Google Scholar]
- 25.Sitter B, Johnsson MK, Halgunset J, et al. : Metabolic changes in psoriatic skin under topical corticosteroid treatment. BMC Dermatol. 2013;13:8. 10.1186/1471-5945-13-8 [DOI] [PMC free article] [PubMed] [Google Scholar]
- 26.Koch B, Schroder MT, Schafer G, et al. : Comparison between transport and degradation of leucine and glutamine by peripheral human lymphocytes exposed to concanavalin A. J Cell Physiol. 1990;143(1):94–99. 10.1002/jcp.1041430112 [DOI] [PubMed] [Google Scholar]
- 27.Pithon-Curi TC, De Melo MP, Curi R: Glucose and glutamine utilization by rat lymphocytes, monocytes and neutrophils in culture: a comparative study. Cell Biochem Funct. 2004;22(5):321–326. 10.1002/cbf.1109 [DOI] [PubMed] [Google Scholar]
- 28.Wei L, Debets R, Hegmans JJ, et al. : IL-1 beta and IFN-gamma induce the regenerative epidermal phenotype of psoriasis in the transwell skin organ culture system. IFN-gamma up-regulates the expression of keratin 17 and keratinocyte transglutaminase via endogenous IL-1 production. J Pathol. 1999;187(3):358–364. 10.1002/(SICI)1096-9896(199902)187:3<358::AID-PATH253>3.0.CO;2-8 [DOI] [PubMed] [Google Scholar]
- 29.Schroeder WT, Thacher SM, Stewart-Galetka S, et al. : Type I keratinocyte transglutaminase: expression in human skin and psoriasis. J Invest Dermatol. 1992;99(1):27–34. 10.1111/1523-1747.ep12611394 [DOI] [PubMed] [Google Scholar]
- 30.Clarke S: Aging as war between chemical and biochemical processes: protein methylation and the recognition of age-damaged proteins for repair. Ageing Res Rev. 2003;2(3):263–285. 10.1016/S1568-1637(03)00011-4 [DOI] [PubMed] [Google Scholar]
- 31.Doyle HA, Gee RJ, Mamula MJ: Altered immunogenicity of isoaspartate containing proteins. Autoimmunity. 2007;40(2):131–137. 10.1080/08916930601165180 [DOI] [PubMed] [Google Scholar]
- 32.Kadam DP, Suryakar AN, Ankush RD, et al. : Role of oxidative stress in various stages of psoriasis. Indian J Clin Biochem. 2010;25(4):388–392. 10.1007/s12291-010-0043-9 [DOI] [PMC free article] [PubMed] [Google Scholar]
- 33.D’Angelo S, Lembo S, Flora F, et al. : Abnormal isoaspartyl residues in erythrocyte membranes from psoriatic patients. Arch Dermatol Res. 2012;304(6):475–479. 10.1007/s00403-012-1247-z [DOI] [PubMed] [Google Scholar]
- 34.Hammar H: Epidermal activity of NAD-dependent isocitrate dehydrogenase in psoriasis during treatment with dithranol. J Invest Dermatol. 1975;65(3):315–319. 10.1111/1523-1747.ep12598377 [DOI] [PubMed] [Google Scholar]
- 35.Yao K, Yin Y, Li X, et al. : Alpha-ketoglutarate inhibits glutamine degradation and enhances protein synthesis in intestinal porcine epithelial cells. Amino acids. 2012;42(6):2491–2500. 10.1007/s00726-011-1060-6 [DOI] [PubMed] [Google Scholar]
- 36.Moinard C, Caldefie F, Walrand S, et al. : Involvement of glutamine, arginine, and polyamines in the action of ornithine alpha-ketoglutarate on macrophage functions in stressed rats. J Leukoc Biol. 2000;67(6):834–840. [DOI] [PubMed] [Google Scholar]
- 37.Son ED, Choi GH, Kim H, et al. : Alpha-ketoglutarate stimulates procollagen production in cultured human dermal fibroblasts, and decreases UVB-induced wrinkle formation following topical application on the dorsal skin of hairless mice. Biol Pharm Bull. 2007;30(8):1395–1399. 10.1248/bpb.30.1395 [DOI] [PubMed] [Google Scholar]
- 38.Koivukangas V, Kallionen M, Karvonen J, et al. : Increased collagen synthesis in psoriasis in vivo. Arch Dermatol Res. 1995;287(2):171–175. 10.1007/BF01262327 [DOI] [PubMed] [Google Scholar]
- 39.Priestley GC: Hyperactivity of fibroblasts cultured from psoriatic skin: II. Synthesis of macromolecules. Br J Dermatol. 1983;109(2):157–164. 10.1111/j.1365-2133.1983.tb07076.x [DOI] [PubMed] [Google Scholar]
- 40.Yamamoto T: Angiogenic and inflammatory properties of psoriatic arthritis. ISRN Dermatol. 2013;2013:630620. 10.1155/2013/630620 [DOI] [PMC free article] [PubMed] [Google Scholar]
- 41.Matsumori R, Miyazaki T, Shimada K, et al. : High levels of very long-chain saturated fatty acid in erythrocytes correlates with atherogenic lipoprotein profiles in subjects with metabolic syndrome. Diabetes Res Clin Pract. 2013;99(1):12–18. 10.1016/j.diabres.2012.10.025 [DOI] [PubMed] [Google Scholar]
- 42.Boden G: Role of fatty acids in the pathogenesis of insulin resistance and NIDDM. Diabetes. 1997;46(1):3–10. 10.2337/diab.46.1.3 [DOI] [PubMed] [Google Scholar]
- 43.Sharma A, Gopalakrishnan D, Kumar R, et al. : Metabolic syndrome in psoriatic arthritis patients: a cross-sectional study. Int J Rheum Dis. 2013;16(6):667–673. 10.1111/1756-185X.12134 [DOI] [PubMed] [Google Scholar]
- 44.Tumova S, Woods A, Couchman JR: Heparan sulfate proteoglycans on the cell surface: versatile coordinators of cellular functions. Int J Biochem Cell Biol. 2000;32(3):269–288. 10.1016/S1357-2725(99)00116-8 [DOI] [PubMed] [Google Scholar]
- 45.Zimmermann DR, Dours-Zimmermann MT, Schubert M, et al. : Versican is expressed in the proliferating zone in the epidermis and in association with the elastic network of the dermis. J Cell Biol. 1994;124(5):817–825. 10.1083/jcb.124.5.817 [DOI] [PMC free article] [PubMed] [Google Scholar]
- 46.Boyd FT, Massagué J: Transforming growth factor-beta inhibition of epithelial cell proliferation linked to the expression of a 53-kDa membrane receptor. J Biol Chem. 1989;264(4):2272–2278. 10.1002/ijc.2910580323 [DOI] [PubMed] [Google Scholar]
- 47.Damon DH, Lobb RR, D’Amore PA, et al. : Heparin potentiates the action of acidic fibroblast growth factor by prolonging its biological half-life. J Cell Physiol. 1989;138(2):221–226. 10.1002/jcp.1041380202 [DOI] [PubMed] [Google Scholar]
- 48.Roberts R, Gallagher J, Spooncer E, et al. : Heparan sulphate bound growth factors: a mechanism for stromal cell mediated haemopoiesis. Nature. 1988;332(6162):376–378. 10.1038/332376a0 [DOI] [PubMed] [Google Scholar]
- 49.Thompson JA, Anderson KD, DiPietro JM, et al. : Site-directed neovessel formation in vivo. Science. 1988;241(4871):1349–1352. 10.1126/science.2457952 [DOI] [PubMed] [Google Scholar]
- 50.Silbert JE, Sugumaran G: Biosynthesis of chondroitin/dermatan sulfate. IUBMB life. 2002;54(4):177–186. 10.1080/15216540214923 [DOI] [PubMed] [Google Scholar]
- 51.Smetsers TF, van de Westerlo EM, ten Dam GB, et al. : Human single-chain antibodies reactive with native chondroitin sulfate detect chondroitin sulfate alterations in melanoma and psoriasis. J Invest Dermatol. 2004;122(3):707–716. 10.1111/j.0022-202X.2004.22316.x [DOI] [PubMed] [Google Scholar]
- 52.Saga K, Takahashi M: Localization of anionic sites in normal and psoriatic epidermis: the effect of enzyme digestion on these anionic sites. Br J Dermatol. 1995;132(5):710–717. 10.1111/j.1365-2133.1995.tb00715.x [DOI] [PubMed] [Google Scholar]
- 53.Poulsen JH, Cramers MK: The sulphate content of dermal and urinary glycosaminoglycans in psoriatics with increased excretion and increased dermal content of glycosaminoglycans. Scand J Clin Lab Invest. 1983;43(3):223–225. [PubMed] [Google Scholar]
- 54.Poulsen JH, Cramers MK: Dermatan sulphate in urine reflects the extent of skin affection in psoriasis. Clin Chim Acta. 1982;126(2):119–126. 10.1016/0009-8981(82)90027-4 [DOI] [PubMed] [Google Scholar]
- 55.Priestley GC: Urinary excretion of glycosaminoglycans in psoriasis. Arch Dermatol Res. 1988;280(2):77–82. 10.1007/BF00417708 [DOI] [PubMed] [Google Scholar]
- 56.Altomare G, Capsoni F: The diagnosis of early psoriatic arthritis. G Ital Dermatol Venereol. 2013;148(5):501–504. [PubMed] [Google Scholar]
- 57.Dicker KT, Gurski LA, Pradhan-Bhatt S, et al. : Hyaluronan: a simple polysaccharide with diverse biological functions. Acta Biomater. 2013;10(4):1558–70. 10.1016/j.actbio.2013.12.019 [DOI] [PMC free article] [PubMed] [Google Scholar]
- 58.Engstrom-Laurent A: Changes in hyaluronan concentration in tissues and body fluids in disease states. Ciba Found Symp. 1989;143:233–240; discussion 240–237, 281–235. 10.1002/9780470513774.ch14 [DOI] [PubMed] [Google Scholar]
- 59.Sasaki Y, Uzuki M, Nohmi K, et al. : Quantitative measurement of serum hyaluronic acid molecular weight in rheumatoid arthritis patients and the role of hyaluronidase. Int J Rheum Dis. 2011;14(4):313–319. 10.1111/j.1756-185X.2011.01683.x [DOI] [PubMed] [Google Scholar]
- 60.Engstrom-Laurent A, Hallgren R: Circulating hyaluronate in rheumatoid arthritis: relationship to inflammatory activity and the effect of corticosteroid therapy. Ann Rheum Dis. 1985;44(2):83–88. 10.1136/ard.44.2.83 [DOI] [PMC free article] [PubMed] [Google Scholar]
- 61.Paimela L, Heiskanen A, Kurki P, et al. : Serum hyaluronate level as a predictor of radiologic progression in early rheumatoid arthritis. Arthritis Rheum. 1991;34(7):815–821. 10.1002/art.1780340706 [DOI] [PubMed] [Google Scholar]
- 62.Quero L, Klawitter M, Schmaus A, et al. : Hyaluronic acid fragments enhance the inflammatory and catabolic response in human intervertebral disc cells through modulation of toll-like receptor 2 signalling pathways. Arthritis Res Ther. 2013;15(4):R94. 10.1186/ar4274 [DOI] [PMC free article] [PubMed] [Google Scholar]
- 63.Chen WY, Abatangelo G: Functions of hyaluronan in wound repair. Wound Repair Regen. 1999;7(2):79–89. 10.1046/j.1524-475X.1999.00079.x [DOI] [PubMed] [Google Scholar]
- 64.Yoshioka Y, Kozawa E, Urakawa H, et al. : Suppression of hyaluronan synthesis alleviates inflammatory responses in murine arthritis and in human rheumatoid synovial fibroblasts. Arthritis Rheum. 2013;65(5):1160–1170. 10.1002/art.37861 [DOI] [PubMed] [Google Scholar]
- 65.Armstrong AW, Wu J, Johnson MA, et al. : Data of metabolite differences in psoriasis and psoriatic arthritis. F1000Research. 2014. Data Source [DOI] [PMC free article] [PubMed]