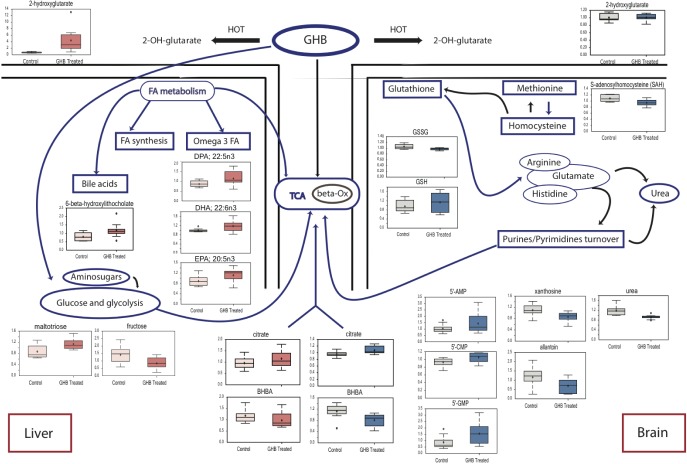
Figure 5.
Main metabolic changes in the liver (left) and the brain (right) after chronic administration of gamma-hydroxybutyrate. Box plots for main significant changes (P < 0.05) are presented in red for the liver and in blue for the brain. 5'-AMP, adenosine 5'-monophosphate; beta-Ox, beta-oxidation; BHBA, 3-hydroxybutyrate; 5'-CMP, cytidine 5'-monophosphate; 5'- FA, fatty acids; GMP, guanosine 5'- monophosphate; GSH, glutathione, reduced; GSSG, glutathione oxidized; HOT, hydroxyacid-oxoacid transhydrogenase; TCA, tricarboxylic acid cycle.

