

Abstract
Purpose
We investigated the global gene expression in a large panel of pancreatic endocrine tumors (PETs) aimed at identifying new potential targets for therapy and biomarkers to predict patient outcome.
Patients and Methods
Using a custom microarray, we analyzed 72 primary PETs, seven matched metastases, and 10 normal pancreatic samples. Relevant differentially expressed genes were validated by either quantitative real-time polymerase chain reaction or immunohistochemistry on tissue microarrays.
Results
Our data showed that: tuberous sclerosis 2 (TSC2) and phosphatase and tensin homolog (PTEN) were downregulated in most of the primary tumors, and their low expression was significantly associated with shorter disease-free and overall survival; somatostatin receptor 2 (SSTR2) was absent or very low in insulinomas compared with nonfunctioning tumors; and expression of fibroblast growth factor 13 (FGF13) gene was significantly associated with the occurrence of liver metastasis and shorter disease-free survival. TSC2 and PTEN are two key inhibitors of the Akt/mammalian target of rapamycin (mTOR) pathway and the specific inhibition of mTOR with rapamycin or RAD001 inhibited cell proliferation of PET cell lines.
Conclusion
Our results strongly support a role for PI3K/Akt/mTOR pathway in PET, which ties in with the fact that mTOR inhibitors have reached phase III trials in neuroendocrine tumors. The finding of differential SSTR expression raises the potential for SSTR expression to be evaluated as a marker of response to somatostatin analogs. Finally, we identified FGF13 as a new prognostic marker that predicted poorer outcome in patients who were clinically considered free from disease.
INTRODUCTION
Pancreatic endocrine tumors (PETs) are heterogeneous diseases in terms of clinical manifestations and behavior.1 They are clinically classified as functioning (F) or nonfunctioning tumor (NF), based on presence of symptoms caused by hormone secretion.2 F-PETs are mainly represented by insulinomas. The WHO classification distinguishes three categories: well-differentiated endocrine tumor (WDET) having an indolent clinical course; well-differentiated endocrine carcinoma (WDEC) that are diagnosed based on the presence of invasion or metastasis; poorly differentiated endocrine carcinoma (PDEC) with a survival as poor as that of pancreatic adenocarcinoma.2 However, the malignant potential of WDECs varies greatly, cannot be predicted by histological appearance and the proliferation rate alone is a valuable predictor of clinical outcome.3,4
Radical surgery is the only curative treatment for PETs, while medical treatments including somatostatin analogs, interferon, chemotherapy, and receptor radionuclide therapy are effective only in a portion of patients with progressive disease.5–8
Little is known about the molecular pathogenesis of PETs.1 They occur sporadically or as part of familial cancer syndromes, including multiple endocrine neoplasia type 1 (MEN1), von Hippel Lindau and, less frequently, neurofibromatosis9 or tuberous sclerosis complex.10–12 Somatic MEN1 gene mutations are the most common genetic alterations found, while mutations typically involved in pancreatic adenocarcinoma are uncommon.13–18
Gene expression profiling studies have identified several potential biomarkers.19–25 However, none of these have shown definite correlation with disease outcome, possibly due to the heteregeneous design of the studies and the low number of cases included, ranging from 8 to 12 cases per category of well differentiated endocrine tumors.
We performed the largest expression profile study of PETs to date, including samples from each clinicopathologic category with the aim of better understanding the molecular basis of this disease, and identifying new prognostic markers and therapeutic targets.
PATIENTS AND METHODS
Primary Tumors
The expression profile study involved 72 primary PETs (Table 1) classified according to WHO criteria,2 seven matched metastases, five normal pancreas, and five preparations of islets of Langerhans obtained from multiorgan donors as described.26 The proliferative activity was measured by Ki67 immunohistochemistry, expressed as the percentage of Ki67-positive cells in 2,000 tumor cells within areas of highest immunostaining using the MIB1 antibody (DBA, Milan, Italy). RNA extracted from frozen tissues was assessed for quality using Agilent 2100 Bioanalyzer (Agilent, Palo Alto, CA).
Table 1.
Clinicopathologic Information of the Samples Used in This Study
| Parameter | MicroarraySamples | TaqManSamples | TMASamples |
|---|---|---|---|
| No. of patients | 72 | 77 | 141 |
| Sex | |||
| Male | 30 | 37 | 60 |
| Female | 42 | 40 | 81 |
| Age, years | 53 | 54 | 54 |
| Range | 17-78 | 23-78 | 17-78 |
| Median tumor size, mm | 30 | 35 | 30 |
| Surgery | |||
| Complete excision | 58 | 59 | 113 |
| Paliative/debulking | 14 | 17 | 25 |
| Explorative | 0 | 1 | 3 |
| Functional status | |||
| Functioning | 16* | 20† | 34‡ |
| Nonfunctioning | 56 | 57 | 107 |
| WHO classification | |||
| Well-differentiated tumor benign | 39 | 39 | 76 |
| Well-differentiated carcinoma | 30 | 34 | 60 |
| Poorly differentiated carcinoma | 3 | 4 | 5 |
| Metastasis | |||
| Lymph node | 25 | 26 | 42 |
| Liver | 16 | 19 | 30 |
| Invasion | |||
| Vascular | 34 | 37 | 68 |
| Soft tissue | 21 | 23 | 39 |
| Perineural | 23 | 27 | 50 |
| Not specified | 3 | 7 | |
| Proliferation index | |||
| Ki67 < 5% | 50 | 55 | 100 |
| Ki67 ≥ 5% | 22 | 19 | 37 |
| Not specified | 3 | 4 | |
| Median survival | |||
| Median follow-up, years | 4.3 | 4.6 | |
| Overall survival | Not reached | Not reached | |
| No. of events | 14 | 23 | |
| No. of patients | 67 | 126 | |
| Progression-free survival, years | 7.7 | Not reached | |
| No. of events | 25 | 38 | |
| No. of patients | 65 | 125 | |
| Disease-free survival | Not reached | Not reached | |
| No. of events | 8 | 18 | |
| No. of patients | 48 | 105 |
Abbreviations: TMA, tissue microarray; ACTHoma, adrenocorticotropic hormone–producing neoplasm.
Fifteen insulinoma and one gastrinoma.
Fifteen insulinoma, two gastrinoma, one vipoma, one glucagonoma, and one ACTHoma.
Twenty-seven insulinoma, three gastrinoma, two vipoma, one somatostatinoma, and one ACTHoma.
Microarray Analysis and Validation Studies
A total of 95 samples (89 unique plus six technical replicates) were analyzed using an 18.5 K human oligo microarray from the Ohio State University Cancer Center (Appendix, online only). Most analysis and graphics were generated using R software version 2.0.27 Gene Ontology analysis was performed using the DAVID analysis framework (http://david.abcc.ncifcrf.gov). For validation, quantitative real-time PCR (qRT-PCR; Table 1) was performed on 55 cases of the microarray set and 22 new cases, and immunohistochemistry was applied on tissue microarrays (TMA) containing 141 PETs and 12 normal pancreata (Table 1). Three PET cell lines were treated with Rapamycin (Calbiochem) and RAD001 (Novartis) to inhibit mammalian target of rapamycin (mTOR) pathway. The methods used for validation studies are detailed in Appendix.
Time to Progression and Survival
Patients were monitored every 3 to 6 months with clinical and laboratory evaluation, ultrasound, magnetic resonance imaging or contrast enhanced computed tomography (CT) scan when necessary, according to a follow-up protocol established at our center since 1990. Time to progression was defined as the interval from surgery to disease progression.28 Survival was calculated from the date of diagnosis. Log-rank test was used to compare survival curves. Multivariate survival analysis was performed using Cox's proportional hazard model. The covariates included in the analysis were evaluated using both forward and reverse stepwise methods.
RESULTS
Global gene expression profiles were obtained from 72 primary PETs (39 WDET, 30 WDEC, and three PDEC), seven matched metastases and 10 normal pancreatic samples, using a custom oligomicroarray.
Unsupervised hierarchical clustering analysis and correspondence analysis identified four clusters: normal pancreas, normal islets, insulinoma, and NF-PETs (Fig 1; Data Supplement Fig DS1). These latter fell into three partially overlapping areas reflecting the three WHO categories. Notably, the cluster containing two of the three PDEC, characterized by a ≥ 30% proliferation index, included four well-differentiated carcinomas showing slight to moderate nuclear atypia and a high proliferation index, ranging from 8% to 15%. All the metastasis clustered with their matching primary cancer (Data Supplement).
Fig 1.

Bidimensional projection of the expression profiles of pancreatic endocrine tumors (PETs) and normal samples by correspondence analysis. Projection of PETs and normal samples into two-dimensional space using the top 1,000 probes with the highest interquartile range. Bulk tissues, islet cells, insulinomas (INS), and nonfunctioning PETs showed a distinctive pattern of expression, which projects them in different regions of the plane. PDEC, poorly differentiated endocrine carcinoma; WDEC, well-differentiated endocrine carcinoma; WDET, well-differentiated endocrine tumor; Islet, normal pancreatic islets of Langerhans; Bulk, normal bulk tissue.
Class comparison analysis was employed to identify differentially expressed genes between normal and tumor as well as between well-differentiated tumor subtypes, excluding PDECs due to their limited number.
TSC2 Is Downregulated in PETs and Inversely Correlates With Prognosis
Since insulinomas and NF-PETs showed a different expression pattern in the unsupervised analysis, they were independently compared with normal samples (Appendix). This analysis identified 113 upregulated and 25 downregulated genes in insulinomas, while NF-PETs showed 189 upregulated and 55 downregulated genes.
Among the downregulated genes, tuberous sclerosis 2 (TSC2) had a consistently decreased expression in both insulinomas and NF-PETs. TSC2 is an inhibitor of the Akt-mTOR pathway, with a putative oncosuppressor role.29 Its downregulation has been confirmed using immunohistochemistry on TMAs. In normal pancreata, islet cells had a strong cytoplasmic staining, while nucleus and membrane were negative, whereas in 137 PETs, 35% of tumors had negative or weak staining, 36% had moderate staining and 30% showed strong TSC2 staining (Fig 2). Patients with a low TSC2 expression (negative to moderate staining) showed a shorter overall survival (Fig 2D; log-rank test n = 123; P = .005) as well as a shorter time to progression (Fig 2E; log-rank test n = 122; P < .001) and disease-free survival (log-rank test n = 117; P < .001). The low level TSC2 expression group was significantly correlated with functional status and tumor aggressiveness (Table 2). More importantly, patients free from liver or lymph node metastasis at diagnosis and low expression of TSC2 had a significantly shorter disease-free survival (log-rank test n = 80; P = .008). For instance, the only three WDET patients who had progression of disease showed low TSC2 expression.
Fig 2.
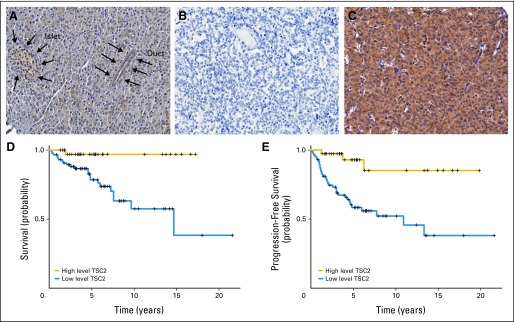
Tuberous sclerosis 2 (TSC2) protein expression and its correlation with survival in pancreatic endocrine tumors (PETs). Immunohistochemistry with antituberin antibody (Novocastra, Newcastle, United Kingdom). Original magnification: ×20. (A) Normal pancreatic tissue with an islet and duct (indicated by arrows), the cells of which show a cytoplasmic staining stronger than that seen in acini; (B) PET tissue with negative staining; (C) PET tissue with strong staining. Correlation of tuberin immunostaining with (D) overall survival and (E) progression-free survival. High level TSC2, staining score higher than 2; low level TSC2, staining score ≤ 2.
Table 2.
Correlation of TSC2 and PTEN Protein Expression With Clinicopathologic Parameters
| Parameter | No. | Low TSC2 (%) | P* | No. | Low PTEN (%) | P* |
|---|---|---|---|---|---|---|
| WHO classification | 137 | 137 | ||||
| WDET | 73 | 53.4 | < .001 | 74 | 25.7 | < .001 |
| WDEC | 59 | 88.1 | 59 | 57.6 | ||
| PDEC | 5 | 100.0 | 4 | 75.0 | ||
| Functional status | 137 | 137 | ||||
| F-PET | 33 | 51.5 | .015 | 33 | 24.2 | .027 |
| NF-PET | 104 | 76.0 | 104 | 46.2 | ||
| Proliferation index | 130 | 130 | ||||
| Ki67 < 5% | 94 | 64.9 | .018 | 95 | 32.6 | .015 |
| Ki67 ≥ 5% | 36 | 86.1 | 35 | 57.1 | ||
| Liver metastasis at diagnosis | 136 | 136 | ||||
| Liver metastasis | 30 | 90.0 | .007 | 28 | 64.3 | .005 |
| Disease free | 106 | 65.1 | 108 | 34.3 | ||
| Liver metastasis at follow-up† | 101 | 103 | ||||
| Liver metastasis | 15 | 100.0 | .002 | 16 | 56.3 | .015 |
| Disease free | 86 | 60.5 | 87 | 29.9 |
Abbreviations: TSC2, tuberous sclerosis 2; PTEN, phosphatase and tensin homolog; WDET, well-differentiated endocrine tumor; WDEC, well-differentiated endocrine carcinoma; PDEC, poorly differentiated endocrine carcinoma; F-PET, functioning pancreatic endocrine tumor; NF-PET, nonfunctioning pancreatic endocrine tumor.
Fisher's exact test.
Patients who had a complete resection of the tumor.
Phosphatase and Tensin Homolog Protein Is Downregulated in PETs and Inversely Correlates With Prognosis
As phosphatase and tensin homolog (PTEN) is another important inhibitor of the Akt-mTOR pathway,29 its protein level was also measured using immunohistochemistry on TMAs (Fig 3). The normal pancreatic islet cells showed moderate to strong staining in both the nucleus and cytoplasm, while the membrane was always negative. Tumors showed altered expression in either nuclear, cytoplasmic, or both compartments in 60.6% of the samples. Although a low level of nuclear PTEN (negative to weak staining) was found in 58% of tumors, only cytoplasmic staining showed a significant correlation with clinicopathologic parameters. As observed with TSC2, low cytoplasmic PTEN (negative to weak staining) level was associated with functional status and more aggressive tumors (Table 2). Furthermore, low cytoplasmic expression of PTEN correlated with a shorter time to progression of the disease (Fig 3D; log-rank test n = 122; P = .002) and disease-free survival (log-rank test n = 103; P = .02).
Fig 3.
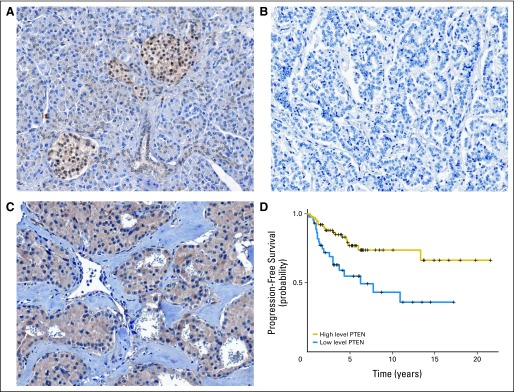
Phosphatase and tensin homolog (PTEN) protein expression and its correlation with survival in pancreatic endocrine tumors (PETs). Immunohistochemistry with anti-PTEN antibody (Cell Signaling Technology, Beverly, MA). Original magnification: ×20. (A) Normal pancreatic tissue with islets showing strongly stained cytoplasm and nuclei; (B) PET tissue with negative staining; (C) PET tissue with strong cytoplasmic and nuclear protein expression. (D) Correlation between PTEN immunostaining and disease-free survival. High level PTEN, staining score ≥ 2; low level PTEN, staining score < 2.
Combined TSC2 and PTEN Anomalies
Overall, 85% of primary tumors showed altered protein levels of TSC2, PTEN (nuclear or cytoplasmic), or both. Notably, among patients with radical resection of the tumor, of 25 who showed low levels of TSC2 and PTEN expression at both cytoplasmic and nuclear levels, eight (32%) developed liver metastasis and progression of the disease. In contrast, none of the 20 patients with normal level of both TSC2 and PTEN proteins showed liver metastasis and only one had progression of the disease at the primary site. To assess the independent prognostic value of TSC2 and PTEN for both overall and progression-free survival a multivariate analysis has been performed. Selection of the best models was carried out using both forward and backward stepwise methods which gave the same result that is presented in Table 3. Neither TSC2 nor PTEN were independent prognostic indicators at this analysis.
Table 3.
Cox's Regression Analysis of OS and PFS
| Parameter* | No. of Cases | OS |
No. of Cases | PFS |
||||
|---|---|---|---|---|---|---|---|---|
| HR | 95% CI | P | HR | 95% CI | P | |||
| WHO classification | < .001 | < .001 | ||||||
| Well-differentiated tumor benign | 69 | 1 | 72 | 1 | ||||
| Well-differentiated carcinoma | 52 | 18.8 | 2.3 to 156 | 47 | 10.1 | 2.8 to 37.2 | ||
| Poorly differentiated carcinoma | 5 | 71.9 | 7.4 to 702 | 5 | 15.9 | 3.1 to 82.1 | ||
| Liver metastasis | .003 | < .001 | ||||||
| No | 102 | 1 | 103 | 1 | ||||
| Yes | 24 | 3.9 | 1.5 to 9.7 | 21 | 3.7 | 1.7 to 7.8 | ||
| Proliferation index | NS | .02 | ||||||
| Ki67 < 5% | 93 | 92 | 1 | |||||
| Ki67 ≥ 5% | 33 | 32 | 2.4 | 1.1 to 5.1 | ||||
Abbreviations: OS, overall survival; PFS, progression-free survival; HR, hazard ratio; NS, not significant.
The best model was selected with the input of the following covariates: WHO classification, presence of liver or nodal metastasis, vascular and perineural and peripancreatic fat invasion, Ki67 (< or ≥ 5%), radical surgery, functional status, tuberous sclerosis 2 and phosphatase and tensin homolog immunohistochemical staining.
mTOR Inhibitors Induce Growth Arrest in PET Cell Lines
The expression of TSC2 and PTEN protein was also strongly reduced in the three available PET cell lines to the control cells (Hek293T; Fig 4A).
Fig 4.


Effect of the treatment of pancreatic endocrine tumor cell lines with mammalian target of rapamycin (mTOR) inhibitors. (A) Protein expression of the three regulators of AKT/mTOR pathway, tuberous sclerosis 2 (TSC2), phosphatase and tensin homolog (PTEN), and Rheb in the pancreatic endocrine cell lines QGP-1, BON, and CM, and relative densitometries (Hek293T cells were used as control). (B) QGP-1, BON, and CM were stimulated with fetal bovine serum for 2 hours and then treated with rapamycin or RAD001 at the indicated concentrations for 24 hours. One representative blot is shown. (C) QGP-1, BON, and CM were treated with rapamycin or RAD001 for 72 hours. The cell proliferation rate was measured by CellTiter 96 kit (Promega, Madison, WI). Means and standard deviations of three independent experiments are reported. P represents the significance of each treatment versus untreated control. (D) BON cells were treated for 72 hours with RAD001. Cell cycle was analyzed by flow cytometry. OD, optical density.
Activity of mTOR was inhibited by both rapamycin and RAD001, even at low concentrations, as suggested by the dephosporylation of its downstream targets rpS6 and 4EBP1 seen in all three cell lines (Fig 4B). As expected, the inhibition of mTOR activated a negative feedback which led to increased AKT phosporylation. Cell proliferation in two cell lines (BON and CM) was significantly affected (Fig 4C), with similar response for both rapamycin and RAD001. Consistent with the expected effect of mTOR inhibition, we observed an increase of cells in G1, and a clear decrease of cells in the S phase, on RAD001 treatment.
SSTR2 Is Upregulated in NF-WDET Compared With Insulinoma
Direct comparison between the 25 NF-WDET and 14 insulinoma identified 161 over-expressed and 101 under-expressed genes.
Among the upregulated genes, the somatostatin receptor 2 (SSTR2) showed a median expression 3.5 times higher in NF-WDET compared with insulinoma. The immunohistochemical analysis performed on TMA confirmed this finding (Fig 5). Normal pancreas showed a moderately intense membranous staining of the islet cells with no cytoplasmic or nuclear signals. Among the 25 insulinomas, 10 (40%) showed negative, seven weak (28%) and eight moderate (32%) membranous staining. Conversely, the 47 NF-WDET samples showed five negative (11%), 13 weak (28%), 11 moderate (23%), and 18 strong staining (38%). This difference between NF-WDET and insulinoma is highly significant (P < .001, Fisher's exact test).
Fig 5.
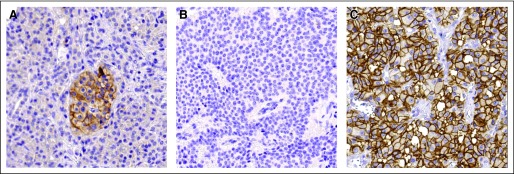
Somatostatin receptor 2 (SSTR2) protein expression in normal pancreatic tissue, nonfunctioning pancreatic endocrine tumors (NF-PETs), and insulinomas. Immunohistochemistry with anti-SSTR2 antibody (Biotrend/Gramsch Laboratories, Schwabhausen, Germany). Original magnification: ×20. (A) Normal pancreatic tissue showing a moderate membranous staining in islet cells; (B) insulinoma tissue with negative membranous staining; (C) NF-PET tissue with strong membranous staining.
FGF13 Expression Correlates With Metastatic Potential of NF-PETs
Taking advantage of the large number of tumors profiled, we divided the population into subgroups based on their clinical-pathological features. It was thus possible to identify several genes that were differentially expressed for samples with different proliferation indexes (cutoff at 5%), WHO classification (WDEC v WDET), presence/absence of lymph node metastasis, presence/absence of liver metastasis at diagnosis or follow-up.
Interestingly, a functional classification of genes over-expressed in samples with high proliferation index showed that several Gene Ontology categories related to innate immune response and inflammation were over-represented.
Fibroblast growth factor 13 (FGF13) was upregulated in metastatic compared to nonmetastatic primary tumors. Quantitative RT-PCR in a larger set of patients confirmed that FGF13 expression level was significantly higher in more aggressive tumors (Fig 6A; n = 71; Mann-Whitney U P < .001) and in those with a high Ki67 (Fig 6B; n = 77; P = .003). Remarkably, high expression of FGF13 was associated with liver metastasis at diagnosis (n = 75; P = .001) or at follow-up (n = 49; P = .01), even in patients who had complete primary tumor resection.
Fig 6.

Fibroblast growth factor 13 (FGF13) mRNA expression in pancreatic endocrine tumors (PETs). (A) FGF13 expression measured by quantitative real-time polymerase chain reaction in normal pancreas (two normal bulk pancreas and three islet cell samples) and 77 PETs. These latter comprised 55 cases belonging to the series profiled by microarray (indicated in black) and 22 new cases (indicated in blue). (B) FGF13 expression in patients with low (Ki67 < 5%) and high (Ki67 ≥ 5%) proliferative index. (C,D) Correlation between FGF13 mRNA level and progression-free and disease-free survival, respectively. WDET, well-differentiated tumor; WDEC, well-differentiated carcinoma; PDEC, poorly differentiated carcinoma.
Notably, in a multivariate model on well-differentiated neoplasms alone including Ki67 and FGF13, high expression of the latter (above median) retained its independent predictive value for shorter progression free survival (Table 4; Cox hazard model, n = 59; R2 = 0.34; P < .001). In addition, high FGF13 predicted a shorter progression-free period (Fig 6C) and disease-free survival in patients considered free from liver or lymph node metastasis at diagnosis (Fig 6D; log-rank test; n = 38; P = .006).
Table 4.
Multivariate Analysis of Progression-Free Survival With FGF13 Expression and Proliferative Marker Ki67
| Variable | Hazard Ratio* | 95% CI | P |
|---|---|---|---|
| High FGF13 expression | 3.9 | 1.2 to 12.0 | .02 |
| Ki67 ≥ 5% | 4.1 | 1.6 to 10.3 | .003 |
The hazard ratio and its CI were estimated using a Cox proportional hazard model.
Although it was possible to identify genes associated with metastatic potential of primary samples, no relevant difference was observed between the profile of seven metastases (three lymph node and four liver metastases) and their matched primary tumors. The only few genes found downregulated in metastatic tissue were associated with the normal pancreas function, suggesting a high similarity between the expression profiles of primary and metastatic cancer cells (data not shown).
DISCUSSION
Our study takes advantage of the largest set of PET profiles obtained to date to identify biologic traits associated with different clinicopathologic features.
Unsupervised hierarchical clustering of the expression profiles highlighted a distinctive pattern between tumor and normal tissues, and, within the latter, between bulk and islet cells samples, reflecting their different biology and functions. Notably, within PETs, insulinomas expressed a specific pattern of genes that distinguishes them from NF-PETs, while a less clear separation was seen among tumors assigned to different WHO categories. This suggests more subtle differences in terms of gene expression among the nonfunctioning type of PET.
Among the downregulated genes found in PET, TSC2 is a tumor suppressor of the Akt/mTOR pathway with GTPase activating function that is potentially interesting because of its implication for therapy. TSC2 mutation leads to tuberous sclerosis complex.30 Chromosome arm 16p, which contains TSC2, has been found to be lost in 37% of PETs.31,32 Another important tumor suppressor gene involved in the same pathway is PTEN, which is also frequently mutated or lost in several sporadic or familiar cancer types33; while in PETs the frequency of loss is between 10% and 29%.31,32,34
Our immunohistochemical survey on 137 patients showed that TSC2 cytoplasmic protein level was downregulated in 35% of patients, while staining of PTEN was altered in either nuclear, cytoplasmic, or both cell compartments in around 60% of cases. Remarkably, lower cytoplasmic staining of either PTEN or TSC2 correlated with tumor aggressiveness, functional status, proliferation index, presence of liver metastasis at diagnosis or follow-up, and with time to progression. These results held true also when the 5 PDECs contained in the TMA were removed from the analysis (data not shown). Furthermore, TSC2 staining correlated with overall survival and, outstandingly, also with disease-free survival in patients with assumed complete tumor excision. The fact that neither PTEN nor TSC2 were independent prognostic predictors at multivariate analysis does not diminish the value of our observation as its importance resides in the identification of an activated pathway that is pharmacologically targetable.
Several pieces of evidence associated with our findings on TSC2 and PTEN support the hypothesis of involvement of the Akt/mTOR pathway in PET tumorigenesis and progression.
It has been shown that the deficiency of TSC2 or PTEN reduces the inhibition of mTOR activity caused by hypoxia.35 Although PETs are usually well vascularized, the more aggressive carcinomas show a lower microvascular density compared to the benign form of the tumor.22,36,37 Notably, we report a lower expression of TSC2 or PTEN associated with the more aggressive subtypes of PETs, where their downregulation may help tumor cells to escape the mTOR inhibition due to lack of oxygen.
Akt/mTOR is involved in the growth and apoptosis of pancreatic β cells.38 In fact, mice with constitutively active Akt protein or conditional deletion of TSC2 in the β cells showed similar phenotype, with increased β cell mass and size.38,39 Guo et al40 observed the activation of Akt in 14 of 20 PETs and overexpression of cyclin D1 in 13 patients. This latter observation is also important, since PTEN mutation or downregulation as well as Akt activation are responsible for the overexpression of cyclin D1,41 which negatively regulates TSC1-TSC2 function.42
It has been shown that lack of TSC2 expression induces impaired PI3K-Akt activation by reducing platelet-derived growth factor receptor43,44 or insulin receptor substrate level,45,46 limiting its tumorigenic potential. However, this negative feedback can be overcome by heterozygous PTEN inactivation, leading to an active Akt protein even in the absence of tyrosine kinase signaling.47 Partially supporting these observations, we found that low expression of both PTEN and TSC2 was associated with aggressive tumors.
Several new available rapamycin analogs seem to show higher antiproliferative effects in vitro and in vivo on cell lines with lost PTEN expression.48,49 Our in vitro study performed in three PET cell lines showed inhibition in proliferation and G0/G1 cell cycle arrest on treatment with both rapamycin and RAD001, confirming previous findings.50,51 Notably, the treatment induced AKT activation, which is considered the molecular mechanism attenuating the therapeutic effects of mTOR inhibitors.52 Recently, NVP-BEZ235 has been shown to be able to inhibit both PI3K and mTOR, overcoming the abovementioned negative feedback.53
To date, two clinical trials have evaluated the efficacy of mTOR inhibitors in PET. Duran et al analyzed the effect of temsirolimus, a rapamycin analog, in neuroendocrine cancer, and found either a partial response or a stabilization of the disease in 63.9% of patients.54,55 More recently, Yao et al56 evaluated the activity of a combined treatment of RAD001 and octreotide. Again, this showed promising results, with 22% of patients showing partial response, while 70% had their disease stabilized.
Our observation that somatostatin receptor 2 is predominantly overexpressed in NF-PET, with almost 40% of the patients having very strong staining, is extremely relevant for PET therapy. In this regard, Butturini et al28 have recently shown that treatment of NF-PET with somatostatin analog octreotide can stabilize the disease in approximately 40% of these patients.28,56 The finding of differential SSTR expression raises the potential for SSTR expression to be evaluated as a marker of response to somatostatin analogs.
Moreover, we identified FGF13 as a new marker of progression which has never been described before in PET. Its expression was correlated with tumor aggressiveness and proliferation. More importantly, its overexpression was an independent predictor of a shorter progression-free survival in association with Ki-67 staining, which is the gold standard biologic marker in PET. Furthermore, overexpression was associated with liver metastasis at follow-up and shorter disease-free survival in those patients who underwent complete tumor resection. However, the limited number of events within the analyzed population did not permit the performance of more comprehensive multivariate analyses. Little is known about FGF13 function and, although FGF13 protein has a high homology with FGFs, it is unable to stimulate FGF receptors.57 It has been shown that it interacts with Islet brain-2 and function as cofactor to recruit the MAP kinase protein p38.58
The expression analysis of primary tumors and matched metastasis clearly showed an almost identical pattern between them, supporting the hypothesis of an early acquisition of genetical features to metastasize by the entire primary tumor.21,59
In conclusion, this study suggests an important role of the PI3K-Akt-mTOR pathway in PET tumorigenesis and progression, which support the promising results observed in recent clinical trials involving the use of rapamycin analogs in neuroendocrine tumors. Further in vitro and in vivo studies are required in order to fully understand the efficacy of these drugs in PET, particularly when combined with others potentially able to block AKT activation.
Finally, we showed that the overexpression of FGF13 was a predictor of shorter progression-free survival independent from the proliferation index Ki67. This marker merits further studies on additional case series to validate its clinical applicability.
Appendix
Microarray analysis.
A total of 95 samples (89 unique samples plus six technical replicates) were analyzed using an 18.5K human oligo microarrays obtained from the Ohio State University Cancer Center. Total RNA was extracted from snap frozen tissue using 4M guanidine thiocyanate containing 0.1M 2-mercaptoethanol and centrifuged through a CsCl2 gradient. RNA quality and concentration were assessed using Agilent 2100 Bioanalyzer (Agilent Technologies, Palo Alto, CA).
Probe synthesis, hybridization, and scanning.
The chips were built from Compugen/Sigma-Genosys oligo sets and contained 19,200 elements representative of 18.670 unique GeneBank IDs, of which 14,700 unique Unigene Cluster IDs, and in-house species specific housekeeping gene control oligo probes as well as positive/negative control oligos.
For target preparation, 5 μg of total RNA were reverse transcribed using SuperscriptT-II/RNaseH-priming with T7-(dT)24 oligonucleotides and the second-strand cDNA synthesized using E coli DNA polymerase I. Biotinylated cRNA was generated using T7 RNA polymerase and Biotin 11-UTP. Ten micrograms of purified unfragmented target cRNA was hybridized on each chip. The microarrays were hybridized, washed, and processed using a direct detection method of the biotin-containing transcripts by a Streptavidin-Alexa647 conjugate (Invitrogen, Carlsbad, CA).
Scanned images were analyzed using the Genepix 6.0 software (Axon Instruments, Sunnyvale, CA).
Bioinformatic analysis.
The chip was annotated using AnnBuilder package available for the R software starting from the GeneBank accession numbers made available from Compugen/Sigma-Genosys.
The median signal subtracted for the background was normalized using a variance-stabilizing transformation stratifying the spots by grid (Huber W, von Heydebreck A, Sultmann H, et al: Bioinformatics 18:S96-S104, 2002 [suppl 1]) as implemented in the vsn package. The normalized values were filtered of all the spots with intensity lower than 8.97 (log2 500) using genefilter package. The remaining 7,978 spots underwent further analysis by direct two class unpaired comparison using the samr package (Tusher VG, Tibshirani R, Chu G: Proc Natl Acad Sci U S A 98:5116-5121, 2001). The lists of differentially expressed genes were obtained applying the input criteria (based on fold-change and delta value) which have been reported in the title of each table. Due to the limited number of PDEC samples, they were not considered in direct comparison analyses. As PETs seem to rise from islet cells, the best normal reference would be the purified pancreatic islets. However, gene expression of isolated islets might be affected by the purification procedure. In contrast, normal bulk pancreas contains a small proportion of islet cells and a comparison with tumors is expected to output genes associated with the normal physiology of the pancreas. To overcome this problem, we considered as associated genuinely to tumor, the intersection of the two gene sets, obtained comparing separately the tumor samples versus normal bulk samples or purified islet cells.
Hierarchical cluster analysis was performed using the first 1,000 probes with the highest interquartile range. We employed Pvclust packages that conduct multiscale bootstrap resampling to compute P values for each cluster. The distance metric used to cluster samples was Pearson correlation, and the agglomerative method was the average linkage.
Correspondence analysis was performed using Made4 package. This method, like the principal component analysis, projects the samples into a lower dimensional space (two or three dimensions) accounting for the main sources of variance in the data (Fellenberg K, Hauser NC, Brors B, et al: Proc Natl Acad Sci U S A 98:10781-10786, 2001).
Quantitative real-time polymerase chain reaction.
Quantitative real-time polymerase chain reaction (qRT-PCR) analysis was performed on ABI PRISM 7000 Sequence Detection System (Applied Biosystems, Foster City, CA) using 77 primary PET samples that included 55 used for microarray profiling and a novel set of 22 cases, and five normal samples (three isolated islets cell samples and two pancreatic bulk tissue). cDNAs were synthesized from 1 μg of total RNA using random primers and the Superscript II reverse transcription kit (Invitrogen, Carlsbad, CA) according to the manufacturer's protocol. Oligonucleotide primers employed to amplify FGF13 gene transcripts were FGF13A forward GACCAGCTGCGACAAAAACAA, FGF13A reverse TGAGGCTCTGGTCTTCTTCTGC; FGF13B forward GTTACCAAGCTATACAGCCGAC, FGF13B reverse ACAGGGATGAGGTTAAACAGAGT.
β-actin transcript level was used to normalize the samples. PCR reactions contained 20 ng of cDNA, 200 nmol/L primers, and 1× SYBR GREEN PCR Master Mix (Applied Biosystems) in 25 μL final volume. The primers used were β-actin forward GGAGTCCTGTGGCATCCACG; β-actin reverse CTAGAAGCATTTGCGGTGGA. Cycling conditions for all qRT-PCR were initial denaturation step at 95°C for 10 minutes, followed by 40 cycles of 95°C for 15 seconds, and 60°C for 60 seconds.
Calibration curves of each couple of primers were obtained by serial dilution of cDNA. Similar PCR efficiencies of approximately 90% (calculated as 10-1/slope − 1) were deducted, therefore expression data were analyzed by the comparative threshold cycle (Ct) method accordingly to User Bulletin #2 (Applied Biosystems). Results were expressed as ΔΔCt in comparison to the sample with the lowest expression. All experiments were performed in duplicate.
The statistical significance of the differences between samples subgroups were investigated by either logistic regression analysis or the Mann-Whitney U test. All the analyses were performed using the R program.
Immunohistochemistry.
Immunohistochemical staining was performed on six formalin-fixed, paraffin-embedded PET-specific tissue microarrays (TMA) containing 141 PETs and 12 normal pancreata represented by a total of 562 cores. The 141 PETs included 107 nonfunctioning (49 WDETs, 53 WDECs, and five PDECs) and 34 functioning tumors (27 WDETs and seven WDECs). TMAs were constructed using a tissue arrayer (Beecher Instruments, Silver Spring, MD) and included at least three cores of 1 mm diameter per sample, as previously described (Kononen J, Bubendorf L, Kallioniemi A, et al: Nat Med 4:844-847, 1998).
Expression of SSTR2 (Biotrend/Gramsch Laboratories, Schwabhausen, Germany), TSC2 (Novocastra, Newcastle, United Kingdom), and PTEN (Cell Signaling Technology, Beverly, MA) were carried out as previously described (Papotti M, Bongiovanni M, Volante M, et al: Virchows Arch 440:461-475, 2002) or according to the manufacturer's instructions.
Images were acquired using the Scanscope Console (Aperio Technologies, Vista, CA) and visualized using ImageScope software (Aperio Technologies). Protein expression was scored by two blind independent observers (A.S., S.B.). The staining intensity was classified into four grades: 0 (absent), 1 (weak), 2 (moderate), 3 (strong). Neoplastic cells were always uniformly stained.
Associations between IHC scores and clinicopathologic features were tested by Fisher's exact test, while survival analysis was performed using Log-rank test. A P value lower than .05 was considered statistically significant.
Cell culture and reagents.
The human pancreatic endocrine tumor cell line QGP-1, derived from a metastatic somatostatinoma was obtained from the Cancer Research UK Cell Services; CM cells which originates from an insulinoma, were kindly provided by Marco Baroni, MD (Rome, Italy), while BON cells (pancreatic carcinoid) were provided by Stefan Rosewicz, MD (Berlin, Germany). QGP-1, CM, and BON cells were grown at 37°C in a humidified 5% CO2 atmosphere in RPMI-1640 medium (BioWhittaker Cambrex Bioscience, Walkerville, MD) supplemented with 10% and 5% fetal bovine serum (Gibco BRL, Invitrogen, Carlsbad, CA) and D-MEM-F12K (1:1) with 10% fetal bovine serum, respectively.
Cell treatments.
The three PET cell lines QGP-1, CM, and BON were treated with different doses of rapamycin (0.1 to 10 nmol/L; Calbiochem) or RAD001 (0.1 to 10 nmol/L; Novartis Pharma AG, Basel, Switzerland). Cells incubated with 0.1% dimethyl sulfoxide (Sigma-Aldrich, St Louis, MO) served as control. Effect on specific protein expression and/or phosphorylation was monitored by western blotting. Cell proliferation was assayed using CellTiter A96 MTS (Promega, Madison, WI), while cell cycle was examined by propidium iodide staining using flow cytometry.
Western blot analysis.
After each treatment cells were resuspended in lysis buffer (100 mmol/L NaCl, 10 mmol/L MgCl2, 30 mmol/L Tris-HCl, pH 7.5, 1 mmol/L dithiothreitol, 2 mmol/L Na-ortovanadate and protease inhibitor cocktail [Sigma-Aldrich], supplemented with 1% Triton-X-100) and kept on ice for 10 minutes. Soluble extracts were separated by centrifugation at 12,000 rpm. for 10 minutes. Cell extracts were diluted in sodium dodecyl sulfate sample buffer and boiled for 5 minutes. Proteins were separated on either 10% or 8% sodium dodecyl sulfate polyacrylamide gel electrophoresis and transferred to PVDF Transfer Membrane Hybond-P (Amersham Bioscience, Little Chalfont, United Kingdom). Membranes were saturated with 5% nonfat dry milk in phosphate-buffered saline (PBS) containing 0.1% Tween 20, or with triethanolamine-buffered saline (TBS) containing 0.1% Tween 20% and 5% bovine serum albumine for 1 hour at room temperature, and incubated with each primary antibody. Secondary α-mouse or α-rabbit immunoglobulin G conjugated to horseradish peroxidase (Amersham) were incubated with the membranes for 1 hour at room temperature, at a 1:10,000 dilution in PBS or TBS containing 0.1% Tween 20. Immunostained bands were detected by chemiluminescent method (SantaCruz Biotechnology, Santa Cruz, CA).
The primary antibodies employed for Western blot analysis were rabbit anti-ERK2 (SantaCruz Biotechnology), rabbit anti-pSer473-AKT (Cell Signaling Technology), rabbit anti-pSer235/236 rpS6 (Biosource), rabbit anti-TSC2 (Cell Signaling Technology), rabbit anti-4EBP1 (Cell Signaling Technology), rabbit anti-Rheb (Cell Signaling Technology), and mouse anti-PTEN (Cell Signaling Technology).
Cell proliferation assay.
The CellTiter A96 MTS (Promega) assay was used to monitor cell viability and proliferation. Cells were plated into 96 multiwell plates in triplicate. After overnight incubation at 37°C, cells were treated at increasing doses of rapamycin or RAD001 for 72 hours. Every 24 hours, media was changed and inhibitors added. Cell proliferation and viability were measured using the CellTiter 96 Aqueous One Solution Reagent (Promega) according to the manufacturer's instructions. After 3 hours in culture, the cell viability was determined by measuring the absorbance at 490 nm. The assay was performed three times.
Flow cytometry.
At the appropriate time, cells were fixed in detached from plate and washed with PBS1X; then cells were incubated for 3 hours with 70% ethanol at 4°C. After washing, cells were incubated with RNAse A for 30 minutes at 37°C and then stained with propidium iodide (10 μg/mL) for additional 30 minutes at 37°C in the dark. Stained cells were analyzed on a FACSCalibur Flow Cytometer (Becton Dickinson, San Josè, CA).
Footnotes
Supported by Fondazione Cariverona (A.S.); Fondazione Giorgio Zanotto, Verona; Associazione Italiana Ricerca Cancro, Milan (A.S.); Fondazione Monte dei Paschi di Siena, Siena (A.S.); Ministero Università e Ricerca e Ministero Salute, Rome, Italy; and the European Community FP VI Program Grant No. PL018771 (MolDiagPaca).
Authors' disclosures of potential conflicts of interest and author contributions are found at the end of this article.
AUTHORS' DISCLOSURES OF POTENTIAL CONFLICTS OF INTEREST
The author(s) indicated no potential conflicts of interest.
AUTHOR CONTRIBUTIONS
Conception and design: Carlo M. Croce, Aldo Scarpa
Financial support: Carlo M. Croce, Aldo Scarpa
Administrative support: Irene Dalai
Provision of study materials or patients: Massimo Falconi, Lorenzo Piemonti, Gianfranco delle Fave, Paolo Pederzoli
Collection and assembly of data: Irene Dalai, Stefania Beghelli, Marco della Peruta, Alessia Di Florio
Data analysis and interpretation: Edoardo Missiaglia, Stefano Barbi, Stefania Beghelli, Massimo Falconi, Gabriele Capurso, Aldo Scarpa
Manuscript writing: Edoardo Missiaglia, Stefano Barbi, Aldo Scarpa
Final approval of manuscript: Carlo M. Croce, Aldo Scarpa
REFERENCES
- 1.Yao JC, Eisner MP, Leary C, et al. Population-based study of islet cell carcinoma. Ann Surg Oncol. 2007;14:3492–3500. doi: 10.1245/s10434-007-9566-6. [DOI] [PMC free article] [PubMed] [Google Scholar]
- 2.Kloppel G, Perren A, Heitz PU. The gastroenteropancreatic neuroendocrine cell system and its tumors: The WHO classification. Ann N Y Acad Sci. 2004;1014:13–27. doi: 10.1196/annals.1294.002. [DOI] [PubMed] [Google Scholar]
- 3.Bettini R, Boninsegna L, Mantovani W, et al. Prognostic factors at diagnosis and value of WHO classification in a mono-institutional series of 180 non-functioning pancreatic endocrine tumours. Ann Oncol. 2008;19:903–908. doi: 10.1093/annonc/mdm552. [DOI] [PubMed] [Google Scholar]
- 4.Pape UF, Jann H, Muller-Nordhorn J, et al. Prognostic relevance of a novel TNM classification system for upper gastroenteropancreatic neuroendocrine tumors. Cancer. 2008;113:256–265. doi: 10.1002/cncr.23549. [DOI] [PubMed] [Google Scholar]
- 5.Fazio N, de Braud F, Delle Fave G, et al. Interferon-alpha and somatostatin analog in patients with gastroenteropancreatic neuroendocrine carcinoma: Single agent or combination? Ann Oncol. 2007;18:13–19. doi: 10.1093/annonc/mdl144. [DOI] [PubMed] [Google Scholar]
- 6.Kwekkeboom DJ, de Herder WW, Kam BL, et al. Treatment with the radiolabeled somatostatin analog [177 Lu-DOTA 0,Tyr3]octreotate: Toxicity, efficacy, and survival. J Clin Oncol. 2008;26:2124–2130. doi: 10.1200/JCO.2007.15.2553. [DOI] [PubMed] [Google Scholar]
- 7.Panzuto F, Di Fonzo M, Iannicelli E, et al. Long-term clinical outcome of somatostatin analogues for treatment of progressive, metastatic, well-differentiated entero-pancreatic endocrine carcinoma. Ann Oncol. 2006;17:461–466. doi: 10.1093/annonc/mdj113. [DOI] [PubMed] [Google Scholar]
- 8.Toumpanakis C, Meyer T, Caplin ME. Cytotoxic treatment including embolization/chemoembolization for neuroendocrine tumours. Best Pract Res Clin Endocrinol Metab. 2007;21:131–144. doi: 10.1016/j.beem.2007.01.005. [DOI] [PubMed] [Google Scholar]
- 9.Perren A, Wiesli P, Schmid S, et al. Pancreatic endocrine tumors are a rare manifestation of the neurofibromatosis type 1 phenotype: Molecular analysis of a malignant insulinoma in a NF-1 patient. Am J Surg Pathol. 2006;30:1047–1051. doi: 10.1097/00000478-200608000-00018. [DOI] [PubMed] [Google Scholar]
- 10.Eledrisi MS, Stuart CA, Alshanti M. Insulinoma in a patient with tuberous sclerosis: Is there an association? Endocr Pract. 2002;8:109–112. doi: 10.4158/EP.8.2.109. [DOI] [PubMed] [Google Scholar]
- 11.Francalanci P, Diomedi-Camassei F, Purificato C, et al. Malignant pancreatic endocrine tumor in a child with tuberous sclerosis. Am J Surg Pathol. 2003;27:1386–1389. doi: 10.1097/00000478-200310000-00012. [DOI] [PubMed] [Google Scholar]
- 12.Verhoef S, van Diemen-Steenvoorde R, Akkersdijk WL, et al. Malignant pancreatic tumour within the spectrum of tuberous sclerosis complex in childhood. Eur J Pediatr. 1999;158:284–287. doi: 10.1007/s004310051073. [DOI] [PubMed] [Google Scholar]
- 13.Beghelli S, Pelosi G, Zamboni G, et al. Pancreatic endocrine tumours: Evidence for a tumour suppressor pathogenesis and for a tumour suppressor gene on chromosome 17p. J Pathol. 1998;186:41–50. doi: 10.1002/(SICI)1096-9896(199809)186:1<41::AID-PATH172>3.0.CO;2-L. [DOI] [PubMed] [Google Scholar]
- 14.Muscarella P, Melvin WS, Fisher WE, et al. Genetic alterations in gastrinomas and nonfunctioning pancreatic neuroendocrine tumors: An analysis of p16/MTS1 tumor suppressor gene inactivation. Cancer Res. 1998;58:237–240. [PubMed] [Google Scholar]
- 15.Bartsch D, Hahn SA, Danichevski KD, et al. Mutations of the DPC4/Smad4 gene in neuroendocrine pancreatic tumors. Oncogene. 1999;18:2367–2371. doi: 10.1038/sj.onc.1202585. [DOI] [PubMed] [Google Scholar]
- 16.Hessman O, Lindberg D, Einarsson A, et al. Genetic alterations on 3p, 11q13, and 18q in nonfamilial and MEN 1-associated pancreatic endocrine tumors. Genes Chromosomes Cancer. 1999;26:258–264. [PubMed] [Google Scholar]
- 17.Moore PS, Missiaglia E, Antonello D, et al. Role of disease-causing genes in sporadic pancreatic endocrine tumors: MEN1 and VHL. Genes Chromosomes Cancer. 2001;32:177–181. doi: 10.1002/gcc.1180. [DOI] [PubMed] [Google Scholar]
- 18.Scarpa A, Orlandini S, Moore PS, et al. Dpc4 is expressed in virtually all primary and metastatic pancreatic endocrine carcinomas. Virchows Arch. 2002;440:155–159. doi: 10.1007/s00428-001-0569-6. [DOI] [PubMed] [Google Scholar]
- 19.Maitra A, Hansel DE, Argani P, et al. Global expression analysis of well-differentiated pancreatic endocrine neoplasms using oligonucleotide microarrays. Clin Cancer Res. 2003;9:5988–5995. [PubMed] [Google Scholar]
- 20.Hansel DE, Rahman A, House M, et al. Met proto-oncogene and insulin-like growth factor binding protein 3 overexpression correlates with metastatic ability in well-differentiated pancreatic endocrine neoplasms. Clin Cancer Res. 2004;10:6152–6158. doi: 10.1158/1078-0432.CCR-04-0285. [DOI] [PubMed] [Google Scholar]
- 21.Capurso G, Lattimore S, Crnogorac-Jurcevic T, et al. Gene expression profiles of progressive pancreatic endocrine tumours and their liver metastases reveal potential novel markers and therapeutic targets. Endocr Relat Cancer. 2006;13:541–558. doi: 10.1677/erc.1.01153. [DOI] [PubMed] [Google Scholar]
- 22.Couvelard A, Hu J, Steers G, et al. Identification of potential therapeutic targets by gene-expression profiling in pancreatic endocrine tumors. Gastroenterology. 2006;131:1597–1610. doi: 10.1053/j.gastro.2006.09.007. [DOI] [PubMed] [Google Scholar]
- 23.Bloomston M, Durkin A, Yang I, et al. Identification of molecular markers specific for pancreatic neuroendocrine tumors by genetic profiling of core biopsies. Ann Surg Oncol. 2004;11:413–419. doi: 10.1245/ASO.2004.03.077. [DOI] [PubMed] [Google Scholar]
- 24.Dilley WG, Kalyanaraman S, Verma S, et al. Global gene expression in neuroendocrine tumors from patients with the MEN1 syndrome. Mol Cancer. 2005;4:9. doi: 10.1186/1476-4598-4-9. [DOI] [PMC free article] [PubMed] [Google Scholar]
- 25.Duerr EM, Mizukami Y, Ng A, et al. Defining molecular classifications and targets in gastroenteropancreatic neuroendocrine tumors through DNA microarray analysis. Endocr Relat Cancer. 2008;15:243–256. doi: 10.1677/ERC-07-0194. [DOI] [PubMed] [Google Scholar]
- 26.Piemonti L, Leone BE, Nano R, et al. Human pancreatic islets produce and secrete MCP-1/CCL2: Relevance in human islet transplantation. Diabetes. 2002;51:55–65. doi: 10.2337/diabetes.51.1.55. [DOI] [PubMed] [Google Scholar]
- 27.Team RDC. Austria: Vienna; 2005. R: A Language and Environment for Statistical Computing. [Google Scholar]
- 28.Butturini G, Bettini R, Missiaglia E, et al. Predictive factors of efficacy of the somatostatin analogue octreotide as first line therapy for advanced pancreatic endocrine carcinoma. Endocr Relat Cancer. 2006;13:1213–1221. doi: 10.1677/erc.1.01200. [DOI] [PubMed] [Google Scholar]
- 29.Hay N. The Akt-mTOR tango and its relevance to cancer. Cancer Cell. 2005;8:179–183. doi: 10.1016/j.ccr.2005.08.008. [DOI] [PubMed] [Google Scholar]
- 30.Young J, Povey S. The genetic basis of tuberous sclerosis. Mol Med Today. 1998;4:313–319. doi: 10.1016/s1357-4310(98)01245-3. [DOI] [PubMed] [Google Scholar]
- 31.Chung DC, Brown SB, Graeme-Cook F, et al. Localization of putative tumor suppressor loci by genome-wide allelotyping in human pancreatic endocrine tumors. Cancer Res. 1998;58:3706–3711. [PubMed] [Google Scholar]
- 32.Rigaud G, Missiaglia E, Moore PS, et al. High resolution allelotype of nonfunctional pancreatic endocrine tumors: Identification of two molecular subgroups with clinical implications. Cancer Res. 2001;61:285–292. [PubMed] [Google Scholar]
- 33.Eng C. PTEN: One gene, many syndromes. Hum Mutat. 2003;22:183–198. doi: 10.1002/humu.10257. [DOI] [PubMed] [Google Scholar]
- 34.Perren A, Komminoth P, Saremaslani P, et al. Mutation and expression analyses reveal differential subcellular compartmentalization of PTEN in endocrine pancreatic tumors compared to normal islet cells. Am J Pathol. 2000;157:1097–1103. doi: 10.1016/S0002-9440(10)64624-X. [DOI] [PMC free article] [PubMed] [Google Scholar]
- 35.Kaper F, Dornhoefer N, Giaccia AJ. Mutations in the PI3K/PTEN/TSC2 pathway contribute to mammalian target of rapamycin activity and increased translation under hypoxic conditions. Cancer Res. 2006;66:1561–1569. doi: 10.1158/0008-5472.CAN-05-3375. [DOI] [PubMed] [Google Scholar]
- 36.Couvelard A, O'Toole D, Turley H, et al. Microvascular density and hypoxia-inducible factor pathway in pancreatic endocrine tumours: Negative correlation of microvascular density and VEGF expression with tumour progression. Br J Cancer. 2005;92:94–101. doi: 10.1038/sj.bjc.6602245. [DOI] [PMC free article] [PubMed] [Google Scholar]
- 37.Marion-Audibert AM, Barel C, Gouysse G, et al. Low microvessel density is an unfavorable histoprognostic factor in pancreatic endocrine tumors. Gastroenterology. 2003;125:1094–1104. doi: 10.1016/s0016-5085(03)01198-3. [DOI] [PubMed] [Google Scholar]
- 38.Tuttle RL, Gill NS, Pugh W, et al. Regulation of pancreatic beta-cell growth and survival by the serine/threonine protein kinase Akt1/PKBalpha. Nat Med. 2001;7:1133–1137. doi: 10.1038/nm1001-1133. [DOI] [PubMed] [Google Scholar]
- 39.Rachdi L, Balcazar N, Osorio-Duque F, et al. Disruption of Tsc2 in pancreatic beta cells induces beta cell mass expansion and improved glucose tolerance in a TORC1-dependent manner. Proc Natl Acad Sci U S A. 2008;105:9250–9255. doi: 10.1073/pnas.0803047105. [DOI] [PMC free article] [PubMed] [Google Scholar]
- 40.Guo SS, Wu X, Shimoide AT, et al. Frequent overexpression of cyclin D1 in sporadic pancreatic endocrine tumours. J Endocrinol. 2003;179:73–79. doi: 10.1677/joe.0.1790073. [DOI] [PubMed] [Google Scholar]
- 41.Radu A, Neubauer V, Akagi T, et al. PTEN induces cell cycle arrest by decreasing the level and nuclear localization of cyclin D1. Mol Cell Biol. 2003;23:6139–6149. doi: 10.1128/MCB.23.17.6139-6149.2003. [DOI] [PMC free article] [PubMed] [Google Scholar]
- 42.Zacharek SJ, Xiong Y, Shumway SD. Negative regulation of TSC1-TSC2 by mammalian D-type cyclins. Cancer Res. 2005;65:11354–11360. doi: 10.1158/0008-5472.CAN-05-2236. [DOI] [PubMed] [Google Scholar]
- 43.Zhang H, Cicchetti G, Onda H, et al. Loss of Tsc1/Tsc2 activates mTOR and disrupts PI3K-Akt signaling through downregulation of PDGFR. J Clin Invest. 2003;112:1223–1233. doi: 10.1172/JCI17222. [DOI] [PMC free article] [PubMed] [Google Scholar]
- 44.Zhang H, Bajraszewski N, Wu E, et al. PDGFRs are critical for PI3K/Akt activation and negatively regulated by mTOR. J Clin Invest. 2007;117:730–738. doi: 10.1172/JCI28984. [DOI] [PMC free article] [PubMed] [Google Scholar]
- 45.Harrington LS, Findlay GM, Gray A, et al. The TSC1-2 tumor suppressor controls insulin-PI3K signaling via regulation of IRS proteins. J Cell Biol. 2004;166:213–223. doi: 10.1083/jcb.200403069. [DOI] [PMC free article] [PubMed] [Google Scholar]
- 46.Shah OJ, Wang Z, Hunter T. Inappropriate activation of the TSC/Rheb/mTOR/S6K cassette induces IRS1/2 depletion, insulin resistance, and cell survival deficiencies. Curr Biol. 2004;14:1650–1656. doi: 10.1016/j.cub.2004.08.026. [DOI] [PubMed] [Google Scholar]
- 47.Ma L, Teruya-Feldstein J, Behrendt N, et al. Genetic analysis of Pten and Tsc2 functional interactions in the mouse reveals asymmetrical haploinsufficiency in tumor suppression. Genes Dev. 2005;19:1779–1786. doi: 10.1101/gad.1314405. [DOI] [PMC free article] [PubMed] [Google Scholar]
- 48.Neshat MS, Mellinghoff IK, Tran C, et al. Enhanced sensitivity of PTEN-deficient tumors to inhibition of FRAP/mTOR. Proc Natl Acad Sci U S A. 2001;98:10314–10319. doi: 10.1073/pnas.171076798. [DOI] [PMC free article] [PubMed] [Google Scholar]
- 49.Podsypanina K, Lee RT, Politis C, et al. An inhibitor of mTOR reduces neoplasia and normalizes p70/S6 kinase activity in Pten+/− mice. Proc Natl Acad Sci U S A. 2001;98:10320–10325. doi: 10.1073/pnas.171060098. [DOI] [PMC free article] [PubMed] [Google Scholar]
- 50.Grozinsky-Glasberg S, Franchi G, Teng M, et al. Octreotide and the mTOR inhibitor RAD001 (everolimus) block proliferation and interact with the Akt-mTOR-p70S6K pathway in a neuro-endocrine tumour cell line. Neuroendocrinology. 2008;87:168–181. doi: 10.1159/000111501. [DOI] [PubMed] [Google Scholar]
- 51.Zitzmann K, De Toni EN, Brand S, et al. The novel mTOR inhibitor RAD001 (everolimus) induces antiproliferative effects in human pancreatic neuroendocrine tumor cells. Neuroendocrinology. 2007;85:54–60. doi: 10.1159/000100057. [DOI] [PubMed] [Google Scholar]
- 52.O'Reilly KE, Rojo F, She QB, et al. MTOR inhibition induces upstream receptor tyrosine kinase signaling and activates Akt. Cancer Res. 2006;66:1500–1508. doi: 10.1158/0008-5472.CAN-05-2925. [DOI] [PMC free article] [PubMed] [Google Scholar]
- 53.Maira SM, Stauffer F, Brueggen J, et al. Identification and characterization of NVP-BEZ235, a new orally available dual phosphatidylinositol 3-kinase/mammalian target of rapamycin inhibitor with potent in vivo antitumor activity. Mol Cancer Ther. 2008;7:1851–1863. doi: 10.1158/1535-7163.MCT-08-0017. [DOI] [PubMed] [Google Scholar]
- 54.Duran I, Kortmansky J, Singh D, et al. A phase II clinical and pharmacodynamic study of temsirolimus in advanced neuroendocrine carcinomas. Br J Cancer. 2006;95:1148–1154. doi: 10.1038/sj.bjc.6603419. [DOI] [PMC free article] [PubMed] [Google Scholar]
- 55.O'Donnell PH, Ratain MJ. Evaluating the activity of temsirolimus in neuroendocrine cancer. Br J Cancer. 2007;96:177. doi: 10.1038/sj.bjc.6603513. author reply 178–179, 2007. [DOI] [PMC free article] [PubMed] [Google Scholar]
- 56.Yao JC, Phan AT, Chang DZ, et al. Efficacy of RAD001 (everolimus) and octreotide LAR in advanced low- to intermediate-grade neuroendocrine tumors: Results of a phase II study. J Clin Oncol. 2008;26:4311–4318. doi: 10.1200/JCO.2008.16.7858. [DOI] [PMC free article] [PubMed] [Google Scholar]
- 57.Olsen SK, Garbi M, Zampieri N, et al. Fibroblast growth factor (FGF) homologous factors share structural but not functional homology with FGFs. J Biol Chem. 2003;278:34226–34236. doi: 10.1074/jbc.M303183200. [DOI] [PubMed] [Google Scholar]
- 58.Schoorlemmer J, Goldfarb M. Fibroblast growth factor homologous factors and the islet brain-2 scaffold protein regulate activation of a stress-activated protein kinase. J Biol Chem. 2002;277:49111–49119. doi: 10.1074/jbc.M205520200. [DOI] [PMC free article] [PubMed] [Google Scholar]
- 59.Bernards R, Weinberg RA. A progression puzzle. Nature. 2002;418:823. doi: 10.1038/418823a. [DOI] [PubMed] [Google Scholar]