

Abstract
Staphylococcus aureus is responsible for a large number of diverse infections worldwide. In order to support its pathogenic lifestyle, S. aureus has to regulate the expression of virulence factors in a coordinated fashion. One of the central regulators of the S. aureus virulence regulatory networks is the transcription factor repressor of toxin (Rot). Rot plays a key role in regulating S. aureus virulence through activation or repression of promoters that control expression of a large number of critical virulence factors. However, the mechanism by which Rot mediates gene regulation has remained elusive. Here, we have determined the crystal structure of Rot and used this information to probe the contribution made by specific residues to Rot function. Rot was found to form a dimer, with each monomer harboring a winged helix-turn-helix (WHTH) DNA-binding motif. Despite an overall acidic pI, the asymmetric electrostatic charge profile suggests that Rot can orient the WHTH domain to bind DNA. Structure-based site-directed mutagenesis studies demonstrated that R91, at the tip of the wing, plays an important role in DNA binding, likely through interaction with the minor groove. We also found that Y66, predicted to bind within the major groove, contributes to Rot interaction with target promoters. Evaluation of Rot binding to different activated and repressed promoters revealed that certain mutations on Rot exhibit promoter-specific effects, suggesting for the first time that Rot differentially interacts with target promoters. This work provides insight into a precise mechanism by which Rot controls virulence factor regulation in S. aureus.
INTRODUCTION
Staphylococcus aureus, a leading cause of hospital-acquired infections, is an opportunistic Gram-positive pathogenic bacterium able to infect diverse body tissues and manifest in a variety of disease states such as osteomyelitis, endocarditis, sepsis, and toxic shock syndrome, among others (1–3). S. aureus has adapted to circumvent therapeutic strategies by developing resistance to antibiotics (4, 5). These resistant strains were initially observed in hospital settings but are now prevalent in the community, infecting otherwise healthy individuals (6). The ability of S. aureus to evolve in response to therapeutic efforts has resulted in strains resistant to vancomycin, which was previously used as a drug of last resort (7). Thus, this versatile pathogen presents a great challenge to human health, creating an urgent need for the development of new therapeutics to combat infections.
S. aureus can modify gene transcription for optimal pathogenesis by way of temporal control of virulence factors in response to quorum sensing via the accessory gene regulatory system (Agr) (8–10). The receptor kinase of the Agr two-component system (TCS), AgrC, is engaged by the autoinducing peptide (AIP), the extracellular concentration of which is proportional to the density of the bacteria within a certain radius. AgrC, in turn, activates the response regulator, AgrA, to regulate target genes (11). Once a concentration threshold of AIP is reached, usually at late exponential phase, Agr is activated, altering virulence factor expression (9). Activation of Agr results in the upregulation of a regulatory RNA molecule known as RNAIII (12–14). This molecule interacts with target mRNAs, resulting in either degradation of the transcript or exposure of the Shine-Dalgarno sequence and increased translation (14–18). One of the best-characterized targets of RNAIII is the SarA family member repressor of toxin (Rot) (15, 16, 19). Interaction of RNAIII with rot mRNA results in degradation of the transcript and a reduction of Rot in the bacteria (15, 16), leading to changes in virulence factor expression, including the downregulation of cell wall-associated proteins (including protein A, fibrinogen, and fibronectin binding proteins) and upregulation of secreted factors (such as hemolysins and proteases) (19, 20). By way of this system, S. aureus is thought to synchronize its patterns of virulence expression on a population-wide scale during infection (9, 21).
Rot was originally identified in a transposon screen as a repressor of hla, which encodes the alpha-toxin (19). Mutation of the rot locus is associated with increased virulence in a rabbit endocarditis model of infection and in a murine bacteremia model (22, 23). Transcriptional profiling studies demonstrated that Rot regulates 146 genes, serving as a repressor of 60 and an activator of 86 (20). Rot is known to have direct and specific interactions with several target promoters to regulate gene expression, notably those of hla (20, 22); ssl7, which encodes a staphylococcal superantigen-like protein (24); and seb, encoding enterotoxin B (25). Importantly, Rot can act as either an activator or a repressor of target promoters, activating genes such as ssl7 and spa, encoding staphylococcal protein A, and repressing genes such as hla and lukED, which encodes a pore-forming toxin. However, how Rot differentiates among these promoters is not known.
Rot is a member of the SarA family of transcription regulators (26). The SarA family was first identified by sequence-based homology studies, with all family members containing a conserved sequence motif, KXRXXXDER (26). Previous sequence and structural analyses of several family members have shown that all possess a winged helix-turn-helix (WHTH) domain, a variation of the classical DNA-binding helix-turn-helix (HTH) motif (27). The prototypic members of the HTH family are the well-known λ phage proteins Cro and the catabolite activator protein (CAP) from Escherichia coli, in which the C-terminal recognition helix (RH) was demonstrated to project into the major groove of DNA (28–30). Further structure-based analyses classified SarA family members into three groups: (i) single-domain structures (SarA, SarR, SarT, SarV, SarX, and Rot), (ii) two-domain structures (SarS, SarU, and SarY), and (iii) single-domain structures that are highly homologous to the MarR family (SarZ, MgrA, and homologues) (26).
Rot is a unique member of the SarA family because it has a very acidic sequence and does not contain any cysteine residues (26). The aim of this work was to combine structural and functional analyses to uncover the molecular means of Rot-mediated regulation. To this end, we determined a crystal structure of Rot and used this information to predict residues involved in DNA binding. Construction and characterization of mutants to probe the contribution made by specific residues resulted in identification of key residues necessary for Rot binding and function. Our results provide important insights into how Rot is able to orient itself to DNA and bind to and make selective contact with specific promoters.
MATERIALS AND METHODS
Bacterial strains and culture conditions.
Strains used in this study are described in Table 1. S. aureus strains were grown at 37°C with shaking at 180 rpm in tryptic soy broth (TSB) or in Roswell Park Memorial Institute medium (RPMI) supplemented with 1% Casamino Acids (RPMI/CAS). When indicated, TSB and RPMI were supplemented with chloramphenicol (Cm) to a final concentration of 10 μg/ml. E. coli DH5α was grown in Luria-Bertani broth (LB) at 37°C with shaking at 180 rpm. When necessary, LB was supplemented with ampicillin (Amp) to a final concentration of 100 μg/ml.
TABLE 1.
Bacterial strains used in this study
| Strain | Background | Description | Genotype | Reference |
|---|---|---|---|---|
| RN4220 | 8325-4 | Restriction-deficient cloning host | 54 | |
| RN9011 | RN4220 | RN4220 containing the pRN7023 vector encoding the SaPI integrase | 55 | |
| VJT 1.01 | Newman | Wild type | Wild type | 56 |
| VJT 34.79 | VJT 1.01 | Newman wild type containing the ssl7 promoter driving gfp expression integrated into the chromosome | Wild type | This study |
| VJT 9.98 | VJT 1.01 | Transduction of rot::Tn917 from RN10623 into VJT 1.01 | rot::Tn917 | 24 |
| VJT 34.84 | VJT 9.98 | Newman rot::Tn917 containing the ssl7 promoter driving gfp expression integrated into the chromosome | rot::Tn917 | This study |
Rot production.
Recombinant Rot protein was produced as previously described by Benson et al. (31). Briefly, the rot gene with an additional C-terminal His tag was cloned into the pET41b expression vector and was transformed into the E. coli expression strain T7 lysY/Iq (NEB). To produce a selenomethionine (SeMet) derivative, cells were initially grown in a mixture of base-nutrient mix-methionine (Molecular Dimensions) and antibiotics at 37°C with shaking at 220 rpm until the cell density reached an A600 of 0.8. Cells were isolated by centrifugation at 5,000 rpm, washed with medium, and resuspended in a mixture of base-nutrient mix-selenomethionine (Molecular Dimensions) and antibiotics. Protein expression was induced with IPTG (isopropyl-β-d-thiogalactopyranoside) for 3 h. Cells were collected from the medium by centrifugation at 5,000 rpm, resuspended in Tris-buffered saline (TBS) supplemented with 10 mM imidazole and an EDTA-free protease inhibitor, and then lysed by sonication on ice. Soluble proteins were isolated from cellular debris by centrifugation at 15,000 rpm. The recombinant Rot protein was further purified by nickel-nitrilotriacetic acid (Ni-NTA) chromatography and eluted with 500 mM imidazole.
Crystallization, data collection, structure determination, and refinement.
Purified Rot protein was assayed by size exclusion chromatography for purity and homogeneity. Native and selenomethionine-labeled (SeMet) Rot proteins were concentrated to 6 and 2.5 mg/ml for crystallization, respectively. Both native and SeMet crystals were obtained by hanging drop vapor diffusion over reservoirs containing 10% polyethylene glycol (PEG) 6000, 0.7 M LiCl, and 0.2 M citric acid, pH 5. Single crystals were briefly soaked in the mother liquor supplemented with 20% (vol/vol) 2-methyl-2,4-pentanediol (MPD) prior to being flash cooled in liquid nitrogen. Both native and multiwavelength anomalous dispersion (MAD) diffraction data were collected at beamline X6A, National Synchrotron Light Source, Brookhaven National Laboratory. The native data set was collected from a single crystal at a wavelength of 1.0 Å. All three MAD data sets were collected from a single SeMet crystal at energies of 12,656 eV (inflection point), 12,661 eV (peak), and 13,580 eV (high-energy remote), based on a fluorescence scan of the Se absorption K edge. All four data sets were comprised of 360 images collected in a stream of gaseous nitrogen at 100 K and with a 1° oscillation for each frame. Full data-collection statistics are given in Table 2. Each data set was processed separately, first integrated using iMosflm (32) and then merged and scaled using POINTLESS and SCALA from the CCP4 suite (33). The 3 MAD data sets were combined using CAD and normalized using Scaleit in CCP4 (34). The SHELXCDE set of programs (35) was used to determine the selenium substructure and calculate the initial phase; a model was built into the resultant electron density using BUCCANEER (36) in CCP4. This initial MAD-phased model was improved by alternating cycles of real-space fitting and restrained refinement against the native data set using Coot (37) and Refmac5 (38), using automatically generated NCS restraints. Final restrained refinement was done with PHENIX Refine (39). Structural figures were generated using PyMOL (40) and ICM (41). Buried surface area and dimerization calculations were done with the PISA server (42).
TABLE 2.
Data collection and refinement statisticsb
| Statistic type | Native | Selenomethionine derivative |
||
|---|---|---|---|---|
| Peak | Remote | Inflection | ||
| Data collection | ||||
| Wavelength (Å) | 1.0 | 0.9793 | 0.913 | 0.9797 |
| Space group | P1 | P1 | P1 | P1 |
| Cell dimensions | ||||
| a, b, c | 31.56, 37.53, 63.91 | 31.70, 38.13, 64.08 | 31.73, 38.22, 64.13 | 31.71, 38.17, 64.19 |
| Alpha, beta, gamma | 85.45, 82.26, 81.26 | 85.60, 82.06, 81.54 | 85.64, 82.10, 81.28 | 85.56, 82.06, 81.45 |
| Resolution range (Å) | 37.03–1.7 (1.79–1.7)a | 37.65–1.86 (1.96–1.86) | 37.72–1.73 (1.82–1.73) | 37.68–1.86 (1.96–1.86) |
| No. of total reflections | 113,354 (15,961) | 92,762 (13,115) | 114,487 (16,212) | 93,035 (13,094) |
| No. of unique reflections | 29,564 (4,221) | 23,720 (3,384) | 29,331 (4,195) | 23,733 (3,384) |
| Rsym (%) | 0.074 (0.424) | 0.081 (0.617) | 0.092 (0.858) | 0.070 (0.645) |
| Mean I/sigma(I) | 10.8 (2.8) | 9.4 (1.7) | 7.6 (0.8) | 10.8 (1.6) |
| Multiplicity | 3.8 (3.8) | 3.9 (3.9) | 3.9 (3.9) | 3.9 (3.9) |
| Completeness (%) | 93.7 (91.7) | 95.6 (93.5) | 95.4 (93.3) | 95.3 (93.1) |
| Refinement | ||||
| Resolution (Å) | 31.6/1.7 | |||
| R-factor | 0.19 (0.27) | |||
| R-free | 0.21 (0.32) | |||
| No. of atoms | 2,589 | |||
| Macromolecules | ||||
| Protein | 2,168 | |||
| Ligand/ion | 2 | |||
| Water | 419 | |||
| Protein residues | 262 | |||
| B-factors | 29.7 | |||
| Protein | 28.1 | |||
| Solvent | 37.8 | |||
| RMSD | ||||
| Bond lengths (Å) | 0.006 | |||
| Bond angles (°) | 0.879 | |||
| Ramachandran favored (%) | 98.6 | |||
| Ramachandran outliers (%) | 0.39 | |||
| Clash score | 5.57 | |||
Values in parentheses are stated for the highest-resolution bin for each structure.
Data collection statistics are shown for the native data set and those used for MAD phasing (peak, inflection, and remote). The final model was refined against the native set.
Generation of site-directed Rot mutants.
Plasmids expressing site-directed Rot mutations F10A/L13A/Q14A/T17A, S36A/E38A/E39A, Q48A, L54A/K55A, K64A-R70A, T71A/N74A, R91A, and L41A/L44A were generated by using a PCR splicing by overlap extension (SOE) approach. Primers are described in Table 3, and plasmids are listed in Table 4. The mutated PCR products were digested with NdeI and XhoI and then ligated into the E. coli/S. aureus shuttle vector pOS1Plgt, which had been similarly digested. Point mutants F10A, L13A, Q14A, Q14E, T17A, E39A, Y66A, K67A, N74A, and ΔHis were generated by site-directed mutagenesis directly on the pOS1Plgt rot plasmid via a QuikChange kit (Agilent). The ligation products were then transformed into E. coli DH5α. Resulting plasmids were sequenced to confirm that desired mutations were present.
TABLE 3.
Primers used in this study
| Primer no. | Name | Sequence | Description |
|---|---|---|---|
| 341 | pssl7-F-PstI | 5′-CCCC-CTGCAG-GCAGACTAGTAATTGTAGGG | Pssl7-sGFP reporter |
| 489 | sGFP-R-BamHI | 5′-CCC-GGATCC-TTAGTGGTGGTGGTGGTGG | Pssl7-sGFP reporter |
| 1118 | Rot-Mut1-F-NdeI | 5′-CCCCCATATGATGAAAAAAGTAAATAACGACACTGTAGCAGGAATTGCAGCATTAGAAGCACTTTTGG | Forward primer to make a Rot F10A/L13A/Q14A/T17A mutant; use with primer 311 to clone into pOS1Plgt |
| 1120 | Rot-Mut3-F | 5′-CAAAATGGCAAGAGCAGCAATTTTAATTTTACTAAC | Forward SOEing primer to make a Rot S36A/E38A/E39A mutant; use with primer 311 |
| 1121 | Rot-Mut3-R | 5′-GTTAGTAAAATTAAAATTGCTGCTCTTGCCATTTTG | Reverse SOEing primer to make a Rot S36A/E38A/E39A mutant; use with primer 313 |
| 1122 | Rot-Mut4-F | 5′-CTTTATGGGCAAAAGGTTCTATGAC | Forward SOEing primer to make a Rot Q48A mutant; use with primer 311 |
| 1123 | Rot-Mut4-R | 5′-GTCATAGAACCTTTTGCCCATAAAG | Reverse SOEing primer to make a Rot Q48A mutant; use with primer 313 |
| 1124 | Rot-Mut5-F | 5′-GGTTCTATGACGGCAGCAGAAATGGAC | Forward SOEing primer to make a Rot L54A/K55A mutant; use with primer 311 |
| 1125 | Rot-Mut5-R | 5′-GTCCATTTCTGCTGCCGTCATAGAACC | Reverse SOEing primer to make a Rot L54A/K55A mutant; use with primer 313 |
| 1126 | Rot-Mut6-F | 5′-GATTTGTTGAAGCAGCAGCAGCAGCAGCAGCAGCAACGTATAATAATTTAG | Forward SOEing primer to make a Rot K64A/P65A/Y66A/K67A/R68A/T69A/R70A mutant; use with primer 311 |
| 1127 | Rot-Mut6-R | 5′-CTAAATTATTATACGTTGCTGCTGCTGCTGCTGCTGCTGCTTCAACAAATC | Reverse SOEing primer to make a Rot K64A/P65A/Y66A/K67A/R68A/T69A/R70A mutant; use with primer 313 |
| 1128 | Rot-Mut7-F | 5′-CGAGAGCATATAATGCATTAGTTGAATTAG | Forward SOEing primer to make a Rot T71A/N74A mutant; use with primer 311 |
| 1129 | Rot-Mut7-R | 5′-CTAATTCAACTAATGCATTATATGCTCTCG | Forward SOEing primer to make a Rot T71A/N74A mutant; use with primer 313 |
| 1132 | Rot-Mut9-F | 5′-GACGATGAAGCAACAGTTATTATTC | Forward SOEing primer to make a Rot R91A mutant; use with primer 311 |
| 1133 | Rot-Mut9-R | 5′-GAATAATAACTGTTGCTTCATCGTC | Reverse SOEing primer to make a Rot R91A mutant; use with primer 313 |
| 1137 | Rot-Mut13-F | 5′-GAAGAAATTGCAATTTTAGCAACTTTATGGC | Forward SOEing primer to make a Rot L41A/L44A mutant; use with primer 311 |
| 1138 | Rot-Mut13-R | 5′-GCCATAAAGTTGCTAAAATTGCAATTTCTTC | Reverse SOEing primer to make a Rot L41A/L44A mutant; use with primer 313 |
| 311 | rot-6×His–3′-RXhoI | 5′-CCCCTCGAG-TTAGTGATGGTGATGGTGATG-CACAGCAATAATTGCGTTTAAAC | Reverse primer to clone rot into pOS1-Plgt |
| 313 | rot5′F-NdeI | 5′-CCCC-CATATG-AAAAAAGTAAATAACGACACTG | Forward primer to clone rot downstream of the lgt promoter in the pOS1-Plgt plasmid. |
| 270 | hla P1-RT | 5′-AAAAAACTGCTAGTTATTAGAACGAAAGG | qRT-PCR analysis of hla |
| 271 | hla P2-RT | 5′-GGCCAGGCTAAACCACTTTTG | qRT-PCR analysis of hla |
| 278 | 16S P1-RT | 5′-TGAGATGTTGGGTTAAGTCCCGCA | qRT-PCR analysis of 16S rRNA |
| 279 | 16S P2-RT | 5′-CGGTTTCGCTGCCCTTTGTATTGT | qRT-PCR analysis of 16S rRNA |
| 280 | ssl7 P1-RT | 5′-AACGTTAGCTAAAGCAACATTGGC | qRT-PCR analysis of ssl7 |
| 281 | ssl7 P2-RT | 5′-TTGCTTGAACTGCTTGGCCTTCTG | qRT-PCR analysis of ssl7 |
| 290 | spA1P1-RT | 5′-CAGCAAACCATGCAGATGCTA | qRT-PCR analysis of spa |
| 291 | spA2P2-RT | 5′-GCTAATGATAATCCACCAAATACAGTTG | qRT-PCR analysis of spa |
| 370 | lukE-P1 | 5′-GAAATGGGGCGTTACTCAAA | qRT-PCR analysis of lukE |
| 371 | lukE-P2 | 5′-GAATGGCCAAATCATTCGTT | qRT-PCR analysis of lukE |
| 305 | pssl7-R-BIO | 5′-BIO-CCCC-AGTACTATTCTCCCAATCTATTT | Biotinylated primer for EMSA probe amplification |
| 341 | pssl7-F | 5′-CCCC-CTGCAG-GCAGACTAGTAATTGTAGGG | EMSA probe amplification |
| 736 | plukED-F-BIO | 5′-BIO-AAGTTTCACTTTCTTTCTATATAAAT | Biotinylated primer for EMSA probe amplification |
| 397 | plukED-R | 5′-CCC-CTGCAG-ATCTTCGTTTAACGGACAATAG | EMSA probe amplification |
TABLE 4.
Plasmids used in this study
| Name | Description | Resistance | Reference |
|---|---|---|---|
| pOS1sGFP-Pssl7-sodRBS | ssl7 promoter and sod RBSa driving sGFP expression | Cm | 24 |
| pJC1111 | Suicide vector used for integration into the SaP-1 site | Cd | 57 |
| pJC1111 Pssl7-sodRBS-sGFP | ssl7 promoter and sod RBS driving sGFP expression cloned into the pJC1111 suicide vector | Cd | This study |
| pRN7023 | Vector encoding the SaP-1 integrase | Cm | 55 |
| pOS1Plgt | lgt promoter in an empty vector | Cm | 45 |
| pOS1Plgt rot | lgt promoter driving rot expression | Cm | 24 |
| pOS1Plgt rot F10A/L13A/Q14A/T17A | lgt promoter driving rot F10A/L13A/Q14A/T17A expression | Cm | This study |
| pOS1Plgt rot S36A/E38A/E39A | lgt promoter driving rot S36A/E38A/E39A expression | Cm | This study |
| pOS1Plgt rot Q48A | lgt promoter driving rot Q48A expression | Cm | This study |
| pOS1plgt rot L54A/K55A | lgt promoter driving rot L54A/K55A expression | Cm | This study |
| pOS1Plgt rot K64A/P65A/Y66A/K67A/R68A/T69A/R70A | lgt promoter driving rot K64A/P65A/Y66A/K67A/R68A/T69A/R70A expression | Cm | This study |
| pOS1Plgt rot T71A/N74A | lgt promoter driving rot T71A/N74A expression | Cm | This study |
| pOS1Plgt rot R91A | lgt promoter driving rot R91A expression | Cm | This study |
| pOS1Plgt rot L41A/L44A | lgt promoter driving rot L41A/L44A expression | Cm | This study |
| pET41b rot6xhis | rot expression vector | Kan | 31 |
RBS, ribosome binding site.
Construction of an integrated ssl7 transcriptional reporter S. aureus strain.
Integration of the ssl7 promoter (Pssl7) driving enhanced green fluorescent protein (sGFP) expression into the S. aureus chromosome was performed by cloning the construct into the suicide plasmid pJC1111, which stably integrates into the SaPI-1 site of S. aureus, resulting in single-copy insertion into the chromosome. Primers are described in Table 3. A PCR amplicon containing Pssl7 driving sGFP expression was amplified from pOS1sGFP Pssl7-sodRBS and was subsequently digested and cloned into pJC1111 (24). Integration was initially carried out in RN4220 containing plasmid pRN7203, which encodes the integrase. Phage transduction was employed to generate Newman wild-type (WT) and mutant rot strains with the Pssl7-sGFP transcriptional reporter integrated into the chromosome.
GFP reporter assays.
GFP reporter assays were performed as previously described (24). Briefly, S. aureus cultures grown overnight in RPMI/CAS plus 10 μg/ml Cm were subcultured 1:100 in 5 ml RPMI/CAS plus 10 μg/ml Cm and grown at 37°C and 180 rpm. Optical density at 600 nm (OD600) and GFP fluorescence were measured 5 h postsubculture using a PerkinElmer Envision 2103 multilabel reader.
RNA isolation.
S. aureus cultures grown in RPMI/CAS plus 10 μg/ml Cm overnight were diluted to 1:100 in 20 ml RPMI/CAS plus 10 μg/ml Cm and grown at 37°C with shaking at 180 rpm for 5 h. Cultures were mixed with an equal volume of 1:1 ethanol-acetone and frozen at −80°C. For RNA extraction, frozen cultures were thawed on ice and cells were pelleted by centrifugation and washed twice with Tris-EDTA (TE). Cells were transferred to MP Biomedicals Lysing Matrix B 2-ml tubes and lysed using the FastPrep-24 tissue and cell homogenizer for 40 s (MP Biomedicals, Solon, OH). Cell debris was removed by centrifugation. RNA was isolated from lysates using the RNeasy minikit (Qiagen, Valencia, CA) according to the manufacturer's instructions. On-column DNase digestion was performed using an RNase-free DNase set (Qiagen, Valencia, CA). A second DNase digestion was performed after RNA elution using RQ1 DNase I (Promega, Madison, WI). RNA was quantified using a NanoDrop spectrophotometer, and quality was evaluated on an agarose-formaldehyde gel.
Quantitative reverse transcriptase PCR (qRT-PCR).
One hundred nanograms purified RNA was used in a SYBR green-based comparative threshold cycle (CT) assay (Qiagen, Valencia, CA) in a 7300 real-time PCR system (Applied Biosystems, Carlsbad, CA) to determine relative quantification of gene transcription from ssl7, spa, hla, and lukE. Ten nanograms purified RNA was used to examine amplification of 16S rRNA as an endogenous control. Primers used to detect transcripts are listed in Table 3. Relative quantification of gene expression was determined for duplicate reaction mixtures of each strain using the 7300 real-time quantitative PCR software (Applied Biosystems, Carlsbad, CA). Relative gene expression was determined by comparing all strains to an isogenic strain that does not produce Rot or an isogenic strain that produces wild-type Rot.
Purification of Rot-His from S. aureus.
S. aureus Newman rot::spec strains carrying plasmid pOS1/Plgt-Rot-His mutants were grown overnight in TSB plus 10 μg/ml Cm and then subcultured 1:100 into 400 ml TSB plus 10 μg/ml Cm and grown for 5 h at 37°C with shaking at 180 rpm. Cells were pelleted by centrifugation at 4,000 rpm for 30 min and washed once with TSM (50 mM Tris-HCl, pH 7.5, 0.5 M sucrose, 10 mM MgCl2). Pellets were resuspended in 20 ml TSM plus 25 μg/ml lysostaphin. Suspensions were incubated at 37°C for 10 min. Cells were pelleted by centrifugation at 4,000 rpm for 15 min and washed once with TSM. Pellets were resuspended in 40 ml TBS supplemented with 10 mM imidazole and an EDTA-free protease inhibitor. Cells were lysed by sonication on ice. Soluble proteins were isolated from cellular debris by centrifugation at 20,000 rpm for 20 min at 4°C. Rot was selectively purified by Ni-NTA chromatography and elution with 500 mM imidazole.
EMSA.
The regions upstream of lukED and ssl7 were amplified using biotinylated primers listed in Table 3 to generate DNA probes between 300 and 400 bp in length. One hundred femtomoles of biotinylated probes was mixed with 2 μg Rot-His for a total reaction volume of 20 μl in electrophoretic mobility shift assay (EMSA) buffer (10 mM Tris-HCl, pH 7.4, 50 mM KCl, 5 mM MgCl2, 10% glycerol, 5 μg/ml salmon sperm DNA). Reaction mixtures were incubated at room temperature for 20 min. Samples were analyzed on 6% native polyacrylamide gels run at 10 mA per gel in Tris-borate EDTA (TBE). Gels were incubated for 15 min in 50% isopropyl alcohol (IPA)-5% acetic acid, followed by 15 min in distilled water (dH2O). Gels were developed by incubation for 1 h in streptavidin DyLight (Thermo Scientific, Waltham, MA) diluted 1:1,000 in phosphate-buffered saline (PBS) plus 0.1% Tween plus 5% bovine serum albumin (BSA). Gels were imaged using an Odyssey infrared imaging system (Li-Cor Biosciences, Lincoln, NE).
Protein structure accession number.
The atomic coordinates and structure factors for the Rot structure have been deposited in the RCSB Protein Data Bank (PDB) with accession code 4RBR.
RESULTS
X-ray structure determination.
To gain insight into how Rot mediates promoter recognition, we solved a crystal structure of Rot by the multiwavelength anomalous dispersion (MAD) method using a selenomethionine (SeMet) derivative. The presence of SeMet in the crystal was confirmed by fluorescence spectroscopy, and four selenium sites of each molecule were identified. The resulting experimental phases were used as initial phases in a restrained refinement against the native diffraction data set of 1.7-Å resolution. Rot was crystallized in space group P1, with unit cell lengths of 31.6, 37.5, and 63.9 Å and angles of 85.5, 82.3, and 81.3 degrees, and its structure was refined to Rwork and Rfree of 18.74% and 21.26%, respectively (Table 2). The final model contains residues 6 to 133 along with 3 additional C-terminal His residues from a poly-His tag (Fig. 1). A chloride ion, located between the helix-turn-helix (HTH) and the wing and coordinated by backbone amides, was refined into the final model for each monomer (Fig. 1A).
FIG 1.

Rot structure. (A) The Rot dimer is shown in a ribbon representation from a side view. Monomers are colored in either cyan or green. The chloride ion is represented as a magenta sphere. (B) The sequence of the region in the crystal structure from residues 6 to 133 plus three residues from the 6×His tag is shown with the secondary structure elements, including five α-helices and a two-stranded β-sheet. The structural motifs are color coded: the dimerization core helices (α1, α2, and α5) in green, the helix-turn-helix (HTH) (α3 and α4) containing the recognition helix (RH) (α4) in magenta, and the wing (β1 and β2) in dark blue. The underlined residues make dimerization contacts. Red residues are predicted to make contact with protein partners, purple residues are predicted to make nonspecific contact with DNA, and orange residues are predicted to make specific contact with DNA. (C) Structural motifs listed in panel B are shown on the Rot monomer. (D) The Rot dimer is shown in a B-factor putty representation where the thickness of a region is proportional to its local B-factor and thus its flexibility.
Overall structure of the Rot dimer.
The structure shows Rot as a noncrystallographic dimer (Fig. 1A), with two dimers in the asymmetric unit. When superimposed, the two monomers are nearly identical, with an interchain Cα root mean square deviation (RMSD) of 0.21 Å (without 3 residues at the tip of the wing that have different conformations between the monomers). The Rot structure is largely helical, with 5 alpha helices (α1 to α5) and a single 2-stranded (β1 and β2) beta sheet for each monomer (Fig. 1B). It is composed of 3 distinct structural regions (Fig. 1B and C): the HTH motif, the wing, and the dimerization helices. The HTH motif is composed of two helices (α3 and α4) connected by a short loop. The C-terminal portion of this motif is termed the recognition helix (RH; α4) and is likely to make specific contacts with the backbone and bases of the major groove of DNA (28–30). The wing region of Rot consists of the two β-strands (β1 and β2), connected by an 11-residue flexible loop with a high crystallographic B-factor and slightly different conformations at the loop tips (Fig. 1D). The two long helices, N-terminal α1 and C-terminal α5, as well as helix α2 located below the HTH motif from each monomer, join together to form a head-to-head dimer with 2-fold symmetry about a vertical axis at the center of the dimer. The long α1 and α5 from each monomer come together to form a 4-helix bundle, creating an extensive hydrophobic interface between the monomers with a buried surface area of ∼1,800 Å2 (Fig. 2A). There are also hydrogen bonds and water-mediated interactions between the monomers (Fig. 2B), including the formation of a water-mediated hydrogen bond network between the side chain of E16 of one monomer and the side chains of R37 of the other monomer (Fig. 2C) and hydrogen bonds between the side chains of the symmetry-related Q124 from each monomer (Fig. 2D).
FIG 2.
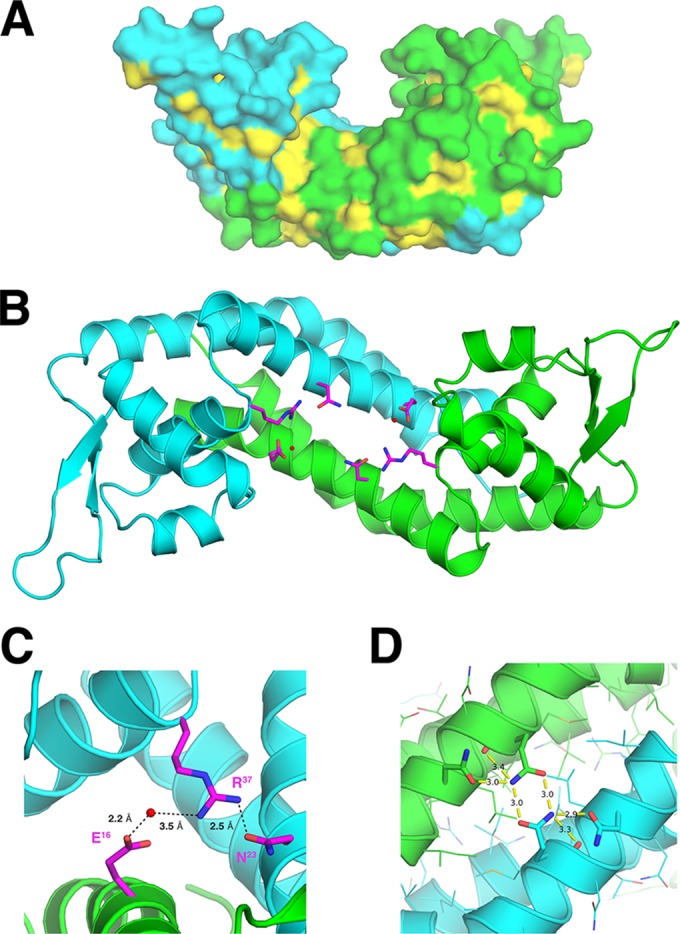
Hydrophobic dimerization interface and hydrogen bonds in the Rot dimer. (A) Surfaces of Rot molecules. The two monomers in the Rot dimer are colored cyan and green, respectively, and the hydrophobic residues are depicted in yellow. (B) Water-mediated contacts span the Rot dimerization interface. The side chains of residues that extend across the dimerization interface are colored in magenta. The key water molecules that participate in dimerization are shown as small red spheres. (C) Closeup view of panel B in which hydrogen bonds are shown as black dotted lines. (D) Closeup view of the hydrogen bonds formed between the side chains of the symmetry-related Q124 from each Rot monomer.
The Rot dimer has a highly negatively charged surface (Fig. 3A), consistent with its acidic pI of 5.1, which is 2 pH units below that of any other SarA family member and more than 3 pH units below the family average pI of 8.2. There are 21 negatively and 17 positively charged residues per monomer, with 2 N-terminal lysine residues not observed in the crystal structure. The majority of the positively charged residues are located in the WHTH domain, rendering it overall positively charged, consistent with its DNA-binding function. The dimerization helices are negatively charged; they, together with the positively charged WHTH domains, create an asymmetric charge distribution that would help to orient the WHTH domains in the Rot dimer toward the negatively charged phosphate backbone of the target DNA. A comparison of Rot's structure to those of other SarA family members and WHTH-containing proteins showed a correlation between sequence conservation and charge distributions. Sequence conservation mapping indicates this group of proteins to be most conserved in the WHTH region and least conserved in the dimerization helices on the underside of the dimer (Table 5; Fig. 3B and C). Interestingly, among the SarA family and other WHTH proteins, the electrostatic profile mimics the conservation profile, i.e., the surfaces of conserved residue regions are also positively charged and vice versa (Fig. 3A and C).
FIG 3.
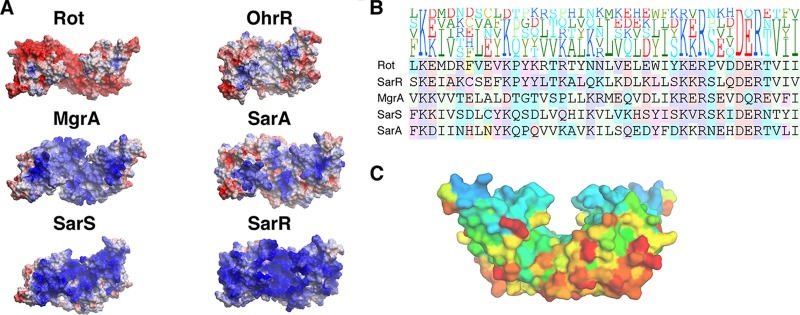
Surface charge distribution and sequence conservation among SarA family members. (A) Electrostatic profiles of SarA family proteins. The electrostatic surface potentials of each protein are colored by charge, with blue representing positive and red representing negative charge. Proteins are oriented with their WHTH facing forward. Proteins are depicted from most to least acidic isoelectric point (left to right, top to bottom). (B) Sequence alignment of WHTH domains of SarA family members. The height of each letter in the top portion of the figure represents the prevalence of that amino acid at the particular position. (C) Sequence conservation of SarA family members projected onto Rot surface. Each residue on the surface of Rot is colored according to sequence conservation, with blue representing the most and red the least conserved. Sequence conservation was defined by alignment generated by BLAST. The figure was generated by the ConSurf program (53).
TABLE 5.
Sequence and structural comparison of Rot to SarA and WHTH proteinsa
| Protein | PDB ID | Identity (%) |
RMSD (Å) |
pI | ||
|---|---|---|---|---|---|---|
| Entire protein | WHTH region | Monomer | WHTH region | |||
| Rot | 4RBR | 5.1 | ||||
| SarA family members | ||||||
| SarA | 2FNP | 19 | 26 | 4.6 | 2.4 | 7.8 |
| SarR | 1HSJ | 22 | 40 | 6.3 | 1.7 | 9.3 |
| SarS | 1P4X | 19 | 21 | 5.5 | 2.3 | 8.9 |
| MgrA | 2BV6 | 14 | 17 | 5.6 | 1.9 | 7.0 |
| DNA complexes | ||||||
| OhrR | 1Z9C | 13 | 24 | 3.7 | 2.1 | 6.3 |
| SlyA | 3Q5F | 8.3 | 14 | 6.1 | 2.3 | 6.2 |
| MecI | 1SAX | 5.7 | 7.3 | 7.2 | 2.4 | 8.9 |
| IscR | 4HF1 | 2.3 | 7.5 | 5.7 | 2.7 | 6.8 |
| RTP | 1F4K | 4.1 | 11.9 | 7.2 | 3.7 | 9.5 |
Rot's sequence and structure are compared to those of other SarA family members and several WHTH-containing proteins whose structures were solved in complex with DNA. Tabulated data shown with respect to Rot are the Protein Data Bank (PDB) identifier (ID) of each structure, the sequence identity of the entire protein, the sequence identity of the WHTH region defined by structural alignment, the root mean square deviation (RMSD) of the monomer (in the case of 1P4X, only the protein which corresponds to one Rot monomer was compared), the RMSD of the WHTH region defined by structural alignment, and the isoelectric point of each protein defined by the whole-protein sequence.
Structural implication of Rot's DNA binding.
To understand how Rot interacts with DNA, we superimposed its structure with that of other WHTH proteins in complex with DNA and found that the Rot dimer is structurally highly homologous to the Bacillus subtilis OhrR protein (PDB ID 1Z9C) (43), with an RMSD of ∼2.0 Å when the WHTH domains are superimposed (Table 5). Like Rot, OhrR forms a dimer using both N-terminal and C-terminal helices, although its C-terminal dimerization domain is formed by two helices (α5 and α6), while Rot has a relatively straight long single helix (α5). By superimposing the WHTH domain of Rot onto that of OhrR in the DNA complex, we were able to predict the residues that potentially interact with the DNA (Fig. 4A and B).
FIG 4.

Prediction of domains important for Rot function. (A) Model of Rot-DNA interaction. Rot dimers (cyan and green) are depicted as ribbons, while the DNA (brown) backbones and bases are depicted as thin tubes with an overall transparent surface. The side chains of Y66 and R91 are shown. (B) Zoomed-in view of modeled interaction at major and minor grooves. The side chains are shown for Y66 in the RH with the major groove of DNA and R91 of the wing with the minor groove. (C) Optimal Docking Area (ODA) analysis. ODA was used to predict interfaces for protein-protein interactions (44). Red spheres indicate locations on the surface of Rot where protein interactions are likely to occur. (D) Side chains are shown for residues predicted from the ODA analysis to interact with protein partners.
Residues that are predicted from our modeling to interact with DNA can be divided into two groups: those that likely make sequence-specific contact with the bases of DNA (colored orange in Fig. 1B) or those that likely make nonspecific contact with the backbone of DNA (purple in Fig. 1B). Seven residues (64KPYKRTR70) located at the N-terminal corner of the RH are predicted to bind into the major groove of DNA (Fig. 4A and B); thus, they can potentially make sequence-specific interactions. Residue R91, located at the tip of the wing, is predicted to insert its side chain into the minor groove of DNA; thus, it can also interact with DNA in a sequence-specific fashion. Thirteen residues from different Rot domains are predicted to be involved in nonspecific DNA interactions, forming contacts with the DNA backbones. When we fitted the Rot structure onto that of the OhrR-DNA complex, the position of the chloride ion in each monomer overlapped with that of a phosphate of the DNA backbone; thus, the chloride ion will likely be displaced upon DNA binding (Fig. 1A and 4A).
Rot's structure was also analyzed using the Optimal Docking Area (ODA) tool of ICM to predict potential sites of protein-partner interaction (44). ODA applies an algorithm benchmarked to accurately predict protein interaction regions based on the biophysical properties of the functional groups on the surface of the protein. The residues predicted by ODA to interact with protein partners are located on the undersurface of Rot at the junction between the two monomers, including F10, L13, Q14, and T17 from helix α1 of one monomer and Q48 of helix α2 from the other monomer (Fig. 4C and D).
Functional studies of specific Rot residues.
Based on the predicted DNA-binding and protein partner binding regions in our model, we made 4 sets of alanine substitutions to further map the functionally important residues (Table 6; Fig. 5A to E). The first set of mutants included substitutions in the WHTH domain that may affect specific binding between Rot and DNA: group substitutions of residues K64-R70 that line the top of the RH and individual substitutions of Y66 and K67 of RH and R91 of the wing (Fig. 5B and C). The second set of mutants included substitutions in the WHTH domain that were predicted to affect nonspecific binding of DNA: group substitutions of L54 and K55 of α3 (Fig. 5B) and of T71 and N74 on the underside of the recognition helix (α4), as well as the individual substitution of N74 (Fig. 5C). The third set of mutants included substitutions in the core helices to perturb nonspecific interactions with DNA: group substitutions of L41 and L44 in addition to S37, E38, and E39 of α2 and the individual substitution of E39 (Fig. 5C and D). The fourth set of mutants included substitutions of surface residues of Rot that are predicted to make contact with potential protein partners: group substitutions of F10, L13, Q14, and T17 and individual substitutions of F10, L13, Q14, T17, and Q48 (Fig. 5E). We also made a specific substitution of Q14 with glutamic acid to determine if we could alter the specificity of this interface.
TABLE 6.
Site-directed mutations in Rota
| Mutation | Location | Predicted contact |
|---|---|---|
| R91A | Wing | Specific DNA |
| K64A-R70A | HTH-RH | Specific DNA |
| Y66A | HTH-RH | Specific DNA |
| K67A | HTH-RH | Specific DNA |
| L54A/K55A | HTH-α3 | Nonspecific DNA |
| T71A/N74A | HTH-RH | Nonspecific DNA |
| N74A | HTH-RH | Nonspecific DNA |
| L41A/L44A | Core-α2 | Nonspecific DNA |
| S36A/E38A/E39A | Core-α2 | Nonspecific DNA |
| E39A | Core-α2 | Nonspecific DNA |
| F10A/L13A/Q14A/T17A | Core-α1 | Protein partners |
| F10A | Core-α1 | Protein partners |
| L13A | Core-α1 | Protein partners |
| Q14A | Core-α1 | Protein partners |
| Q14E | Core-α1 | Protein partners |
| T17A | Core-α1 | Protein partners |
| Q48A | Core-α2 | Protein partners |
The location of each mutation within the protein and the predicted contact interrupted by each mutant are indicated.
FIG 5.
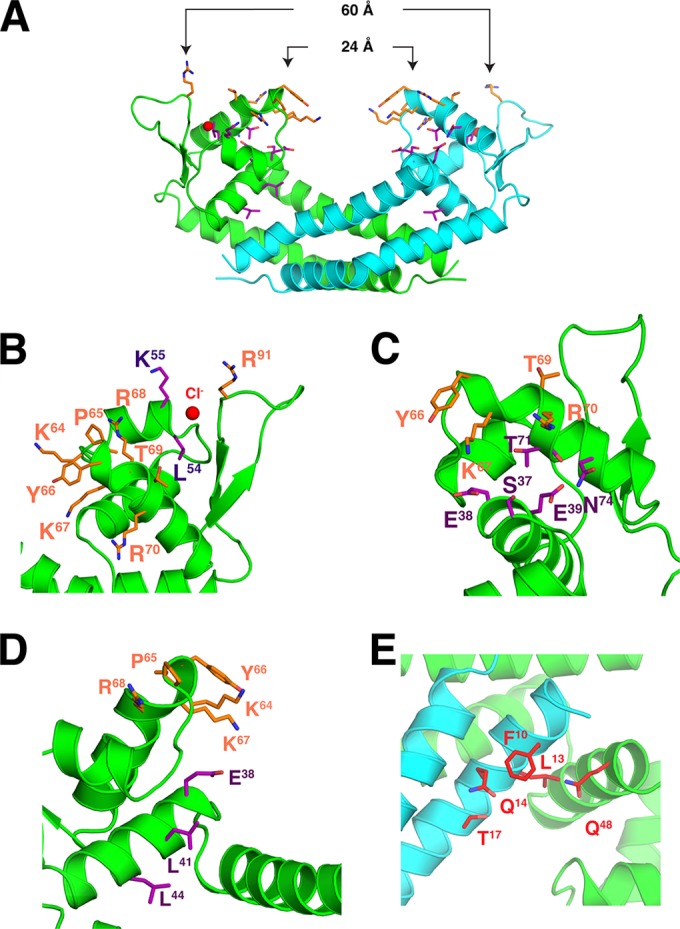
Targeted Rot residues for site-directed mutagenesis. (A) Residues altered to generate mutant Rot proteins are shown in stick representation. Orange residues are predicted to make specific contacts with DNA. Purple residues are predicted to make nonspecific contacts with DNA. Red residues are predicted to be involved in interactions with protein partners. Distances between the Y66 residues and the R91 residues in the two monomers are reported. (B) The WHTH region is shown in a closeup view with the side chains of selected residues in stick representation. The chloride ion is shown as a red sphere. (C and D) The HTH region is shown from two orientations. (E) Closeup view of the region predicted by ODA to be involved in interaction with protein partners.
Mutant constructs were cloned into the vector pOS1Plgt (45). Immunoblot analysis was performed to ensure that mutation of these residues did not impact Rot production (data not shown). We then tested these mutants for activation of the ssl7 promoter (24, 31). Promoter activation function was quantified by the use of a single-copy integrated Pssl7-sGFP transcriptional reporter (Fig. 6). Although a number of mutations, including F10A, L13A, Q14A/E, T17A, E39A, L41A, L44A, Q48A, K67A, and N74A, did not result in significant changes in promoter activation compared to wild-type (WT) Rot, six of the tested mutations, with alanine substitutions of either individual or group residues, resulted in drastic changes in function from WT Rot (Fig. 6).
FIG 6.

Mutant Rot proteins display functional defects. Mutant rot alleles carried on plasmid pOS1Plgt were transformed into an S. aureus reporter strain containing the sGFP gene under the control of the ssl7 promoter, which is activated by Rot. Left, Pssl7 activation by Rot containing group amino acid mutations in regions predicted to be important for Rot-mediated regulation. Right, Pssl7 activation by Rot proteins containing single amino acid mutations selected from group substitution mutants. Activation activity of Rot mutants was assessed by GFP fluorescence in cultures grown to post-exponential phase. Values are averages of results from three independent experiments ± standard deviations.
Rot differentially activates and represses target genes.
qRT-PCR was used to further assess the ability of Rot and the Rot mutants described in Fig. 6 to either activate transcription of ssl7 and spa (Fig. 7A and B) (20, 24, 31, 46) or repress transcription of lukE and hla (Fig. 7C and D) (19, 23, 47). Comparison of activation and repression of these genes revealed that R91, in the wing motif, and L54/K55, in the RH α3, are the most important residues for Rot-mediated regulation of both repressed and activated genes. The F10A/L13A/Q14A/T17A mutant demonstrated intermediate effects on both activation and repression activity of the tested targets. Interestingly, the remaining mutants demonstrated effects on Rot activity that varied among the studied promoters. For example, the Y66A mutant had an intermediate effect on activation of ssl7 and repression of hla but severely impaired activation of spa, while having almost no effect on repression of lukED. The T71A/N74A mutant demonstrated intermediate effects on the activity of all promoters except lukED, where it had no effect on repression of this gene. Finally, the S36A/E38A/E39A mutant had little effect on activation of spa or repression of lukED but significantly decreased the ability of Rot to activate ssl7 and repress hla. Taken together, these results indicate that certain residues may be of more importance in the recognition of specific promoters, highlighting a potential novel mechanism by which Rot differentiates target promoters.
FIG 7.

Mutations in Rot differentially affect activation, repression, and DNA binding. (A to D) Transcript levels of ssl7 (A) and spa (B), which are activated by Rot, or lukE (C) and hla (D), which are repressed by Rot, were quantified by qRT-PCR from strains containing the wild-type Rot or its mutant proteins. Transcript levels were quantified in units of relative quantitation (RQ) and compared to that of the empty vector (Neg) or the wild-type Rot protein (WT). Data bars represent the average of results from 3 experiments ± standard deviation. (E and F) EMSA of purified WT and mutant Rot proteins incubated with either the ssl7 (E) or lukED (F) promoter containing a biotin tag. Promoter DNA probes alone (Neg) or preincubated with Rot-His proteins were separated by PAGE. DNA probes were visualized using streptavidin DyLight. “P” denotes unbound DNA probe. “S” denotes shifted band resulting from Rot-DNA complex. The asterisk denotes a nonspecific band.
To determine whether substitution of these residues altered the ability of Rot to directly bind these target promoters, electromobility shift assays (EMSAs) were performed. In correlation with the qRT-PCR results, Rot L54A/K55A and R91A no longer bound to the ssl7 promoter, correlating with a loss of activation (Fig. 7E). Additionally, Rot L54A/K55A and R91A no longer bound to the lukED promoter, corroborating the qRT-PCR data, which demonstrate a loss of repression of lukED by these mutants (Fig. 7F). These results suggest that loss of activation or repression of these promoters is due to lack of binding to the target promoters. Interestingly, the Rot F10A/L13A/Q14A/T17A and Y66A mutants still appear to retain some binding ability, which may account for the intermediate activation/repression phenotypes observed by qRT-PCR (Fig. 7E and F).
The large effects on Rot function and DNA binding resulting from mutants of R91 on the wing and L54/K55 adjacent to the wing suggest that these two sites likely play an important role in the insertion of the wing into the minor groove of DNA (Fig. 6 and 7). The alanine substitution of residue Y66 at the very tip of the RH (thus likely binding the bases in the major groove) had a much larger effect on Rot's function than that of the neighboring residue K67 (Fig. 6), but this Y66 mutation did not have a strong effect on promoter binding (Fig. 7E and F), suggesting an alternative role for Y66 in Rot activity. Interestingly, Y66 and the other mutated residues of the HTH and helical core have a less pronounced and more varied effect on activating or repressing transcription than do residues involved with insertion of the wing into the minor groove. These results may suggest that interactions between the wing and minor groove are important for Rot binding to DNA, while residues in the HTH and helical core facilitate recognition and differentiation among target promoters.
DISCUSSION
Rot is a central regulator of S. aureus virulence and is known to specifically interact with target promoters (19, 20, 22–25, 47). Work presented here aimed to gain insight into how Rot interacts with promoters by solving a high-resolution crystal structure. The structure of Rot showed a conserved DNA-binding face that is positively charged despite the overall very acidic pI of the protein. Like those of some other WHTH proteins that bind DNA, such as OhrR, Rot's electrostatic profile is asymmetrical and can therefore orient the WHTH motif toward the DNA helix. This specific electrostatic profile and a delicate charge balance may have profound functional significance. One possibility is that the overall negative charge of Rot creates a slight repulsion between Rot and the DNA, and this repulsion can be altered by interactions with protein partners that possess an overall positive charge, such as RNA polymerase. Therefore, Rot's unique electrostatic features may serve a functional purpose enabling its significant role in regulating the S. aureus virulon.
Recently, Zhu et al. published a structure for Rot of equal resolution to ours, which agrees with the findings described here (e.g., Rot is a homodimer and has a WHTH DNA-binding domain) (48). In our Rot structure, however, we were able to capture the wing domain, which was absent in the Zhu et al. structure (48), providing a more detailed molecular picture of Rot. The mutagenesis studies described in our study validate and extend the findings of Zhu et al., highlighting the role of critical residues for Rot function.
Residues V9, I12, L13, L15, L18, I22, I25, and F26 from the α1 helix; residues L44 and W47 from the α2 helix; and residues I112, I116, A120, M123, L127, and I131 from the α5 helix of each Rot monomer have been described as key residues involved in the formation of the hydrophobic dimer interface (48). Moreover, alanine substitutions of M123, L127, and I131 revealed that disruption of the dimerization domain abrogated the ability of Rot to bind a synthetic DNA and to repress expression of hla (48). Similarly, we found that group mutation of F10, L13, Q14, and T17 in the dimerization domain of α1 reduced regulatory activity of Rot at multiple promoters, providing further evidence that the formation of a dimer is critical for Rot function (Fig. 6 and 7). Interestingly, mutation of F10, L13, Q14, or T17 individually had no impact on Rot activation of the ssl7 promoter, suggesting that Rot dimerization may tolerate slight modification of the hydrophobic pocket of the dimerization domain, but gross changes in the hydrophobicity of this region prevent interaction of the dimerization helices (Fig. 6).
To elucidate the mechanism of Rot interaction with DNA, we examined the effects of several mutations in various regions of the WHTH domain. Residue R91 in the wing loop is part of the highly conserved DER domain of the SarA family and is predicted to contact the minor groove of DNA. Mutation of R91 severely disrupted both activation and repression capacity of Rot at all promoters tested (Fig. 6 and 7). In addition, this mutation completely abrogated Rot binding to ssl7 and lukED promoter DNA (Fig. 7E and F). Similarly, mutation of L54 and K55 resulted in prominent defects in activation, repression, and DNA binding (Fig. 6 and 7). K55, adjacent to the wing, is also highly conserved in the SarA family. In agreement with our results, both R91 and K55 have been found to be important for Rot binding to a synthetic DNA probe (48). The highly conserved nature of these residues within the SarA family and the loss of global Rot activity upon their substitution may suggest a uniform mechanism utilized by this protein family for the interaction of the wing region with the minor groove of DNA.
In contrast, mutations of the HTH region of Rot have a much more varied effect on the activation or repression of target promoters (Fig. 7). It is possible that the determinants of functional selectivity both among SarA family members and between different Rot-interacting promoters reside in the residues of the RH, which likely make contact with the major groove of DNA. For example, group substitution of K64 through R70 abolished activation of ssl7 by Rot (Fig. 6). In agreement with this finding, substitution of K64 alone and group substitution of K67, R68, and R70 were demonstrated to be sufficient to disrupt Rot binding to a synthetic DNA probe (48). Except for K64, this region is not highly conserved among SarA family members and so may contribute to Rot-specific recognition of target promoters. Residue Y66, projecting from the top of the RH, is unique to Rot, and its substitution to alanine has a differential effect on activation versus repression. While mutation of this residue severely impacted activation of ssl7 and spa, only a moderate defect in repression of hla and almost no defect in repression of lukED were observed (Fig. 7A to D). We also found that the Y66 mutant retained binding ability to ssl7 and lukED promoter DNA, while the same mutation was found to show only a moderate defect in binding to a synthetic DNA probe (Fig. 7E and F) (48). Given the differences in effects of Y66 substitution, this residue could play the role of a selectivity filter for different promoters. The residues on the top of the recognition helix of other SarA family members are also variable and may play a similar role, such as P71, K74, and/or R75 of MgrA; S65 of SarS; Y63 of SarR; P65 and/or K69 of SarA; and S68 and/or T70 of OhrR (Fig. 3B). Both our study and that of Zhu et al. identified additional residues in less-conserved regions of Rot that impact Rot function, suggesting that, while Rot utilizes a mechanism of DNA recognition and binding similar to that of other SarA family members, it can utilize unique residues to distinguish its target promoters and mediate activation versus repression activity.
Despite Rot's known ability to interact specifically with certain promoters (20, 22, 24, 25), the binding site consensus sequence of Rot is still unknown. Our structure allows several predictions about its potential DNA-binding mechanism. First, the Rot dimer is highly symmetric with an almost exact 2-fold rotational symmetry, suggesting that the DNA sequences in the Rot-interacting promoters will likely contain palindromic elements. Second, the distance in the dimer between the Cα atoms of the two R91 residues, whose side chains likely penetrate into the minor groove of DNA, is 60 Å (Fig. 5A). Given that the length per base pair of a standard DNA helix is 3.3 Å (49), Rot likely interacts with a section of DNA about 18 bp long. This is in agreement with a study by Rechtin and colleagues, who made a similar prediction about SarA (50); however, the SarA binding site is still a subject of debate (51, 52). It should be noted that this estimation of the Rot binding site length is rudimentary, as the wing regions are very flexible and the distance between the R91 residues can vary. Third, the side chain of R91 will interact specifically with a base in the minor groove. The crystal structure of OhrR-DNA showed that the side chain of the corresponding arginine forms a base-specific interaction with the oxygen atom of a thymine. Since it is highly conserved in the SarA family (Fig. 3B), R91 will likely also interact with a thymine in the Rot-interacting promoters. As K55, adjacent to the wing, is also highly conserved among SarA family proteins (Fig. 3B), this residue may play a key role in interaction with DNA as well. These predictions are consistent with our functional data demonstrating that alanine substitution of R91 and the two residues L54 and K55 had more substantial effects on activation or repression of promoters than did other mutated residues of the HTH or the helices at the center of the dimer. Altogether, the data presented here provide further insight into the structure and function of Rot as a transcriptional activator and repressor. However, it is clear that additional work needs to be undertaken to better understand Rot's selectivity for activated versus repressed promoters, as well as to identify the specific Rot binding site (48).
ACKNOWLEDGMENTS
We thank John Fraser for providing the anti-Ssl7 antibody and Alexander Horswill for providing the sGFP plasmid.
Research reported in this publication was supported in part by funds of a Graduate Research Fellowship to A.K. from the National Science and Engineering Research Council of Canada and by the National Institute of Allergy and Infectious Diseases of the National Institutes of Health under award number R21AI101533 to V.J.T. B.S. was supported by NIH training grant GM088118. V.J.T. is a Burroughs Wellcome Fund Investigator in the Pathogenesis of Infectious Diseases.
The content is solely the responsibility of the authors and does not necessarily represent the official views of the National Institutes of Health.
REFERENCES
- 1.Lowy FD. 1998. Staphylococcus aureus infections. N Engl J Med 339:520–532. doi: 10.1056/NEJM199808203390806. [DOI] [PubMed] [Google Scholar]
- 2.Diekema DJ, Pfaller MA, Schmitz FJ, Smayevsky J, Bell J, Jones RN, Beach M SENTRY Participants Group . 2001. Survey of infections due to Staphylococcus species: frequency of occurrence and antimicrobial susceptibility of isolates collected in the United States, Canada, Latin America, Europe, and the Western Pacific region for the SENTRY Antimicrobial Surveillance Program, 1997–1999. Clin Infect Dis 32(Suppl 2):S114–S132. doi: 10.1086/320184. [DOI] [PubMed] [Google Scholar]
- 3.Jones RN. 2003. Global epidemiology of antimicrobial resistance among community-acquired and nosocomial pathogens: a five-year summary from the SENTRY Antimicrobial Surveillance Program (1997–2001). Semin Respir Crit Care Med 24:121–134. doi: 10.1055/s-2003-37923. [DOI] [PubMed] [Google Scholar]
- 4.Fridkin SK, Hageman JC, Morrison M, Sanza LT, Como-Sabetti K, Jernigan JA, Harriman K, Harrison LH, Lynfield R, Farley MM. 2005. Methicillin-resistant Staphylococcus aureus disease in three communities. N Engl J Med 352:1436–1444. doi: 10.1056/NEJMoa043252. [DOI] [PubMed] [Google Scholar]
- 5.DeLeo FR, Otto M, Kreiswirth BN, Chambers HF. 2010. Community-associated meticillin-resistant Staphylococcus aureus. Lancet 375:1557–1568. doi: 10.1016/S0140-6736(09)61999-1. [DOI] [PMC free article] [PubMed] [Google Scholar]
- 6.Klevens R, Morrison M, Nadle J, Petit S, Gershman K, Ray S, Harrison LH, Lynfield R, Dumyati G, Townes JM, Craig AS, Zell ER, Fosheim GE, McDougal LK, Carey RB, Fridkin SK Active Bacterial Core surveillance (ABCs) MRSA Investigators . 2007. Invasive methicillin-resistant Staphylococcus aureus infections in the United States. JAMA 298:1763–1771. doi: 10.1001/jama.298.15.1763. [DOI] [PubMed] [Google Scholar]
- 7.Hiramatsu K, Aritaka N, Hanaki H, Kawasaki S, Hosoda Y, Hori S, Fukuchi Y, Kobayashi I. 1997. Dissemination in Japanese hospitals of strains of Staphylococcus aureus heterogeneously resistant to vancomycin. Lancet 350:1670–1673. doi: 10.1016/S0140-6736(97)07324-8. [DOI] [PubMed] [Google Scholar]
- 8.Waters CM, Bassler BL. 2005. Quorum sensing: cell-to-cell communication in bacteria. Annu Rev Cell Dev Biol 21:319–346. doi: 10.1146/annurev.cellbio.21.012704.131001. [DOI] [PubMed] [Google Scholar]
- 9.Novick RP, Geisinger E. 2008. Quorum sensing in staphylococci. Annu Rev Genet 42:541–564. doi: 10.1146/annurev.genet.42.110807.091640. [DOI] [PubMed] [Google Scholar]
- 10.Recsei P, Kreiswirth B, O'Reilly M, Schlievert P, Gruss A, Novick RP. 1986. Regulation of exoprotein gene expression in Staphylococcus aureus by agar. Mol Gen Genet 202:58–61. doi: 10.1007/BF00330517. [DOI] [PubMed] [Google Scholar]
- 11.Queck SY, Jameson-Lee M, Villaruz AE, Bach TH, Khan BA, Sturdevant DE, Ricklefs SM, Li M, Otto M. 2008. RNAIII-independent target gene control by the agr quorum-sensing system: insight into the evolution of virulence regulation in Staphylococcus aureus. Mol Cell 32:150–158. doi: 10.1016/j.molcel.2008.08.005. [DOI] [PMC free article] [PubMed] [Google Scholar]
- 12.Janzon L, Lofdahl S, Arvidson S. 1989. Identification and nucleotide sequence of the delta-lysin gene, hld, adjacent to the accessory gene regulator (agr) of Staphylococcus aureus. Mol Gen Genet 219:480–485. doi: 10.1007/BF00259623. [DOI] [PubMed] [Google Scholar]
- 13.Novick RP, Ross HF, Projan SJ, Kornblum J, Kreiswirth B, Moghazeh S. 1993. Synthesis of staphylococcal virulence factors is controlled by a regulatory RNA molecule. EMBO J 12:3967–3975. [DOI] [PMC free article] [PubMed] [Google Scholar]
- 14.Benito Y, Kolb FA, Romby P, Lina G, Etienne J, Vandenesch F. 2000. Probing the structure of RNAIII, the Staphylococcus aureus agr regulatory RNA, and identification of the RNA domain involved in repression of protein A expression. RNA 6:668–679. doi: 10.1017/S1355838200992550. [DOI] [PMC free article] [PubMed] [Google Scholar]
- 15.Boisset S, Geissmann T, Huntzinger E, Fechter P, Bendridi N, Possedko M, Chevalier C, Helfer AC, Benito Y, Jacquier A, Gaspin C, Vandenesch F, Romby P. 2007. Staphylococcus aureus RNAIII coordinately represses the synthesis of virulence factors and the transcription regulator Rot by an antisense mechanism. Genes Dev 21:1353–1366. doi: 10.1101/gad.423507. [DOI] [PMC free article] [PubMed] [Google Scholar]
- 16.Geisinger E, Adhikari RP, Jin R, Ross HF, Novick RP. 2006. Inhibition of rot translation by RNAIII, a key feature of agr function. Mol Microbiol 61:1038–1048. doi: 10.1111/j.1365-2958.2006.05292.x. [DOI] [PubMed] [Google Scholar]
- 17.Huntzinger E, Boisset S, Saveanu C, Benito Y, Geissmann T, Namane A, Lina G, Etienne J, Ehresmann B, Ehresmann C, Jacquier A, Vandenesch F, Romby P. 2005. Staphylococcus aureus RNAIII and the endoribonuclease III coordinately regulate spa gene expression. EMBO J 24:824–835. doi: 10.1038/sj.emboj.7600572. [DOI] [PMC free article] [PubMed] [Google Scholar]
- 18.Morfeldt E, Taylor D, von Gabain A, Arvidson S. 1995. Activation of alpha-toxin translation in Staphylococcus aureus by the trans-encoded antisense RNA, RNAIII. EMBO J 14:4569–4577. [DOI] [PMC free article] [PubMed] [Google Scholar]
- 19.McNamara PJ, Milligan-Monroe KC, Khalili S, Proctor RA. 2000. Identification, cloning, and initial characterization of rot, a locus encoding a regulator of virulence factor expression in Staphylococcus aureus. J Bacteriol 182:3197–3203. doi: 10.1128/JB.182.11.3197-3203.2000. [DOI] [PMC free article] [PubMed] [Google Scholar]
- 20.Said-Salim B, Dunman PM, McAleese FM, Macapagal D, Murphy E, McNamara PJ, Arvidson S, Foster TJ, Projan SJ, Kreiswirth BN. 2003. Global regulation of Staphylococcus aureus genes by Rot. J Bacteriol 185:610–619. doi: 10.1128/JB.185.2.610-619.2003. [DOI] [PMC free article] [PubMed] [Google Scholar]
- 21.Novick RP. 2003. Autoinduction and signal transduction in the regulation of staphylococcal virulence. Mol Microbiol 48:1429–1449. doi: 10.1046/j.1365-2958.2003.03526.x. [DOI] [PubMed] [Google Scholar]
- 22.McNamara PJ, Bayer AS. 2005. A rot mutation restores parental virulence to an agr-null Staphylococcus aureus strain in a rabbit model of endocarditis. Infect Immun 73:3806–3809. doi: 10.1128/IAI.73.6.3806-3809.2005. [DOI] [PMC free article] [PubMed] [Google Scholar]
- 23.Alonzo F III, Benson MA, Chen J, Novick RP, Shopsin B, Torres VJ. 2012. Staphylococcus aureus leucocidin ED contributes to systemic infection by targeting neutrophils and promoting bacterial growth in vivo. Mol Microbiol 83:423–435. doi: 10.1111/j.1365-2958.2011.07942.x. [DOI] [PMC free article] [PubMed] [Google Scholar]
- 24.Benson MA, Lilo S, Wasserman GA, Thoendel M, Smith A, Horswill AR, Fraser J, Novick RP, Shopsin B, Torres VJ. 2011. Staphylococcus aureus regulates the expression and production of the staphylococcal superantigen-like secreted proteins in a Rot-dependent manner. Mol Microbiol 81:659–675. doi: 10.1111/j.1365-2958.2011.07720.x. [DOI] [PMC free article] [PubMed] [Google Scholar]
- 25.Tseng CW, Stewart GC. 2005. Rot repression of enterotoxin B expression in Staphylococcus aureus. J Bacteriol 187:5301–5309. doi: 10.1128/JB.187.15.5301-5309.2005. [DOI] [PMC free article] [PubMed] [Google Scholar]
- 26.Cheung AL, Bayer AS, Zhang G, Gresham H, Xiong YQ. 2004. Regulation of virulence determinants in vitro and in vivo in Staphylococcus aureus. FEMS Immunol Med Microbiol 40:1–9. doi: 10.1016/S0928-8244(03)00309-2. [DOI] [PubMed] [Google Scholar]
- 27.Brennan RG. 1993. The winged-helix DNA-binding motif: another helix-turn-helix takeoff. Cell 74:773–776. doi: 10.1016/0092-8674(93)90456-Z. [DOI] [PubMed] [Google Scholar]
- 28.Ohlendorf DH, Anderson WF, Fisher RG, Takeda Y, Matthews BW. 1982. The molecular basis of DNA-protein recognition inferred from the structure of cro repressor. Nature 298:718–723. doi: 10.1038/298718a0. [DOI] [PubMed] [Google Scholar]
- 29.Ohlendorf DH, Anderson WF, Matthews BW. 1983. Many gene-regulatory proteins appear to have a similar alpha-helical fold that binds DNA and evolved from a common precursor. J Mol Evol 19:109–114. doi: 10.1007/BF02300748. [DOI] [PubMed] [Google Scholar]
- 30.Sauer RT, Yocum RR, Doolittle RF, Lewis M, Pabo CO. 1982. Homology among DNA-binding proteins suggests use of a conserved super-secondary structure. Nature 298:447–451. doi: 10.1038/298447a0. [DOI] [PubMed] [Google Scholar]
- 31.Benson MA, Lilo S, Nygaard T, Voyich JM, Torres VJ. 2012. Rot and SaeRS cooperate to activate expression of the staphylococcal superantigen-like exoproteins. J Bacteriol 194:4355–4365. doi: 10.1128/JB.00706-12. [DOI] [PMC free article] [PubMed] [Google Scholar]
- 32.Read RJ, Sussman JL (ed). 2007. Evolving methods for macromolecular crystallography. NATO Science Series II, vol 245 Springer, New York, NY. [Google Scholar]
- 33.Winn MD, Ballard CC, Cowtan KD, Dodson EJ, Emsley P, Evans PR, Keegan RM, Krissinel EB, Leslie AG, McCoy A, McNicholas SJ, Murshudov GN, Pannu NS, Potterton EA, Powell HR, Read RJ, Vagin A, Wilson KS. 2011. Overview of the CCP4 suite and current developments. Acta Crystallogr D Biol Crystallogr 67:235–242. doi: 10.1107/S0907444910045749. [DOI] [PMC free article] [PubMed] [Google Scholar]
- 34.Collaborative Computational Project. 1994. The CCP4 suite: programs for protein crystallography, Acta Crystallogr D Biol Crystallogr 50:760–763. [DOI] [PubMed] [Google Scholar]
- 35.Sheldrick GM. 2010. Experimental phasing with SHELXC/D/E: combining chain tracing with density modification. Acta Crystallogr D Biol Crystallogr 66:479–485. doi: 10.1107/S0907444909038360. [DOI] [PMC free article] [PubMed] [Google Scholar]
- 36.Cowtan K. 2006. The Buccaneer software for automated model building. 1. Tracing protein chains. Acta Crystallogr D Biol Crystallogr 62:1002–1011. doi: 10.1107/S0907444906022116. [DOI] [PubMed] [Google Scholar]
- 37.Emsley P, Lohkamp B, Scott WG, Cowtan K. 2010. Features and development of Coot. Acta Crystallogr D Biol Crystallogr 66:486–501. doi: 10.1107/S0907444910007493. [DOI] [PMC free article] [PubMed] [Google Scholar]
- 38.Murshudov GN, Skubak P, Lebedev AA, Pannu NS, Steiner RA, Nicholls RA, Winn MD, Long F, Vagin AA. 2011. REFMAC5 for the refinement of macromolecular crystal structures. Acta Crystallogr D Biol Crystallogr 67:355–367. doi: 10.1107/S0907444911001314. [DOI] [PMC free article] [PubMed] [Google Scholar]
- 39.Adams PD, Afonine PV, Bunkoczi G, Chen VB, Davis IW, Echols N, Headd JJ, Hung LW, Kapral GJ, Grosse-Kunstleve RW, McCoy AJ, Moriarty NW, Oeffner R, Read RJ, Richardson DC, Richardson JS, Terwilliger TC, Zwart PH. 2010. PHENIX: a comprehensive Python-based system for macromolecular structure solution. Acta Crystallogr D Biol Crystallogr 66:213–221. doi: 10.1107/S0907444909052925. [DOI] [PMC free article] [PubMed] [Google Scholar]
- 40.Schrodinger LLC. 2010. The PyMOL molecular graphics system, version 1.3r1. Schrodinger LLC, Cambridge, MA. [Google Scholar]
- 41.Abagyan R, Totrov M, Kuznetsov D. 1994. ICM—a new method for protein modeling and design: applications to docking and structure prediction from the distorted native conformation. J Comput Chem 15:488–506. doi: 10.1002/jcc.540150503. [DOI] [Google Scholar]
- 42.Krissinel E, Henrick K. 2007. Inference of macromolecular assemblies from crystalline state. J Mol Biol 372:774–797. doi: 10.1016/j.jmb.2007.05.022. [DOI] [PubMed] [Google Scholar]
- 43.Hong M, Fuangthong M, Helmann JD, Brennan RG. 2005. Structure of an OhrR-ohrA operator complex reveals the DNA binding mechanism of the MarR family. Mol Cell 20:131–141. doi: 10.1016/j.molcel.2005.09.013. [DOI] [PubMed] [Google Scholar]
- 44.Fernandez-Recio J, Totrov M, Abagyan R. 2002. Soft protein-protein docking in internal coordinates. Protein Sci 11:280–291. doi: 10.1110/ps.19202. [DOI] [PMC free article] [PubMed] [Google Scholar]
- 45.Bubeck Wardenburg J, Williams WA, Missiakas D. 2006. Host defenses against Staphylococcus aureus infection require recognition of bacterial lipoproteins. Proc Natl Acad Sci U S A 103:13831–13836. doi: 10.1073/pnas.0603072103. [DOI] [PMC free article] [PubMed] [Google Scholar]
- 46.Gao J, Stewart GC. 2004. Regulatory elements of the Staphylococcus aureus protein A (Spa) promoter. J Bacteriol 186:3738–3748. doi: 10.1128/JB.186.12.3738-3748.2004. [DOI] [PMC free article] [PubMed] [Google Scholar]
- 47.Benson MA, Ohneck EA, Ryan C, Alonzo F III, Smith H, Narechania A, Kolokotronis SO, Satola SW, Uhlemann AC, Sebra R, Deikus G, Shopsin B, Planet PJ, Torres VJ. 2014. Evolution of hypervirulence by a MRSA clone through acquisition of a transposable element. Mol Microbiol 93:664–681. doi: 10.1111/mmi.12682. [DOI] [PMC free article] [PubMed] [Google Scholar]
- 48.Zhu Y, Fan X, Zhang X, Jiang X, Niu L, Teng M, Li X. 2014. Structure of Rot, a global regulator of virulence genes in Staphylococcus aureus. Acta Crystallogr D Biol Crystallogr 70:2467–2476. doi: 10.1107/S1399004714015326. [DOI] [PubMed] [Google Scholar]
- 49.Sinden RR. 1994. DNA structure and function, 1st ed. Academic Press, San Diego, CA. [Google Scholar]
- 50.Rechtin TM, Gillaspy AF, Schumacher MA, Brennan RG, Smeltzer MS, Hurlburt BK. 1999. Characterization of the SarA virulence gene regulator of Staphylococcus aureus. Mol Microbiol 33:307–316. doi: 10.1046/j.1365-2958.1999.01474.x. [DOI] [PubMed] [Google Scholar]
- 51.Chien Y, Manna AC, Projan SJ, Cheung AL. 1999. SarA, a global regulator of virulence determinants in Staphylococcus aureus, binds to a conserved motif essential for sar-dependent gene regulation. J Biol Chem 274:37169–37176. doi: 10.1074/jbc.274.52.37169. [DOI] [PubMed] [Google Scholar]
- 52.Sterba KM, Mackintosh SG, Blevins JS, Hurlburt BK, Smeltzer MS. 2003. Characterization of Staphylococcus aureus SarA binding sites. J Bacteriol 185:4410–4417. doi: 10.1128/JB.185.15.4410-4417.2003. [DOI] [PMC free article] [PubMed] [Google Scholar]
- 53.Ashkenazy H, Erez E, Martz E, Pupko T, Ben-Tal N. 2010. ConSurf 2010: calculating evolutionary conservation in sequence and structure of proteins and nucleic acids. Nucleic Acids Res 38(Web Server issue):W529–W533. doi: 10.1093/nar/gkq399. [DOI] [PMC free article] [PubMed] [Google Scholar]
- 54.Kreiswirth BN, Lofdahl S, Betley MJ, O'Reilly M, Schlievert PM, Bergdoll MS, Novick RP. 1983. The toxic shock syndrome exotoxin structural gene is not detectably transmitted by a prophage. Nature 305:709–712. doi: 10.1038/305709a0. [DOI] [PubMed] [Google Scholar]
- 55.Ruzin A, Lindsay J, Novick RP. 2001. Molecular genetics of SaPI1—a mobile pathogenicity island in Staphylococcus aureus. Mol Microbiol 41:365–377. doi: 10.1046/j.1365-2958.2001.02488.x. [DOI] [PubMed] [Google Scholar]
- 56.Duthie ES, Lorenz LL. 1952. Staphylococcal coagulase; mode of action and antigenicity. J Gen Microbiol 6:95–107. doi: 10.1099/00221287-6-1-2-95. [DOI] [PubMed] [Google Scholar]
- 57.Chen J, Yoong P, Ram G, Torres VJ, Novick RP. 2014. Single-copy vectors for integration at the SaPI1 attachment site for Staphylococcus aureus. Plasmid 76C:1–7. doi: 10.1016/j.plasmid.2014.08.001. [DOI] [PMC free article] [PubMed] [Google Scholar]