

Abstract
While the model organism Escherichia coli has been the subject of intense study for decades, the full complement of its RNAs is only now being examined. Here we describe a survey of the E. coli transcriptome carried out using a differential RNA sequencing (dRNA-seq) approach, which can distinguish between primary and processed transcripts, and an automated prediction algorithm for transcriptional start sites (TSS). With the criterion of expression under at least one of three growth conditions examined, we predicted 14,868 TSS candidates, including 5,574 internal to annotated genes (iTSS) and 5,495 TSS corresponding to potential antisense RNAs (asRNAs). We examined expression of 14 candidate asRNAs by Northern analysis using RNA from wild-type E. coli and from strains defective for RNases III and E, two RNases reported to be involved in asRNA processing. Interestingly, nine asRNAs detected as distinct bands by Northern analysis were differentially affected by the rnc and rne mutations. We also compared our asRNA candidates with previously published asRNA annotations from RNA-seq data and discuss the challenges associated with these cross-comparisons. Our global transcriptional start site map represents a valuable resource for identification of transcription start sites, promoters, and novel transcripts in E. coli and is easily accessible, together with the cDNA coverage plots, in an online genome browser.
INTRODUCTION
After many years of study, we are only now beginning to understand and appreciate the complexity of bacterial transcriptomes. With the recent advances in deep-sequencing technology, transcriptome sequencing (RNA-seq) now allows for the detection of transcripts that are present at low levels or were previously missed by other methods of detection, the generation of global transcript maps, and improved genome annotation (reviewed in references 1 and 2). While these studies provide vast amounts of information about bacterial transcriptomes and regulatory elements, they also raise challenges regarding comparisons between studies and functions of the newly identified transcripts.
One group of underappreciated transcripts being uncovered by these genome-wide analyses are RNAs that map opposite annotated coding regions, termed antisense RNAs (asRNAs). The abundance of pervasive antisense transcription start sites (asTSS) was first highlighted in an RNA-seq survey of the human pathogen Helicobacter pylori, where asTSS were identified opposite ∼46% of the genes (3). Subsequent RNA-seq studies in cyanobacteria (4) and Gram-negative (5, 6) and Gram-positive (7–9) bacteria identified asRNAs expressed opposite 2 to 30% of annotated genes. This wide range in numbers of asRNAs reported may reflect differences in bacterial lifestyle or differences in the experimental setup or analyses of the RNA-seq data sets.
Even for the transcriptome analyses of the well-studied model organism Escherichia coli (10–22), the numbers of asRNAs reported range from hundreds to thousands. This significant variation is due, in part, to differences in cDNA library preparation, sequencing technology, and coverage as well as the criteria for what is considered an asRNA. For example, three different RNA-seq studies identified asRNAs opposite ∼2.6% (13), ∼23% (14), and ∼80% (15) of genes. In another study, the number of asRNAs found opposite coding regions ranged from ∼2% to ∼28%, depending on the detection threshold (16).
Despite the hundreds of asRNAs reported, even using the most conservative estimates, it is surprising how few functions have been elucidated for these RNAs. A limited number of asRNAs have been shown to modulate transcription, stability, or translation of the corresponding sense transcripts (reviewed in references 23 and 24). Other recent genome-wide studies have proposed more general functions for asRNAs. These include asRNA-directed digestion of sense transcripts by RNase III in Gram-positive but not Gram-negative organisms (25) and reciprocal effects on the expression of sense RNAs in a so-called “excludon” model (reviewed in reference 26). Still other studies conclude most asRNAs lack function and result from pervasive transcription (16, 27), collisions between replication and transcription machinery (28), or inefficient transcription termination, particularly in the absence of the Rho protein (9, 17, 18), or correspond to contaminating genomic DNA (22).
To further explore the Escherichia coli transcriptome on a genome-wide scale, particularly the subset of asRNAs, we carried out differential RNA sequencing (dRNA-seq) analysis (reviewed in reference 29), which we analyzed by an automated TSS prediction algorithm (30). This approach led us to identify, across three growth conditions, >5,500 potential TSS within genes, 212 divergently transcribed gene pairs with overlapping 5′ untranscribed regions (UTRs), and >5,400 potential asRNA loci. We examined expression of 14 candidate asRNAs by Northern analysis and found 9 to be differentially degraded by RNase III and RNase E, two RNases implicated in asRNA-based regulation. Our global TSS map is one of the best and most sensitive data sets for promoter and transcript identification in the widely used model organism E. coli and is easily accessible at RegulonDB (21) and via an online browser at http://cbmp.nichd.nih.gov/segr/ecoli/.
MATERIALS AND METHODS
Strain construction.
The strains and oligonucleotides used for this study are listed in Tables S1 and S2, respectively, in the supplemental material. The asRNA deletion control strains were constructed using λ Red-mediated recombination (31) to replace the region encompassing the asRNA signal along with 300 nucleotides (nt) on either side with a kanamycin cassette. Deletion constructs were confirmed by sequencing and moved into new wild-type or mutant backgrounds by P1 transduction.
Growth conditions.
Cells were grown at 37°C in LB (10 g of tryptone, 5 g of yeast extract, 10 g of NaCl per liter) or M63 minimal glucose medium (supplemented with final concentrations of 0.001% vitamin B1 and 0.2% glucose) to an optical density at 600 nm (OD600) of ∼0.4 and 2.0 for LB and an OD600 of ∼0.4 for M63. At the indicated OD600, 25 ml of cells (OD600 of 0.4) or 5 ml of cells (OD600 of 2.0) was combined in a 5:1 ratio of cells to stop solution (95% ethanol, 5% acid phenol [pH 4.5]), vortexed, incubated on ice for 10 min, and collected by centrifugation. Cell pellets were snap-frozen in an ethanol-dry ice slurry and stored at −80°C.
Deep-sequencing sample preparation.
Details for sample preparation for deep sequencing can be found in Materials and Methods in the supplemental material. Briefly, RNA extraction for RNA-seq analysis was performed as described previously using hot-acid phenol chloroform (3, 32). RNA samples were treated with DNase I to remove contaminating genomic DNA. RNA samples free of genomic DNA were treated with terminator 5′-phosphate-dependent exonuclease (TEX) (Epicentre) followed by tobacco acid pyrophosphatase (TAP) treatment (Invitrogen) as described previously (3). Control reactions lacking terminator exonuclease were run in parallel for each sample. Unfractionated total RNA was used to construct cDNA libraries for sequencing on GAIIx and HiSeq 2000 machines.
Analysis of deep-sequencing data.
For a detailed description of the read mapping, expression graph construction, normalization of expression graphs, correlation analysis, TSS prediction, comparison to other data sets, and other computational analyses, see Materials and Methods in the supplemental material.
(i) Read mapping.
Between 1.8 and 9.8 million reads for each of the cDNA libraries were mapped to the E. coli MG1655 genome (NCBI accession no. NC_000913.2 [24 June 2004]) using our RNA-seq pipeline READemption (33) and segemehl, with an accuracy cutoff of 95% (34).
(ii) Correlation analysis.
Nucleotide- and gene-wise Spearman and Pearson correlation coefficients were calculated based on concatenated values of forward and reverse strand position-wise coverage files and visualized using the R package corrplot. Gene-wise correlation values utilized read overlap counts based on NCBI annotations (accession no. NC_000913.2).
(iii) TSS prediction.
Transcriptional start site (TSS) prediction was performed using the program TSSpredator (http://it.inf.uni-tuebingen.de/TSSpredator) (30). TSS were classified as primary TSS (pTSS), secondary TSS (sTSS), asTSS, internal TSS (iTSS), or orphan TSS (oTSS) based on the location relative to gene annotations. pTSS and sTSS are within 300 nucleotides upstream of a gene, with pTSS having the highest expression values. All other TSS associated with the gene are considered secondary. iTSS are internal to a gene on the sense strand, while asTSS are internal or within 100 nucleotides of a gene on the opposite strand of the annotation. oTSS do not meet any of the above requirements.
(iv) Comparison to DOOR.
A table containing all operon annotations (1,526 single-gene operons and 851 operons consisting of multiple genes) was downloaded from the Database of prOkaryotic OpeRons (DOOR) 2.0 website (35) and compared to a final set of 2,441 TSS.
(v) Comparison of pTSS and sTSS to RegulonDB promoters.
We extracted 6,406 TSS annotated based on the “strong evidence” classification (21) from the RegulonDB promoter table (version RegulonDB 8.5, 11-28-2013) and classified them according to our classification scheme, resulting in a set of 3,987 pTSS and sTSS. We conducted a pairwise comparison of the positions to our data (4,261 pTSS and sTSS) based on a maximum allowed distance of 3 nt.
(vi) Expression analysis and binning.
Expression values for predicted TSS classified as exclusively antisense or exclusively primary or secondary were calculated based on overlap counts for a 50-nt window downstream of the respective TSS position from which reads per kilobase per million mapped reads (RPKM) values were calculated (36). The TSS were grouped into six bins according to their RPKM values.
(vii) Comparison of asRNAs detected in our and previous studies.
asTSS annotations were retrieved from the Materials and Methods sections in the supplemental material from published studies (13, 14, 16, 19) or were downloaded from RegulonDB (data set version 3.0 [21] and data set version 2.0 [20]). We excluded the study by Li et al. (15), which revealed >82,000 asTSS, as this number is very high compared to previous studies and our study and thus would bias the comparative analyses. We compared the asTSS from each data set, including our 6,379 predicted asTSS, to the asTSS of all other data sets in a pairwise manner, requiring either a precise match of the annotated positions or allowing a variation of 1, 2, 3, or 10 nt.
Northern analysis.
RNA extraction for Northern analysis was performed using TRIzol reagent (Invitrogen). Northern analysis of 10 μg of total RNA was performed on denaturing 8% acrylamide–7 M urea gels as described previously (37), with minor changes for detection using riboprobes (for details and oligonucleotides used to create the riboprobes, see Materials and Methods in the supplemental material).
RNA-seq data accession number.
Raw sequence reads were uploaded to the Gene Expression Omnibus (GEO) database (http://www.ncbi.nlm.nih.gov/geo) under accession no. GSE55199.
RESULTS
dRNA-seq reveals the primary transcriptome of E. coli MG1655.
To detect the transcripts expressed by E. coli, we collected two independent biological replicates (B1 and B2 samples) from MG1655 wild-type cells grown to the exponential phase (OD600 of ∼0.4) or stationary phase (OD600 of ∼2.0) in LB medium (samples LB 0.4 and LB 2.0, respectively) or grown to the exponential phase (OD600 of ∼0.4) in M63 minimal glucose medium (sample M63 0.4) (Fig. 1; see also Table S3 in the supplemental material). For all six biological samples, total RNA was extracted and subjected to dRNA-seq library preparation for primary transcriptome analysis as described previously (3). Specifically, prior to cDNA library construction, half of each RNA sample was treated with 5′ terminator exonuclease (+TEX samples), which degrades RNAs containing a 5′-monophosphate (5′-P), thereby enriching for primary transcripts containing 5′-triphosphates (5′-PPP). The other half of each sample was left untreated (−TEX samples) and thus contains both primary transcripts (5′-PPP) and processed RNAs (5′-P). Subsequently, the 5′-PPP ends in both samples were converted to 5′-P ends for cDNA library preparation.
FIG 1.

Summary of the biological, library, and Illumina sequencing replicates that were subjected to dRNA-seq analysis in this study.
The cDNA libraries of the first biological replicates (B1-L1) were sequenced on an Illumina Genome analyzer IIx (GA samples), while the second biological replicates (B2-L1) were sequenced on a HiSeq 2000 sequencer (HS1 samples). To examine variation between sequencing runs, the B2-L1 libraries were resequenced using the HiSeq 2000 (HS2 samples). To identify variation introduced during library preparation, technical replicates of the LB 2.0 libraries (B1-L2 and B2-L2 samples) were also generated and sequenced using the HiSeq 2000 (Fig. 1; see also Table S3 in the supplemental material).
Strand-specific sequencing resulted in a total number of ∼1.8 to 3.6 million reads per sample for the GA set and ∼5.3 to 9.8 million reads per sample for the HS sets after quality trimming (see Table S4 in the supplemental material). For all of the libraries, >70% of the reads could be mapped to the E. coli genome (NCBI accession no. NC_000913.2) indicating that the sequencing runs consisted of numerous high-quality reads. Read mapping analysis showed that for all three growth conditions, 65 to 80% of reads mapped to annotated regions of the genome while 2 to 6% mapped antisense to published annotations. The remainder of the reads mapped to unannotated intergenic regions, which also include UTRs (see Table S5 in the supplemental material). These data indicate the majority of transcripts correspond to the sense strand of genes; however, a small percentage of antisense transcription occurs, particularly opposite mRNAs.
Correlation analysis reveals variation associated with library preparation and sequencing platform.
To assess the similarity between replicates, we calculated Spearman and Pearson correlation coefficients for nucleotide-wise expression values for both strands of all the −TEX and +TEX libraries (see Fig. S1 in the supplemental material). For each biological condition and both types of analysis, we noted the highest correlation among sequencing replicates (B2-L1-HS1 and B2-L1-HS2). The lowest correlation was between libraries sequenced on the GAIIx and HiSeq 2000, likely due to differences in sequence coverage and cDNA library preparation protocols for the two platforms. Since the nucleotide-wise correlations are sensitive to slight fluctuations in cDNA read counts, we also assessed the correlation coefficients for gene-wise expression values, defined as the number of mapped reads within genes annotated by NCBI, among the −TEX and +TEX libraries. Overall the correlation increased but had a pattern similar to that seen for the nucleotide-wise comparisons.
Despite the high correlation between replicates and overall similar cDNA coverage patterns, a few regions showed variable expression or enrichment in the +TEX libraries across samples, likely due to the number of reads produced by the different sequencing instruments combined with differences in library preparation. However, as we had high correlation between replicates, similar read distributions across replicates, and agreement on the positions of transcript ends, we proceeded with automated genome-wide TSS annotation.
The automated TSSpredator pipeline predicts previously unannotated TSS.
Several RNA-seq-based studies have reported genome-wide annotations of 5′ ends of E. coli genes, but most cannot distinguish between primary and processed transcripts, limiting the potential to identify these distinct types of transcripts (12, 20). Our dRNA-seq approach allows for the precise annotation of TSS based on a characteristic enrichment pattern in the +TEX libraries relative to the −TEX libraries, which facilitates the differentiation between primary (5′-PPP) and processed (5′-P) transcripts (see Fig. S2A in the supplemental material) (3). In previous dRNA-seq studies, global (TSS) annotations were carried out by laborious manual inspection of enrichment patterns (3, 5, 6). To automate this annotation step, we utilized the TSSpredator pipeline recently developed to annotate TSS among multiple strains of Campylobacter jejuni (30). The TSSpredator prediction algorithm employs the dRNA-seq data to determine the location of a TSS based on identifying positions with sharp increases in expression in the +TEX library relative to the untreated −TEX control (see Fig. S2A and Materials and Methods in the supplemental material).
Using TSSpredator, TSS can be annotated in a comparative manner among libraries through the integration of replicate information. If a strong enrichment is observed in one replicate, less strict parameters can be applied to the same position in other replicates to ensure identification of TSS despite differences in library or sequencing preparations while still maintaining stringent criteria for detection. To perform such an analysis for our replicates of the three biological conditions (see Materials and Methods in the supplemental material), we adjusted the “matching replicates” parameter, which defines the minimum number of replicates in which a TSS must be detected for a particular biological condition. For the M63 0.4 and LB 0.4 conditions, where only three replicates were available, we required a TSS to be detected in at least two replicates, while for the LB 2.0 condition, we required detection in at least three of the five replicates. All other parameters were set to default values as established previously (30).
We predicted a total of 14,868 potential TSS mapping throughout the E. coli genome (see Data set S1 in the supplemental material). Of these, 6,297 were detected under all three conditions, 1,151 were detected only in cells growing exponentially in M63 minimal medium, 470 TSS were found in cells growing exponentially in LB, and 1,947 were found in stationary-phase cells growing in LB (Fig. 2A; see also Fig. S3A in the supplemental material for examples of TSS detected under only one condition). The higher number of TSS identified for the LB stationary-phase cells might be a result of changes in transcriptional programs required to survive in the stationary phase (38).
FIG 2.
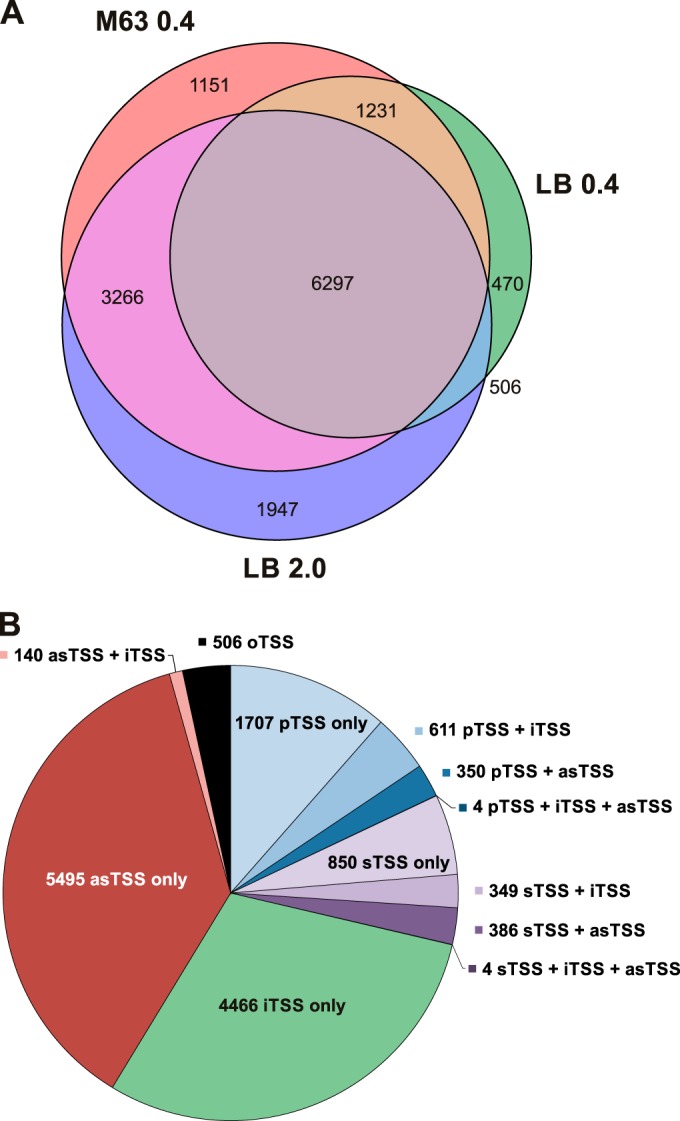
Automated TSS prediction across three different growth conditions using TSSpredator. (A) Distribution of predicted TSS across the biological conditions M63 0.4, LB 0.4, and LB 2.0. (B) Distribution of predicted TSS in the primary, secondary, internal, orphan, and antisense TSS classes (pTSS, sTSS, iTSS, oTSS, and asTSS, respectively).
TSSpredator automatically assigns TSS to five different classes: primary TSS (pTSS; main transcription start of a gene or operon), secondary TSS (sTSS; alternative start with lower expression), internal TSS (iTSS; start within a gene), antisense TSS (asTSS; transcript start antisense to a gene ±100 nt), and orphan TSS (oTSS; not associated with annotation) based on the location relative to existing gene annotation (see Fig. S2B in the supplemental material). A TSS can fall into more than one category, depending on its location relative to the surrounding gene annotations. For example, in the case of overlapping 5′ UTRs, a particular TSS can be both a pTSS and an asTSS. For downstream genes within operons, a pTSS can also be internal to the upstream genes. Among the 14,868 predicted TSS, we identified 2,672 pTSS (1,707 classified solely as pTSS), 1,589 sTSS (850 classified solely as sTSS), 5,574 iTSS (4,466 classified solely as iTSS), and 6,379 asTSS (5,495 classified solely as asTSS) (Fig. 2B).
To assess the coverage of our TSS predictions, we compared the number of TSS classified as pTSS only or pTSS and asTSS (2,057) and the number classified as pTSS and iTSS or pTSS, iTSS, and asTSS (615) with the number of genes classified as single-standing genes (1,526) or first genes within operons (851) in the Database of prOkaryotic OpeRons (DOOR) (35). In total, after excluding all TSS assigned to genes not annotated in DOOR (see Materials and Methods in the supplemental material), we used 2,441 of our TSS classified as pTSS. In agreement with the assumption that a pTSS must precede genes annotated as single genes or first genes in DOOR, we detected a pTSS for ∼78% of the single-standing or first genes in operons (1,847/2,377) (see iclR in Fig. S3B in the supplemental material). The ∼22% of single or first genes of operons for which no pTSS was predicted by our data (530/2,377) (see ybeT in Fig. S3B) generally were missed due to low read coverage. For several of the genes without detected TSS, we found a processing site upstream, as indicated by an enrichment in the −TEX compared to the +TEX libraries, indicating that they could be cotranscribed with upstream genes (see fbaA in Fig. S3B).
Approximately 24% (594/2,441) of genes for which we detected a pTSS were not classified in DOOR as single or first genes in an operon. The majority of these TSS likely correspond to real promoters that are located internal to upstream genes within an operon defined by DOOR (see thrA in Fig. S3B in the supplemental material). These TSS could drive transcription of unannotated alternative suboperons and thereby uncouple expression of the subset of genes from the longer operon. Some of these TSS are also found upstream of genes previously predicted to be in operons but are likely single genes (see pheM in Fig. S3B). Overall, these comparisons indicate that despite previous global transcriptome studies, the full complexity of the E. coli transcriptome is not yet known.
A comparison of our TSS predictions with TSS annotated in RegulonDB (21), using a maximum distance of 3 nt, revealed that ∼34% of our pTSS and sTSS overlap those annotated in RegulonDB (see Data set S1 in the supplemental material), while ∼41% of the TSS from RegulonDB, classified as pTSS or sTSS, overlap our predictions. A TSS detected in our data but previously not annotated in RegulonDB is the pTSS for lspA, encoding a prolipoprotein signal peptidase, located internal to the upstream ileS gene (Fig. 3A). A promoter corresponding to the TSS based on direct experimental evidence was previously reported (39). Figure 3B shows a clear exponential-phase-specific pTSS for plsX, encoding a putative phosphate acyltransferase, although no evidence was present in RegulonDB, and the sequence does not carry an obvious promoter consensus sequence. These discrepancies illustrate that, even in a well-studied model organism like E. coli, TSS annotation is still incomplete. We next carried out further characterization of the noncanonical iTSS and asTSS.
FIG 3.
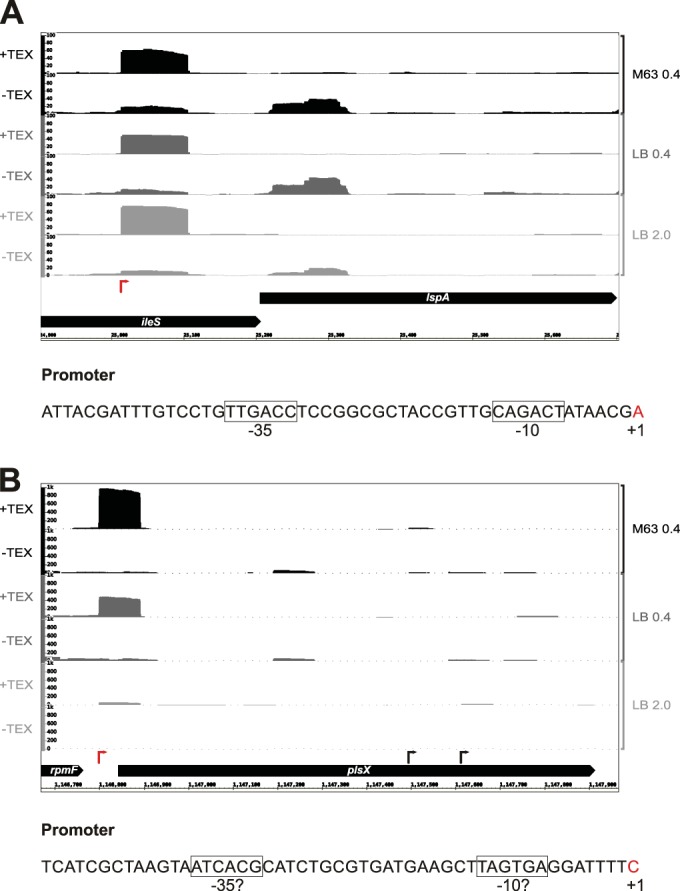
Examples of genes with newly detected pTSS. Screenshots showing the relative cDNA coverage plots for representative −TEX or +TEX libraries for the M63 0.4, LB 0.4, and 2.0 growth conditions across the genomic regions encompassing the lspA (A) and plsX (B) genes. The x axis depicts the genomic coordinates, while the y axis indicates the relative cDNA scores (normalized number of mapped cDNA reads). Red arrows indicate the previously unannotated TSS detected by our analysis. Promoter sequences for the new TSS, including the −10 and −35 sequences (boxed) and bases corresponding to TSS (red) are depicted below each plot.
iTSS are abundant and frequently located at the 3′ ends of genes.
We identified 5,574 iTSS internal to annotated genes (Fig. 2B). It was recently reported that the majority of iTSS identified in the Gram-negative bacterium Shewanella oneidensis are present near the 5′ or 3′ ends of the genes (40). For a comparison, we examined the location of the 4,466 iTSS classified as iTSS only as one group and the 968 iTSS that are also annotated as pTSS or sTSS as a second group. Each annotated gene in which an iTSS was detected was divided into 10 equal sections, and the number of iTSS located in each section was counted for all genes. Those classified as iTSS only showed a broad distribution with similar numbers across the entire gene (see Fig. S4A in the supplemental material). In contrast, for the group of iTSS also classified as pTSS or sTSS, the majority (∼86%) were located in the last 30% of the gene (see Fig. S4B). These 86% are likely TSS for downstream genes, driving alternative expression of suboperons (for an example, see thrA in Fig. S3B in the supplemental material) or the synthesis of small regulatory RNAs corresponding to the 3′ ends of mRNAs as was observed for the MicL RNA, whose promoter is within the cutC gene (41). Whether any of the iTSS in other categories result from spurious transcription or are generating functional alternative mRNAs or regulatory RNAs will require further characterization.
pTSS and sTSS from divergently transcribed gene pairs could also serve as asRNA regulators.
In addition to the 5,495 TSS classified as asTSS only, we identified 350 pTSS and 386 sTSS that are also classified as asTSS. Examination of the regions encompassing these TSS revealed 212 divergently transcribed gene pairs with possible overlapping 5′ UTRs (see Data set S2A in the supplemental material), which could result in asRNA-mediated regulation of these genes (reviewed in reference 26) or could influence promoter occupancy (42). The set includes several gene pairs that encode proteins of opposing function, such as entS and fepD, encoding an enterobactin efflux system and a ferric enterobactin ABC transporter, respectively, and pspF and pspA, encoding the transcription factor PspF (phage shock protein F) and its antagonizing regulatory protein, PspA (see Fig. S5 in the supplemental material). Further characterization of these gene pairs will be required to determine if asRNA-mediated regulation occurs via the overlapping 5′ UTRs.
Some asTSS show high or differential levels of expression.
Given that several asRNAs with characterized functions are expressed at high levels (reviewed in reference 43), we compared the relative expression levels for the 5,495 asTSS only (see Data set S3 in the supplemental material) to all pTSS only and sTSS only (see Data set S1 in the supplemental material) and TSS corresponding to known annotated asRNAs (see Table S6 in the supplemental material). We calculated reads per kilobase per million mapped reads (RPKM) values for all libraries utilizing a 50-nt window downstream of the predicted asTSS. The TSS were subsequently grouped into <10, 10 to 102, 102 to 103, 103 to 104, 104 to 105, and >105 bins according to their RPKM values. Using the highest expression value for a TSS among all conditions, we plotted the distribution of exclusively asTSS, exclusively pTSS or sTSS, and known annotated asRNAs for all conditions (Fig. 4A) and for each library individually (data not shown). For both the combined and individual sets, the distributions for pTSS or sTSS differ from the distributions for asTSS. Most pTSS or sTSS group within the 102 to 103 and 103 to 104 expression bins, while most asTSS are in the 10 to 102 and 102 to 103 expression bins (Fig. 4A). In contrast, most previously annotated asRNAs fall into the 103 to 104 and 104 to 105 bins. These distributions suggest that while a subset of asRNA candidates could be present at a high level, the majority of our predicted asRNA candidates might only exist as a few copies per cell or might be unstable transcripts that are rapidly degraded during RNA isolation and library preparation.
FIG 4.

Comparison of asTSS. (A) Distribution of only asTSS, only pTSS or sTSS, and NCBI-annotated asRNAs in RPKM expression bins. The RPKM expression values were calculated based on cDNA read counts within 50-nt windows starting at the TSS. (B) Distribution of TSS classified exclusively as asTSS across the three biological conditions M63 0.4, LB 0.4, and LB 2.0. (C) Pairwise comparison of asTSS identified by our study and in previously published studies by Conway et al. (19), Dornenburg et al. (14), Raghavan et al. (16), Shinhara et al. (13), Mendoza-Vargas et al. (20), and Salgado et al. (21). The total numbers of annotated asTSS are shown on the main diagonal of the matrix. asTSS from the studies in the rows are compared to the studies in columns, and the number of TSS with exact matches is reported in the matrix entries. The background color depicts the percentage of overlapping asTSS relative to the total number of asTSS from the study in the particular row.
Since several functional asRNAs are expressed under specific conditions (44, 45), we also examined the distribution of the predicted asTSS across the different growth conditions (Fig. 4B). A total of 2,071 of the 5,495 asTSS were detected under all conditions. In general, candidate asRNAs in the >105 expression bin, showed a high signal for all growth conditions and library replicates (see Data set S3 in the supplemental material). Like the overall TSS distribution, most condition-specific asTSS were detected in LB 2.0 (719), many of which are found in the 104 to 105 expression bin, followed by M63 0.4-specific asTSS (516), and LB 0.4-specific asTSS (205). There was significant overlap (1,285) between asTSS detected in exponential growth in M63 minimal glucose and stationary-phase LB medium, but limited overlap (145) between asTSS detected in the exponential- and stationary-phase LB samples. Again, these distributions mirror the ratios in the overall transcription profiles.
The majority of pTSS, iTSS, and asTSS are preceded by σ70 promoter elements.
To detect potential differences between the promoters corresponding to the pTSS, iTSS, and asTSS, we compared the difference in expression for the pTSS only, iTSS only, and asTSS only detected in LB 0.4 with those detected in M63 0.4 (see Fig. S6 in the supplemental material). Overall, there were proportionally more pTSS showing differential expression than iTSS and asTSS. This suggests that the pTSS generally are more highly regulated.
We also examined the sequences upstream of the 1,707 pTSS only, 4,466 iTSS only, and 5,495 asTSS using the MEME software (46). With a window of −50 to +1 relative to the TSS, the promoter motifs derived for the three classes of TSS overall were very similar (see Fig. S7 in the supplemental material). All had a potential −10 element resembling the TATAAT consensus for the housekeeping σ70 transcription factor (reviewed in reference 47). The enrichment for two T residues comprising a potential σ70 −35 element was significantly less than what was observed for the −10 element; however, both pTSS and iTSS logos showed some enrichment for a G at position −14, characteristic of an extended −10 sequence associated with σ70 promoters with weak −35 elements. A window of −50 to +5 relative to the TSS revealed that a subset of pTSS, iTSS, and asTSS show enrichment for a purine at +1 and a pyrimidine at −1, features of E. coli σ70 promoters reported previously (10). Overall, despite differences in the dRNA-seq signal, most of the pTSS, iTSS, and asTSS are likely transcribed by the σ70 holoenzyme.
Comparison of asTSS prediction with published data sets reveals limited overlap in candidate asRNAs.
A number of transcriptome data sets have recently been published for E. coli with different extents of antisense transcription reported (13–16, 19–21). Given the discrepancy in numbers of annotated asRNAs, we were interested in the extent of overlap between our asRNA predictions and those of the other studies. For our cross-study comparison, we only included studies where detailed asRNA annotations were provided. We compared our asTSS only (see Data set S3 in the supplemental material) to the asRNA candidates reported by each group rather than to the primary data, given the differences in data generation, analysis, quality, and quantity of reads mapping to the E. coli genome (see Table S7 in the supplemental material). We first required the TSS positions between two studies to match precisely (Fig. 4C). This resulted in very limited overlap across the studies. The largest overlap occurred between our data set and that of Shinhara et al. (13), with 33% of their asRNAs overlapping our predictions. In some cases, increasing the window size within which an asTSS could match, to 1, 2, 3, or 10 nt, increased the overlap between studies (see Fig. S8 in the supplemental material). For example, with the 1-nt window, 79% (71/90) of the asRNAs detected by Raghavan et al. (16) corresponded to an asTSS in our data compared to ∼12% (11/90) when an exact match was required. In other cases, the increase in window size did not make much difference. There was no overlap between the asRNAs predicted by Mendoza-Vargas et al. (20) compared to Raghavan et al. (16), Shinhara et al. (13), and Salgado et al. (21), regardless of the window size. The discrepancies between the asTSS reported likely result from combinations of differences in the quality of the sequencing reads, analysis pipelines, expression cutoffs, and definitions of what constitutes an asRNA.
We also compared our asTSS map to a recent study by Lybecker et al. examining the double-stranded transcriptome of E. coli (48). The premise of this study was that RNAs under asRNA-mediated control would be present in double-stranded RNA duplexes and thus should be identified by coimmunoprecipitation (co-IP) with a double-stranded RNA (dsRNA)-specific antibody followed by RNA-seq. We compared these reported IP dsRNAs to our asTSS set and considered them to match if an asTSS is found within the region 10 nucleotides upstream of an IP dsRNA 5′ end to 10 nucleotides upstream of the corresponding 3′ end on at least one strand (see Data set S2B in the supplemental material). We excluded the class of overlapping 3′ UTRs identified by Lybecker et al. from our analysis as they are not covered by our dRNA-seq, which sequences from the 5′ end of transcripts. This comparison yielded matching asTSS for 63% of the IP dsRNAs (193/308).
Candidate asRNAs are detected as distinct bands by Northern analysis.
As independent verification of the predicted asRNAs, we selected a panel of 14 candidate asRNAs for Northern analysis (Fig. 5; see also Fig. S9 and Table S8 in the supplemental material). While we primarily selected candidates from the two highest-expression bins (see Data set S3 in the supplemental material), we also randomly selected a few candidates, which showed differences in expression among growth conditions or were not detected by others, from the third expression bin. We employed riboprobes covering the region of the dRNA-seq signal and importantly also probed total RNA from control strains where the region of mapped signal was deleted from the E. coli chromosome. In addition, we included total RNA isolated from strains defective for ribonucleases reported to be involved in asRNA processing and degradation; an rnc mutant lacking RNase III, an endonuclease that cleaves double-stranded RNAs, and an rne-131 mutant with defective RNase E, an essential endonuclease that associates with the RNA degradosome and cleaves single-stranded RNA. The C terminus of RNase E is deleted in the rne-131 mutant, such that the enzyme can no longer associate with the degradosome, thus giving rise to reduced RNA turnover (49, 50).
FIG 5.

Northern blot detection and cDNA coverage plots of selected candidate asRNAs from the top three expression bins. In all cases, wild-type E. coli strain MG1655, the corresponding deletion strain for the particular asRNA as well as an rnc deletion strain, and an RNase E (rne-131) mutant strain were grown in LB or M63 supplemented with glucose until they reached the indicated OD600. Samples were processed for Northern analysis and probed with a riboprobe specific for the asRNAs. The bands corresponding to the asRNAs are indicated with black stars. Schematics of cDNA coverage plots and genomic locations encoding the respective candidate asRNAs are shown on the right, with the position and direction of the asTSS indicated by red arrows. y axes indicating relative cDNA coverage have the same scale for the forward and reverse strands.
We detected clear specific bands for RNA isolated from wild-type cells for six of the candidate asRNAs (as-gsiB, as-argR, as-ymfL, as-eutB, as-speA, and as-yliF) (Fig. 5; see also Fig. S9 in the supplemental material). Specific bands for five other candidates (as-qorA, as-holE, as-serU, as-thrW, and as-ytfJ) were most evident in one or both of the RNase mutant strains, while three candidates (as-yeaJ, as-gmr, and as-yggN) were only detected as smears. For 10 of the probes, we detected nonspecific bands present in all lanes serving as a loading control and emphasizing the importance of including samples from control deletion strains.
asRNAs show differential sensitivity to degradation by RNase E and RNase III.
We were surprised to find that the RNase mutants had varied impacts on the levels of our asRNA candidates. First, counter to expectations, the levels of some asRNAs, such as as-ymfL and as-speA were decreased in both RNase mutant strains (Fig. 5; see also Fig. S9 in the supplemental material). Possibly these asRNAs are destabilized by interactions with RNAs that are normally degraded by RNase III and RNase E, or alternatively, processing is required for stabilization of these transcripts (51). The levels of three asRNAs (as-argR, as-qorA, and as-eutB) were elevated in the rne mutant, while the levels of four others (as-holE, as-serU, as-ytfJ, and as-thrW) were greatly elevated in the rnc mutant relative to the wild-type strain. Northern analysis carried out with RNA isolated from rnc mutants lacking the four chromosomal regions confirmed that the signal was specific (see Fig. S10 in the supplemental material; data not shown for as-thrW). Overall, these observations show that our detected asRNAs are substrates for different RNases and that regulation of asRNA levels by RNases may be more complex than previously thought.
DISCUSSION
In this study, we applied dRNA-seq and automated TSS prediction to the E. coli K-12 strain MG1655 grown under three different conditions to reveal >14,000 candidate TSS, of which >5,500 correspond to potential iTSS and >5,400 correspond to potential asRNAs. In contrast to previous E. coli transcriptome studies, dRNA-seq allowed us to globally map TSS since the approach specifically captures primary 5′ ends and thus allows discrimination between processed and primary transcripts. Our global TSS map and coverage plots are integrated into RegulonDB and are easily accessible in an online browser at http://cbmp.nichd.nih.gov/segr/ecoli/, which allows researchers to readily identify candidate TSS and examine relative expression for their genes of interest. Our data represent a useful resource for the further characterization of promoters and novel RNAs in E. coli.
Automated TSS prediction has advantages and disadvantages.
While the dRNA-seq analysis combined with automated TSS prediction used here provides a wealth of information, some reflection on the advantages and disadvantages is warranted. An automated approach for TSS annotation avoids potential bias introduced by manual annotation given that it follows defined rules and parameters. Automated annotation also facilitates rapid repetition of the analysis with different parameters or with additional data sets, a refinement that is impractical for manual annotation, especially for larger genomes or multiple strains or multiple conditions. However, choosing the right parameters for automated annotation, with the appropriate balance between sensitivity and specificity, can be difficult. Increasing the stringency for detection, for example, by filtering for those TSS whose step height is greater than 10 (see Data set S1 in the supplemental material) would reduce the number of TSS to ∼4,400 (data not shown). Additionally, we analyzed the data for two of our LB 2.0 samples using another automated annotation program, TSSAR, with default parameters (52). This program predicted almost twice as many TSS as the TSSpredator program (data not shown) but is unable to integrate information from replicate samples. Therefore, for the TSS map presented in this study, we chose to use the parameters established on the basis of manual annotation of Helicobacter pylori dRNA-seq data and used for TSS annotation in Campylobacter jejuni (3, 30), which predicted TSS that were most consistent with manual annotation of selected regions of our E. coli data.
The automated TSSpredator program employed here led to the prediction of many more TSS candidates in E. coli than for other manually annotated data sets. To understand this difference between manual and automated annotations, we carried out automated TSS prediction using our E. coli parameters with the Salmonella dRNA-seq data sets from Kröger et al. (6). For the Salmonella dRNA-seq sets, we predicted ∼22,000 potential candidate TSS, of which ∼9,700 were found under all conditions (data not shown). These numbers are 4-fold higher than the TSS predicted by manual annotation. During manual TSS annotation, TSS corresponding to poorly expressed RNAs may not be annotated, resulting in underdetection of potential promoters transcribed at low levels. On the other hand, a higher discovery rate associated with automated TSS prediction may result in the false annotation of some promoters. It is also likely that our global map is still not saturated and that we have missed TSS that are not expressed under the limited growth conditions examined, as has been found for studies of Salmonella grown under a wide range of conditions (6).
Comparison of deep-sequencing data sets reveals sources of variation.
When we compared our replicate deep-sequencing data sets, we found variation between different library preparations and sequencing platforms. The comparison of biological and technical replicates revealed that library preparation itself can lead to larger variation than found among biological replicates for which cDNA libraries were generated in parallel. 't Hoen et al. similarly found that library preparation is a major source of variation for human samples (53).
Our comparisons of asRNAs predicted by different published RNA-seq data sets further highlighted discrepancies and led us to consider additional sources of variation. Differences in RNA isolation protocols might limit the ability to capture unstable transcripts or RNAs of certain sizes. For example, small RNA fractions are often lost in column-based purification methods, and rRNA depletion kits can lead to unintended removal of non-rRNA transcripts. The use of terminator exonuclease (TEX) treatment to enrich for primary transcripts may miss the TSS of RNAs that are monophosphorylated due to the pyrophosphate removal by the enzyme RppH (54). However, we identified TSS for the majority of validated RppH targets, suggesting this is not a significant limitation in our data set (data not shown). Other inherent properties of the RNA molecules also can be a source for bias as it has been reported that RNAs with high GC content are less readily amplified and that linker ligation is more efficient when certain nucleotides are at the 3′ and 5′ ends (55).
Additionally, differences in data analysis, including differences in read quality filtering, mapping protocols (using all or only uniquely mapped reads), and especially different methods and thresholds for assembling and annotating transcripts, can lead to significantly different results. Despite a rapid increase in data generation, the availability of standardized RNA-seq analysis pipelines is still limited (56), particularly for bacterial transcriptomes. Nevertheless, RNA-seq has been an invaluable resource and has revolutionized bacterial, archaeal, and eukaryotic transcriptome analyses. Hopefully, as the field of deep sequencing continues to mature, standards for sample preparation, depth of sequencing, number of replicates sequenced, and data analysis as well as simple platforms for shared data visualization can be developed that will facilitate the comparisons of data generated by different groups.
Independent documentation of asRNAs is advised before functional analysis.
Our dRNA-seq approach revealed more than 5,400 asTSS. We do not know how many of these predicted asTSS correspond to spurious transcripts rather than functional RNAs, although some show differential expression under the growth conditions examined (see Data set S3 in the supplemental material). The above-mentioned RNA-seq study of Salmonella, which analyzed RNAs from 22 different growth conditions, reported <500 asRNAs (5, 6). These authors found that ∼1.75% of their reads mapped antisense to annotations (5) which is similar to what we observed (2 to 4%) (see Table S5 in the supplemental material) and to what has been reported for another E. coli RNA-seq study (∼2%) (16). Thus, the high number of asTSS we detect probably is not due to large differences in general transcriptome coverage but rather is due to differences in data analyses and annotation. Moreover, we specifically enriched for the 5′ ends of transcripts, which might be more stable than internal degradation fragments, and did not include fragmentation steps that could result in the lower numbers of sequenced 5′ ends of transcripts.
As our comparison among different E. coli studies showed, there is extensive variation in asRNA annotation. Nevertheless, we found that several asRNAs were detected in multiple RNA-seq studies (Fig. 4C; see also Fig. S8 and Data set S3 in the supplemental material). Given the laborious process of functional investigation, however, we propose that further validation of asRNAs with appropriate controls is critical for defining candidates for further study. We independently validated expression of 14 candidate asRNAs by Northern analysis. For several of the asRNA candidates tested, nonspecific bands were detected in all lanes, emphasizing the importance of including samples from the control deletion strains. Expression was tested by Northern or quantitative PCR (qPCR) analysis for a subset of previously predicted asRNAs (13, 16, 48), although none of these studies included control deletion strains.
Overall, with the exponential increase in deep-sequencing studies and rapidly improving sequencing performance and coverage, more and more asRNA candidates will be reported in all organisms. To answer the questions of how many asRNAs identified in these analyses function as base-pairing RNA regulators, are used on a global scale for driving RNA processing, or are abortive transcripts resulting from degenerate promoters or RNA polymerase collisions, will require further experimental validation and characterization. Automated prediction of candidate asRNAs as reported here, combined with detection by multiple approaches, by multiple studies, or under specific growth conditions, will help identify those candidates most promising for future examination of phenotypes associated with the lack of the asRNA as well as mechanisms of asRNA action.
Supplementary Material
ACKNOWLEDGMENTS
We thank R. Reinhardt (Max Planck Genome Center, Cologne, Germany) for help with deep sequencing and vertis Biotechnologie AG for cDNA library preparation, E. P. Greenberg for work conducted by M.K.T. in his lab, and T. Conway for sharing data prior to publication. We also thank J. Hinton for discussions and J. Chen, S. Gottesman, and participants in the EMBO Lecture Course on the Biology of Bacterial Noncoding RNAs for comments on the manuscript.
Work in the Sharma laboratory is supported by the ZINF Young Investigator program of the Research Center for Infectious Diseases (ZINF) at the University of Würzburg, the Bavarian BioSysNet Program, and the Deutsche Forschungsgemeinshaft Project Sh580/1-1. Work in the Storz laboratory is supported by the Intramural Program of the Eunice Kennedy Shriver National Institute of Child Health and Human Development. For research stays in the Storz laboratory, S.K.E. was supported by a PROMOS travel scholarship (DAAD) of the University of Würzburg and C.M.S. was supported by a Boehringer Ingelheim Fonds travel allowance.
Footnotes
Supplemental material for this article may be found at http://dx.doi.org/10.1128/JB.02096-14.
REFERENCES
- 1.Croucher NJ, Thomson NR. 2010. Studying bacterial transcriptomes using RNA-seq. Curr Opin Microbiol 13:619–624. doi: 10.1016/j.mib.2010.09.009. [DOI] [PMC free article] [PubMed] [Google Scholar]
- 2.van Vliet AH. 2010. Next generation sequencing of microbial transcriptomes: challenges and opportunities. FEMS Microbiol Lett 302:1–7. doi: 10.1111/j.1574-6968.2009.01767.x. [DOI] [PubMed] [Google Scholar]
- 3.Sharma CM, Hoffmann S, Darfeuille F, Reignier J, Findeiss S, Sittka A, Chabas S, Reiche K, Hackermuller J, Reinhardt R, Stadler PF, Vogel J. 2010. The primary transcriptome of the major human pathogen Helicobacter pylori. Nature 464:250–255. doi: 10.1038/nature08756. [DOI] [PubMed] [Google Scholar]
- 4.Mitschke J, Georg J, Scholz I, Sharma CM, Dienst D, Bantscheff J, Voss B, Steglich C, Wilde A, Vogel J, Hess WR. 2011. An experimentally anchored map of transcriptional start sites in the model cyanobacterium Synechocystis sp. PCC6803. Proc Natl Acad Sci U S A 108:2124–2129. doi: 10.1073/pnas.1015154108. [DOI] [PMC free article] [PubMed] [Google Scholar]
- 5.Kröger C, Dillon SC, Cameron AD, Papenfort K, Sivasankaran SK, Hokamp K, Chao Y, Sittka A, Hebrard M, Händler K, Colgan A, Leekitcharoenphon P, Langridge GC, Lohan AJ, Loftus B, Lucchini S, Ussery DW, Dorman CJ, Thomson NR, Vogel J, Hinton JC. 2012. The transcriptional landscape and small RNAs of Salmonella enterica serovar Typhimurium. Proc Natl Acad Sci U S A 109:E1277–1286. doi: 10.1073/pnas.1201061109. [DOI] [PMC free article] [PubMed] [Google Scholar]
- 6.Kröger C, Colgan A, Srikumar S, Händler K, Sivasankaran SK, Hammarlöf DL, Canals R, Grissom JE, Conway T, Hokamp K, Hinton JC. 2013. An infection-relevant transcriptomic compendium for Salmonella enterica serovar Typhimurium. Cell Host Microbe 14:683–695. doi: 10.1016/j.chom.2013.11.010. [DOI] [PubMed] [Google Scholar]
- 7.Wiegand S, Dietrich S, Hertel R, Bongaerts J, Evers S, Volland S, Daniel R, Liesegang H. 2013. RNA-Seq of Bacillus licheniformis: active regulatory RNA features expressed within a productive fermentation. BMC Genomics 14:667. doi: 10.1186/1471-2164-14-667. [DOI] [PMC free article] [PubMed] [Google Scholar]
- 8.Wurtzel O, Sesto N, Mellin JR, Karunker I, Edelheit S, Becavin C, Archambaud C, Cossart P, Sorek R. 2012. Comparative transcriptomics of pathogenic and non-pathogenic Listeria species. Mol Syst Biol 8:583. doi: 10.1038/msb.2012.11. [DOI] [PMC free article] [PubMed] [Google Scholar]
- 9.Nicolas P, Mader U, Dervyn E, Rochat T, Leduc A, Pigeonneau N, Bidnenko E, Marchadier E, Hoebeke M, Aymerich S, Becher D, Bisicchia P, Botella E, Delumeau O, Doherty G, Denham EL, Fogg MJ, Fromion V, Goelzer A, Hansen A, Hartig E, Harwood CR, Homuth G, Jarmer H, Jules M, Klipp E, Le Chat L, Lecointe F, Lewis P, Liebermeister W, March A, Mars RA, Nannapaneni P, Noone D, Pohl S, Rinn B, Rugheimer F, Sappa PK, Samson F, Schaffer M, Schwikowski B, Steil L, Stulke J, Wiegert T, Devine KM, Wilkinson AJ, van Dijl JM, Hecker M, Volker U, Bessieres P, Noirot P. 2012. Condition-dependent transcriptome reveals high-level regulatory architecture in Bacillus subtilis. Science 335:1103–1106. doi: 10.1126/science.1206848. [DOI] [PubMed] [Google Scholar]
- 10.Kim D, Hong JS, Qiu Y, Nagarajan H, Seo J H, Cho BK, Tsai SF, Palsson BO. 2012. Comparative analysis of regulatory elements between Escherichia coli and Klebsiella pneumoniae by genome-wide transcription start site profiling. PLoS Genet 8:e1002867. doi: 10.1371/journal.pgen.1002867. [DOI] [PMC free article] [PubMed] [Google Scholar]
- 11.Cho BK, Kim D, Knight EM, Zengler K, Palsson BO. 2014. Genome-scale reconstruction of the sigma factor network in Escherichia coli: topology and functional states. BMC Biol 12:4. doi: 10.1186/1741-7007-12-4. [DOI] [PMC free article] [PubMed] [Google Scholar]
- 12.Cho BK, Zengler K, Qiu Y, Park YS, Knight EM, Barrett CL, Gao Y, Palsson BØ. 2009. The transcription unit architecture of the Escherichia coli genome. Nat Biotech 27:1043–1049. doi: 10.1038/nbt.1582. [DOI] [PMC free article] [PubMed] [Google Scholar]
- 13.Shinhara A, Matsui M, Hiraoka K, Nomura W, Hirano R, Nakahigashi K, Tomita M, Mori H, Kanai A. 2011. Deep sequencing reveals as-yet-undiscovered small RNAs in Escherichia coli. BMC Genomics 12:428. doi: 10.1186/1471-2164-12-428. [DOI] [PMC free article] [PubMed] [Google Scholar]
- 14.Dornenburg JE, Devita AM, Palumbo MJ, Wade JT. 2010. Widespread antisense transcription in Escherichia coli. mBio 1(1):e00024-10. doi: 10.1128/mBio.00024-10. [DOI] [PMC free article] [PubMed] [Google Scholar]
- 15.Li S, Dong X, Su Z. 2013. Directional RNA-seq reveals highly complex condition-dependent transcriptomes in E. coli K12 through accurate full-length transcripts assembling. BMC Genomics 14:520. doi: 10.1186/1471-2164-14-520. [DOI] [PMC free article] [PubMed] [Google Scholar]
- 16.Raghavan R, Sloan DB, Ochman H. 2012. Antisense transcription is pervasive but rarely conserved in enteric bacteria. mBio 3(4):e00156-12. doi: 10.1128/mBio.00156-12. [DOI] [PMC free article] [PubMed] [Google Scholar]
- 17.Peters JM, Mooney RA, Grass JA, Jessen ED, Tran F, Landick R. 2012. Rho and NusG suppress pervasive antisense transcription in Escherichia coli. Genes Dev 26:2621–2633. doi: 10.1101/gad.196741.112. [DOI] [PMC free article] [PubMed] [Google Scholar]
- 18.Peters JM, Mooney RA, Kuan PF, Rowland JL, Keles S, Landick R. 2009. Rho directs widespread termination of intragenic and stable RNA transcription. Proc Natl Acad Sci U S A 106:15406–15411. doi: 10.1073/pnas.0903846106. [DOI] [PMC free article] [PubMed] [Google Scholar]
- 19.Conway T, Creecy JP, Maddox SM, Grissom JE, Conkle TL, Shadid TM, Teramoto J, San Miguel P, Shimada T, Ishihama A, Mori H, Wanner BL. 2014. Unprecedented high-resolution view of bacterial operon architecture revealed by RNA sequencing. mBio 5(4):e01442-14. doi: 10.1128/mBio.01442-14. [DOI] [PMC free article] [PubMed] [Google Scholar]
- 20.Mendoza-Vargas A, Olvera L, Olvera M, Grande R, Vega-Alvarado L, Taboada B, Jimenez-Jacinto V, Salgado H, Juarez K, Contreras-Moreira B, Huerta AM, Collado-Vides J, Morett E. 2009. Genome-wide identification of transcription start sites, promoters and transcription factor binding sites in E. coli. PLoS One 4:e7526. doi: 10.1371/journal.pone.0007526. [DOI] [PMC free article] [PubMed] [Google Scholar]
- 21.Salgado H, Peralta-Gil M, Gama-Castro S, Santos-Zavaleta A, Muñiz-Rascado L, García-Sotelo JS, Weiss V, Solano-Lira H, Martínez-Flores I, Medina-Rivera A, Salgado-Osorio G, Alquicira-Hernández S, Alquicira-Hernández K, López-Fuentes A, Porrón-Sotelo L, Huerta AM, Bonavides-Martínez C, Balderas-Martínez YI, Pannier L, Olvera M, Labastida A, Jiménez-Jacinto V, Vega-Alvarado L, Del Moral-Chávez V, Hernández-Alvarez A, Morett E, Collado-Vides J. 2013. RegulonDB v8.0: omics data sets, evolutionary conservation, regulatory phrases, cross-validated gold standards and more. Nucleic Acids Res 41:D203–D213. doi: 10.1093/nar/gks1201. [DOI] [PMC free article] [PubMed] [Google Scholar]
- 22.Haas BJ, Chin M, Nusbaum C, Birren BW, Livny J. 2012. How deep is deep enough for RNA-Seq profiling of bacterial transcriptomes? BMC Genomics 13:734. doi: 10.1186/1471-2164-13-734. [DOI] [PMC free article] [PubMed] [Google Scholar]
- 23.Thomason MK, Storz G. 2010. Bacterial antisense RNAs: how many are there, and what are they doing? Annu Rev Genet 44:167–188. doi: 10.1146/annurev-genet-102209-163523. [DOI] [PMC free article] [PubMed] [Google Scholar]
- 24.Georg J, Hess WR. 2011. cis-antisense RNA, another level of gene regulation in bacteria. Microbiol Mol Biol Rev 75:286–300. doi: 10.1128/MMBR.00032-10. [DOI] [PMC free article] [PubMed] [Google Scholar]
- 25.Lasa I, Toledo-Arana A, Dobin A, Villanueva M, de los Mozos IR, Vergara-Irigaray M, Segura V, Fagegaltier D, Penades JR, Valle J, Solano C, Gingeras TR. 2011. Genome-wide antisense transcription drives mRNA processing in bacteria. Proc Natl Acad Sci U S A 108:20172–20177. doi: 10.1073/pnas.1113521108. [DOI] [PMC free article] [PubMed] [Google Scholar]
- 26.Sesto N, Wurtzel O, Archambaud C, Sorek R, Cossart P. 2013. The excludon: a new concept in bacterial antisense RNA-mediated gene regulation. Nat Rev Microbiol 11:75–82. doi: 10.1038/nrmicro2934. [DOI] [PubMed] [Google Scholar]
- 27.Lin Y, Alvarez J R, Guan S, Mamanova L, McDowall KJ. 2013. A combination of improved differential and global RNA-seq reveals pervasive transcription initiation and events in all stages of the life-cycle of functional RNAs in Propionibacterium acnes, a major contributor to wide-spread human disease. BMC Genomics 14:620. doi: 10.1186/1471-2164-14-620. [DOI] [PMC free article] [PubMed] [Google Scholar]
- 28.Passalacqua KD, Varadarajan A, Weist C, Ondov BD, Byrd B, Read TD, Bergman NH. 2012. Strand-specific RNA-seq reveals ordered patterns of sense and antisense transcription in Bacillus anthracis. PLoS One 7:e43350. doi: 10.1371/journal.pone.0043350. [DOI] [PMC free article] [PubMed] [Google Scholar]
- 29.Sharma CM, Vogel J. 2014. Differential RNA-seq: the approach behind and the biological insight gained. Curr Opin Microbiol 19:97–105. doi: 10.1016/j.mib.2014.06.010. [DOI] [PubMed] [Google Scholar]
- 30.Dugar G, Herbig A, Forstner KU, Heidrich N, Reinhardt R, Nieselt K, Sharma CM. 2013. High-resolution transcriptome maps reveal strain-specific regulatory features of multiple Campylobacter jejuni isolates. PLoS Genet 9:e1003495. doi: 10.1371/journal.pgen.1003495. [DOI] [PMC free article] [PubMed] [Google Scholar]
- 31.Yu D, Ellis HM, Lee EC, Jenkins NA, Copeland NG, Court DL. 2000. An efficient recombination system for chromosome engineering in Escherichia coli. Proc Natl Acad Sci U S A 97:5978–5983. doi: 10.1073/pnas.100127597. [DOI] [PMC free article] [PubMed] [Google Scholar]
- 32.Blomberg P, Wagner EGH, Nordström K. 1990. Control of replication of plasmid R1: the duplex between the antisense RNA, CopA, and its target, CopT, is processed specifically in vivo and in vitro by RNase III. EMBO J 9:2331–2340. [DOI] [PMC free article] [PubMed] [Google Scholar]
- 33.Förstner KU, Vogel J, Sharma CM. 13 August 2014. READemption—a tool for the computational analysis of deep-sequencing-based transcriptome data. Bioinformatics doi: 10.1093/bioinformatics/btu533. [DOI] [PubMed] [Google Scholar]
- 34.Hoffmann S, Otto C, Kurtz S, Sharma CM, Khaitovich P, Vogel J, Stadler PF, Hackermuller J. 2009. Fast mapping of short sequences with mismatches, insertions and deletions using index structures. PLoS Comput Biol 5:e1000502. doi: 10.1371/journal.pcbi.1000502. [DOI] [PMC free article] [PubMed] [Google Scholar]
- 35.Mao X, Ma Q, Zhou C, Chen X, Zhang H, Yang J, Mao F, Lai W, Xu Y. 2014. DOOR 2.0: presenting operons and their functions through dynamic and integrated views. Nucleic Acids Res 42:D654–D659. doi: 10.1093/nar/gkt1048. [DOI] [PMC free article] [PubMed] [Google Scholar]
- 36.Mortazavi A, Williams BA, McCue K, Schaeffer L, Wold B. 2008. Mapping and quantifying mammalian transcriptomes by RNA-Seq. Nat Methods 5:621–628. doi: 10.1038/nmeth.1226. [DOI] [PubMed] [Google Scholar]
- 37.Thomason MK, Fontaine F, De Lay N, Storz G. 2012. A small RNA that regulates motility and biofilm formation in response to changes in nutrient availability in Escherichia coli. Mol Microbiol 84:17–35. doi: 10.1111/j.1365-2958.2012.07965.x. [DOI] [PMC free article] [PubMed] [Google Scholar]
- 38.Battesti A, Majdalani N, Gottesman S. 2011. The RpoS-mediated general stress response in Escherichia coli. Annu Rev Microbiol 65:189–213. doi: 10.1146/annurev-micro-090110-102946. [DOI] [PMC free article] [PubMed] [Google Scholar]
- 39.Miller KW, Wu HC. 1987. Cotranscription of the Escherichia coli isoleucyl-tRNA synthetase (ileS) and prolipoprotein signal peptidase (lsp) genes. Fine-structure mapping of the lsp internal promoter. J Biol Chem 262:389–393. [PubMed] [Google Scholar]
- 40.Shao W, Price MN, Deutschbauer AM, Romine MF, Arkin AP. 2014. Conservation of transcription start sites within genes across a bacterial genus. mBio 5(4):e01398-14. doi: 10.1128/mBio.01398-14. [DOI] [PMC free article] [PubMed] [Google Scholar]
- 41.Guo MS, Updegrove TB, Gogol EB, Shabalina SA, Gross CA, Storz G. 2014. MicL, a new σE-dependent sRNA, combats envelope stress by repressing synthesis of Lpp, the major outer membrane lipoprotein. Genes Dev 28:1620–1634. doi: 10.1101/gad.243485.114. [DOI] [PMC free article] [PubMed] [Google Scholar]
- 42.Bendtsen KM, Erdossy J, Csiszovszki Z, Svenningsen SL, Sneppen K, Krishna S, Semsey S. 2011. Direct and indirect effects in the regulation of overlapping promoters. Nucleic Acids Res 39:6879–6885. doi: 10.1093/nar/gkr390. [DOI] [PMC free article] [PubMed] [Google Scholar]
- 43.Fozo EM, Hemm MR, Storz G. 2008. Small toxic proteins and the antisense RNAs that repress them. Microbiol Mol Biol. Rev 72:579–589. doi: 10.1128/MMBR.00025-08. [DOI] [PMC free article] [PubMed] [Google Scholar]
- 44.Andre G, Even S, Putzer H, Burguiere P, Croux C, Danchin A, Martin-Verstraete I, Soutourina O. 2008. S-box and T-box riboswitches and antisense RNA control a sulfur metabolic operon of Clostridium acetobutylicum. Nucleic Acids Res 36:5955–5969. doi: 10.1093/nar/gkn601. [DOI] [PMC free article] [PubMed] [Google Scholar]
- 45.Mellin JR, Tiensuu T, Becavin C, Gouin E, Johansson J, Cossart P. 2013. A riboswitch-regulated antisense RNA in Listeria monocytogenes. Proc Natl Acad Sci U S A 110:13132–13137. doi: 10.1073/pnas.1304795110. [DOI] [PMC free article] [PubMed] [Google Scholar]
- 46.Bailey TL, Elkan C. 1994. Fitting a mixture model by expectation maximization to discover motifs in biopolymers. Proc Int Conf Intell Syst Mol Biol 2:28–36. [PubMed] [Google Scholar]
- 47.Feklistov A, Sharon BD, Darst SA, Gross CA. 2014. Bacterial sigma factors: a historical, structural, and genomic perspective. Annu Rev Microbiol 68:357–376. doi: 10.1146/annurev-micro-092412-155737. [DOI] [PubMed] [Google Scholar]
- 48.Lybecker M, Zimmermann B, Bilusic I, Tukhtubaeva N, Schroeder R. 2014. The double-stranded transcriptome of Escherichia coli. Proc Natl Acad Sci U S A 111:3134–3139. doi: 10.1073/pnas.1315974111. [DOI] [PMC free article] [PubMed] [Google Scholar]
- 49.Massé E, Escorcia FE, Gottesman S. 2003. Coupled degradation of a small regulatory RNA and its mRNA targets in Escherichia coli. Genes Dev 17:2374–2383. doi: 10.1101/gad.1127103. [DOI] [PMC free article] [PubMed] [Google Scholar]
- 50.Kido M, Yamanaka K, Mitani T, Niki H, Ogura T, Hiraga S. 1996. RNase E polypeptides lacking a carboxyl-terminal half suppress a mukB mutation in Escherichia coli. J Bacteriol 178:3917–3925. [DOI] [PMC free article] [PubMed] [Google Scholar]
- 51.Opdyke JA, Fozo EM, Hemm MR, Storz G. 2011. RNase III participates in GadY-dependent cleavage of the gadX-gadW mRNA. J Mol Biol 406:29–43. doi: 10.1016/j.jmb.2010.12.009. [DOI] [PMC free article] [PubMed] [Google Scholar]
- 52.Amman F, Wolfinger MT, Lorenz R, Hofacker IL, Stadler PF, Findeiß S. 2014. TSSAR: TSS annotation regime for dRNA-seq data. BMC Bioinformatics 15:89. doi: 10.1186/1471-2105-15-89. [DOI] [PMC free article] [PubMed] [Google Scholar]
- 53.'t Hoen PA, Friedländer MR, Almlöf J, Sammeth M, Pulyakhina I, Anvar SY, Laros JF, Buermans HP, Karlberg O, Brännvall M, GEUVADIS Consortium, den Dunnen JT, van Ommen GJ, Gut IG, Guigó R, Estivill X, Syvänen AC, Dermitzakis ET, Lappalainen T. 2013. Reproducibility of high-throughput mRNA and small RNA sequencing across laboratories. Nat Biotechnol 31:1015–1022. doi: 10.1038/nbt.2702. [DOI] [PubMed] [Google Scholar]
- 54.Deana A, Celesnik H, Belasco JG. 2008. The bacterial enzyme RppH triggers messenger RNA degradation by 5′ pyrophosphate removal. Nature 451:355–358. doi: 10.1038/nature06475. [DOI] [PubMed] [Google Scholar]
- 55.Raabe CA, Tang TH, Brosius J, Rozhdestvensky TS. 2014. Biases in small RNA deep sequencing data. Nucleic Acids Res 42:1414–1426. doi: 10.1093/nar/gkt1021. [DOI] [PMC free article] [PubMed] [Google Scholar]
- 56.McClure R, Balasubramanian D, Sun Y, Bobrovskyy M, Sumby P, Genco CA, Vanderpool CK, Tjaden B. 2013. Computational analysis of bacterial RNA-Seq data. Nucleic Acids Res 41:e140. doi: 10.1093/nar/gkt444. [DOI] [PMC free article] [PubMed] [Google Scholar]
Associated Data
This section collects any data citations, data availability statements, or supplementary materials included in this article.