

Abstract
Mechanosensitive (MS) channels allow cells to sense and respond to environmental changes. In bacteria, these channels are believed to protect against an osmotic shock. The physiological function of these channels has been characterized primarily by a standardized assay, where aliquots of batch-cultured cells are rapidly pipetted into a hypotonic medium. Under this method, it has been inferred many types of MS channels (MscS homologs in Escherichia coli) demonstrate limited effectiveness against shock, typically rescuing less than 10% of the cells when expressed at native levels. We introduce a single-cell-based assay which allows us to control how fast the osmolarity changes, over time scales ranging from a fraction of a second to several minutes. We find that the protection provided by MS channels depends strongly on the rate of osmotic change, revealing that, under a slow enough osmotic drop, MscS homologs can lead to survival rates comparable to those found in wild-type strains. Further, after the osmotic downshift, we observe multiple death phenotypes, which are inconsistent with the prevailing paradigm of how cells lyse. Both of these findings require a reevaluation of our basic understanding of the physiology of MS channels.
INTRODUCTION
Mechanosensation is a ubiquitous phenomenon found across all domains of life. In bacteria, one of the manifestations of such processes is in the context of osmoprotection, where it has been proposed that the presence of mechanosensitive (MS) channels in the cell membrane allows these cells to survive immersion into hypotonic environments. These channels gate in response to an increase in membrane tension and prevent membrane rupture by mediating net flux of water and small molecules. The first bacterial mechanosensitive channels were discovered in 1987 (1), and in the intervening period several more channels have been discovered. For example, seven different types (MscL and 6 MscS homologs) have been demonstrated in Escherichia coli (2). More generally, the trend of having multiple MscS homologs seems to occur in many other bacterial species as well (3, 4). One of the puzzles left unresolved in the wake of the discovery of this mechanosensitive protein diversity is why there are so many distinct mechanosensitive channels and the nature of their significance for cell physiology. Perhaps cues can be taken from examining the cell's native environment, but at present, it is not known (at least to the authors) which environmental factors are crucial.
The physiology of MS channels has been studied extensively over the past 20 years. Specifically, until now, the in vivo function of these channels has been characterized mainly by “hypo-osmotic challenge” assays, where an aliquot from batch culture is suddenly diluted into a lower-osmolarity medium, typically by hand pipetting. The resulting survival fraction is inferred several hours after the shock by counting colonies of plated dilutions or monitoring the optical density from the resulting mixture. The comparison of the batch survival rate for various deletion mutant strains has made it possible to study the contribution of a particular channel to average cell survival. Based on the challenge assay, studies have demonstrated that cells which have several or all of their MscS homologs can survive osmotic shocks at levels comparable to those found for wild-type cells. For example, Bacillus subtilis shows less than a 10% difference in survival rates after deletion of all three of its MscS homologs (5). In E. coli, the native expression of just MscL or MscS is sufficient to provide survival rates of 80% or higher against a 0.5 M NaCl shock (6). On the other hand, the remaining five channels in E. coli, expressed at native levels in various combinations, can lead to survival rates of 5% to 10% (2, 6), calling into question the physiological significance of these channels. A summary of these results, including the error and presumed resolution, can be found in Table S1 in the supplemental material.
These assays, although very informative, reflect the population average. They cannot reveal individual cell behavior, e.g., if there is a variety of lytic responses among cells from a given population. Further, they do not have a well-controlled rate of change in the medium osmolarity. One exception is recent work that used the stopped-flow technique, where two media are injected into a chamber and then the flow is stopped, allowing for controlled rapid mixing of media (7). All these approaches are used to create a sudden change in osmolarity—a so-called “shock”—presumably on subsecond time scales. These conditions are on the extreme end of what bacteria may experience in their habitat. For example, when drinking water, one can imagine oral bacteria experience a true shock, whereas bacteria deeper in the intestinal tract would be exposed to osmotic changes comparable to the intestinal water movement rate, which can be several minutes (8, 9). Given the wide variation of time scales, it is not even clear how fast a downshift needs to be before it is considered a shock. Further, any physiological properties of channels which occur on the several-second time scale may not be detected by the standard downshock assay. For example, the inactivation of MscS channels in patch clamp measurements can be observed only when the pressure is applied gradually (7) over tens of seconds. Finally, there are studies that demonstrate that cell survival depends on the time scale over which the external water potential is changed (10–12). However, to our knowledge, no work has analyzed how the presence or absence of various MS channels impacts cell survival under time-dependent conditions.
To address these issues, we have developed a single-cell video microscopy approach in which bacteria that are in exponential growth phase (see Materials and Methods) are immobilized in a microfluidic flow cell and subjected to highly controlled osmotic shocks (Fig. 1A). Their resulting changes in morphology and growth are monitored for hours afterward. Using a more sensitive assay has allowed us to detect previously unappreciated subtle contributions to survival by various channels.
FIG 1.
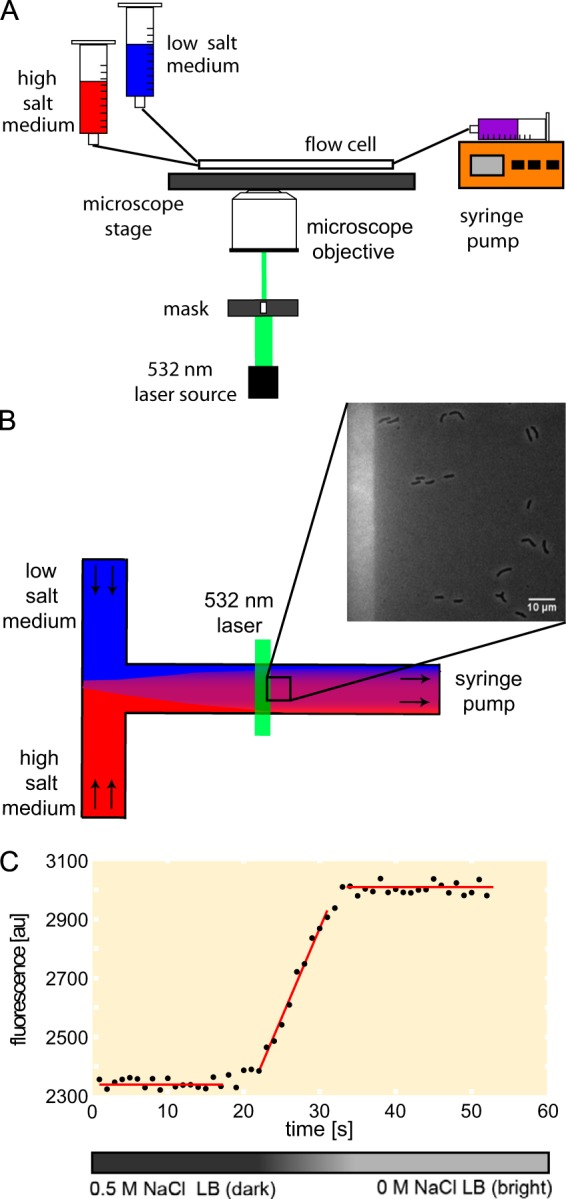
Overview of the experiment. (A) A schematic picture of the experimental setup. A flow cell is connected to reservoirs with high (0.5 M NaCl)- and low (0 M NaCl)-osmolarity media. Valves are used to select the medium to be loaded, and the speed of medium exchange is set by a syringe pump. (B) In situ fluorescence readout of the osmolarity as a function of time during the medium exchange. A calcium-sensitive dye (250 nM Rhod2) is added to both media. The viewing chamber medium is changed from 0.5 M NaCl LB with no added calcium (dark) to 0 M NaCl LB supplemented with 100 μM CaCl2 (bright). The edge of the field of view is illuminated by a laser beam used to excite fluorescence. (C) The osmotic exchange rate is calculated by fitting a straight line to three regions of the fluorescence signal: minimal fluorescence level, maximal fluorescence level, and the middle of the calibration curve.
MATERIALS AND METHODS
Strains, media, and growth conditions.
Strains MJF367, MJF451, MJF429, MJF465, MJF612, and MJF641 (see Table S1 in the supplemental material) were a generous gift from Ian Booth and Samantha Miller. Strain Frag1 was purchased from The Coli Genetic Stock Center (CGSC). As a base medium, L-Broth (MP Biomedicals; catalog no. 3001-032) supplemented with NaCl (Sigma; catalog no. S7653) to 5 g/liter was used. Strains were grown in the base medium supplemented with NaCl to 0.5 M above the base level of salt. Starter cultures were grown aerobically in 2 ml of 0.5 M L-Broth in the presence of the appropriate antibiotic (except the Frag1 strain) at 37°C overnight. The following morning, fresh media were inoculated at 1:500 and grown to an optical density at 600 nm (OD600) of 0.2 to 0.3. Aliquots of this culture were immediately loaded into the flow cell.
Flow cell.
The experiments were performed in a simple flow cell mounted on the microscope (Fig. 1A). The chamber was primed with a 1:400 dilution of polyethylenimine to attach cells to the bottom of the chamber (glass coverslip) and then washed with water. Two input ports were primed with the media of different osmolarities: one with a 0.5 M NaCl LB and the second one with a 0 M NaCl LB. Constant flow of medium through the experimental system was maintained by an attached syringe pump. Cells were loaded into a chamber at a constant speed of 100 μl/min through the input port primed with high-salt medium. Flow was stopped for ∼5 min to allow the cells to adhere. The excess of unattached cells was removed by flushing with high-salt medium and quickly passing a small (∼20-μl) air bubble through the chamber. The addition of the bubble leveled the cells into one viewing plane and did not affect cell survival rates. In the absence of a shock, the cells began growing, doubling every ∼30 min, comparable to a control sample of cells grown under an agarose pad (see Fig. S1 in the supplemental material). Over our observation period of 2 to 3 h, we found that unshocked cells typically divided 4 to 6 times in the flow chamber.
Imaging conditions.
The imaging was performed at 32°C with an inverted Nikon TI Eclipse microscope equipped with a Perfect Focus system and enclosed in a Hasion environmental chamber (∼1°C regulation accuracy). The microscope was outfitted with wide-field 532-nm laser excitation and a custom optical filter set (532/10 excitation, 605/55 emission). The number and condition of cells before the shock were imaged by phase-contrast microscopy at 20 different positions in a chamber. Next, the real-time medium exchange calibration (described below) was recorded using laser excitation fluorescence microscopy for one of the positions. To avoid laser excitation of the cells, the laser light was passed and imaged through a slit mask to allow illumination only at the edge of the field of view (Fig. 1B). For our typical operating conditions, we verified that the fluorescence, and thus the spatial variation of the osmolarity, was less than 5% over the entire field view, contributing a negligible error to the total error budget. The recovery of cells was recorded by taking a phase-contrast snapshot at every previously chosen position every minute for 2 to 3 h. In order to supply enough nutrients and oxygen to recovering cells, the medium was pumped throughout this period at a constant speed of 10 μl/min.
Real-time calibration.
In order to monitor the rate of the medium exchange, both high- and low-salt media were supplemented with a low-affinity version of the calcium-sensitive dye Rhod-2 (250 nM; TEF Labs 0244). The shock medium (0 M NaCl LB) was also supplemented with 100 μM CaCl2 to create a difference in the fluorescence signal between these two media. The fluorescence signal of the medium in the flow cell was recorded in real time during cell exposure to osmotic challenge. The rate of medium exchange was measured based on the signal intensity change as the high-salt medium (low signal) was substituted with the low-salt medium (high signal). The quantitative measurement of the rate exchange was performed by curve fitting to the recorded signal (fluorescence) to three straight-line regions (Fig. 1C). The minimum (0.5 M NaCl medium) and the maximum (0 M NaCl medium) signal values were calculated from the average of the corresponding points from their respective region. The difference between these two values was taken as the fluorescence signal change corresponding to a 0.5 M NaCl osmolarity drop. Next, a linear fit to the middle part of the trace was performed. The uncertainties in determining the slope and the intercept of the fitted curve were obtained from the fitting as well. The correlation coefficient R2 was kept higher than 0.95 (if the correlation coefficient of the linear fit was lower than 0.95, the fit to only part of the middle of the trace was performed). The rate was calculated by dividing the slope of the fitted curve by the value of the recorded signal. The uncertainty in the rate determination was calculated by error propagation. After the calibration, the shock medium (0 M NaCl LB) was substituted with a medium of the same osmolarity but without the dye and CaCl2.
Data analysis.
The fate of each individual cell was determined from the data collected during the recovery phase. A cell was counted as a survivor based on its division (see Fig. S2 in the supplemental material, cells marked with an arrow). The rest of the cells were classified as dead (see Fig. S2, cells marked with a star) or intact, nondividing cells (see Fig. S2, cells marked with a triangle). The dead cells were further divided into subclasses (described later). The percentage of the population which survived the shock was calculated as the ratio of the number of dividing cells to the total number of cells from 20 fields of view. The error in the calculated survival rate was taken as the fraction of intact, nondividing cells with respect to the total number of cells. The resolution of these experiments is about 5% to 10%, based on the day-to-day variation for identical conditions.
“Time of failure” fitting details.
The function abundance = a0 exp(−ν × t) equation was fitted to the histograms (see “Bacteria die over several minutes, implying cell wall failure” in Results), where t is time, ν is decay rate, and a0 is the initial abundance. We define t = 0 as the beginning of the movie showing cell recovery process. However, some of the cells are already dead at this point. They might have died during the medium exchange or during the time needed to move between the fields of views. In the analysis, these cells are treated as if they died at t = 0, even though they were dead earlier. To avoid the errors due to an inaccurate death time assignment for these cells, we decided to neglect the first bin.
RESULTS
Our method allows the control and quantitative measurement of the medium exchange rate, i.e., how fast the osmolarity changes during downshift. We monitor the instantaneous osmolarity with a fluorescence signal generated by an osmolyte-sensitive dye (Fig. 1B and C). The observation of single cells as a function of recovery time after the osmotic challenge allows the accurate determination of the fate of the individual cells (death or division), as well as the time interval between the osmotic challenge occurrence and cell death.
MS channels contribute to survival based on the medium exchange rate.
One of our principal findings is that the kinetics of medium exchange is an important factor in determining the survival probability of cells subjected to osmotic challenge, and it varies for different MS channel deletion mutants (see Table S1 for a summary of the mutants used in this work). Specifically, the percentage of cells surviving an osmotic shock depends on the rate of medium exchange as well as the genetic background (Fig. 2). To allow for comparison with previous studies, we fixed the magnitude of the osmotic drop to a change of 0.5 M NaCl. The strains Frag1 (wild type), MJF367 (ΔmscL), and MJF451 (ΔmscS) were used as positive controls and, as expected, survive at 90% or higher for the whole range of medium exchange rates tested (Fig. 2, dashed line). Strains MJF429 (ΔmscS ΔmscK), MJF465 (ΔmscL ΔmscS ΔmscK), and MJF612 (ΔmscL ΔmscS ΔmscK ΔybdG) show various levels of survival (0% to 90%) depending on the kinetics of medium exchange. The MJF641 strain, which has all seven mechanosensitive channels deleted, did not demonstrate significant survival rates (<1%), even at the slowest exchange rate tested (Fig. 2, orange circles), establishing the unprotected survival level for the MJF series strains (Frag1 background).
FIG 2.

Survival as a function of the rate of medium exchange. Strains Frag1 (wild type), MJF367 (ΔmscL), MJF451 (ΔmscS), MJF429 (ΔmscS ΔmscK), MJF465 (ΔmscL ΔmscS ΔmscK), MJF612 (ΔmscL ΔmscS ΔmscK ΔybdG), and MJF641 (with all seven mechanosensitive channels knocked out) were exposed to a 0.5 M NaCl shock performed at various rates of medium exchange. The survival depends on the rate of the osmotic challenge as well as on the type of MS channels present. The solid lines represent a fit to the initial linear region of the survival response curves. The dashed lines at 90% and 50% represent reference lines for wild-type-like survival and an arbitrary survival percentage used for strain comparison, respectively. The medium exchange rates where survival is ∼50% for the various strains are listed to the right to provide a gauge of rate sensitivity. For further details, see Materials and Methods.
Previously, the native expression of either MscL or MscS was reported to provide nearly complete protection from osmotic shock (6). The other types of channels were shown experimentally to provide protection from a full-scale 0.5 M shock only if overexpressed from a plasmid (2, 13). To our knowledge, our results are the first to demonstrate that the native expression of MscS homologs, namely, YbiO, YnaI, and YjeP together, can lead to survival rates comparable to those found in wild-type strains, provided the exchange rate is slow enough.
The mutant strains MJF429, MJF465, and MJF612 have similar rate dependence patterns. Their survival rates start over 90% and then decrease linearly with increasing osmotic exchange rate. In Fig. 2, these linear regions are marked by solid reference lines. The slope of the linear region progressively steepens as channels are deleted, indicating increasing sensitivity to the rate of osmotic medium exchange. The exchange rate where a given strain shows 50% survival (Fig. 2, dashed line) provides a convenient quantitative measure of how well the various channels protect on different time scales. For example, for exchange rates less than 0.16 s−1, the native expression of YbiO, YjeP, and YnaI (Fig. 2, MJF612, cyan diamonds) is sufficient to ensure survival rates greater than 50%. The addition of YbdG to the previous set of channels (Fig. 2, MJF465, green triangles) increases the exchange rate where there is 50% survival to 0.4 s−1. The comparison between the MJF429 (Fig. 2, squares) and MJF465 strains suggests that the presence of MscL channels protects 50 to 60% of the cells against exchange rates greater than 0.6 s−1, since the comparable strain without MscL (MJF465) demonstrates less than 10% survival over the same range. For exchange rates greater than 0.5 s−1, the MJF451 strain (Fig. 2, magenta diamonds) has survival rates that are 20% higher than the comparable strain without MscK (MJF429), which suggests that the presence of MscK channels is needed for true wild-type survival levels.
For comparison of our results with previously published work that used the traditional hypo-osmotic shock assay, see Table S1 in the supplemental material. Our data roughly agree with the previous reports at the highest exchange rates (>0.6 s−1), which we take to be the shock limit. Generally, our survival rates in the shock limit are 5% to 15% lower than those shown in Table S1. This may be due to differences between the two assays: the way cells are handled, the normalization, culturing, etc. However, we note that when we perform the traditional hypo-osmotic challenge assay on these same strains, in our hands, we observe intrinsic variation as high as 20% (see Fig. S3 in the supplemental material).
Bacteria do not just “pop” during shock.
Direct observation allowed us to systematically study various changes in cell morphology and behavior leading to cell death (Fig. 3). The cells were classified in our assay as dead when they failed to fully divide during our observation time (2 to 3 h) and showed one of the following death phenotypes. The most commonly observed phenotype was the formation of a membrane bleb (Fig. 3A), which we call blebbing. We hypothesize that these blebs form because of ruptures in the peptidoglycan layer, based on the resemblance of these cells to those treated with antibiotics that cause defects in the peptidoglycan structure (14). After formation, a bleb typically pops, thus completely lysing the cell, leading to a rapid loss of phase contrast. Another similar, but rarer, phenotype is where cells show a fast step-like change in phase contrast (Fig. 3B; see also Fig. S4 in the supplemental material), but there are no observed blebs or cell envelope changes. We call this phenotype bursting. The second most common phenotype was a slow loss of phase contrast without clear signs of cell envelope disruption (Fig. 3C; see also Fig. S4), which we call fading. The fading was interpreted as a loss of the cytoplasmic content, and we hypothesize it may be caused by a slow leak of the small molecules. The final phenotype we observe is where the cell develops a rupture or extrusion of the envelope after the shock (Fig. 3D; see Fig. S5 in the supplemental material) and there is no clear bleb formation, which we call rupture. This type of cell death was hypothesized as a localized loss of cell envelope integrity. The phase-contrast loss for this phenotype can occur over a wide range of time scales, possibly reflecting a distribution of hole sizes in the cell envelope. The relative occurrences of these phenotypes may show some trends with medium exchange rates (Fig. 4). For MJF465, the blebbing phenotype decreases, whereas the exploder phenotype increases, with increasing medium exchange rate. For MJF612, if the data point for rate 0.03 s−1 is ignored, the blebbing phenotype increases, whereas fading phenotype decreases, with increasing rate of medium exchange. In all cases, the blebbing phenotype is the most prevalent, and the rupture phenotype is the rarest. Given the nonquantitative nature of the classification criteria and the possibility of misclassification, these trends should be taken as provisional and not having much statistical significance.
FIG 3.
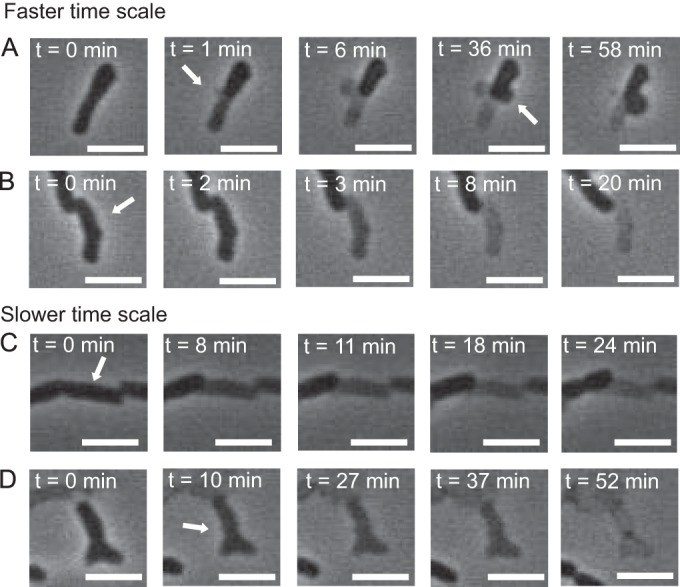
Image sequences showing representative time courses of death after exposure to osmotic challenge. The scale bar is 2 μm. For movies showing these morphological changes of the cells, see Videos S1 to S4 in the supplemental material. (A) Bleb formation. Arrows indicate the region of the cell where the blebs (hemispherical bulges of the plasma membrane) were formed. (B) Bursting cell. The phase contrast changes suddenly (between t = 2 and t = 3 min), which we interpret as a fast cytoplasmic content release followed by a slow leakage of the remaining content. The arrow indicates the cell of interest. (C) Cell slowly (over 20 min) losing phase contrast, which is interpreted as releasing its content (“fading”) without a clear sign of envelope damage. Arrow indicates the cell of interest. (D) Morphological change interpreted as a membrane rupture without formation of a bleb. The arrow indicates the location of an irregularly shaped, small element, which we interpret as a fragment of a plasma membrane.
FIG 4.

The percentage of cells showing a given morphology change as a function of the rate of medium exchange for three strains: MJF465 (ΔmscL ΔmscS ΔmscK), MJF612 (ΔmscL ΔmscS ΔmscK ΔybdG), and MJF641 (with all seven mechanosensitive channels deleted). In all cases, the death mechanism does not appear to be significantly correlated with the rate of the osmotic challenge.
Bacteria die over several minutes, implying cell wall failure.
Interestingly, we find that in most cases, cells do not die due to an instantaneous cell envelope rupture occurring during the osmotic challenge. In our assay, the majority of cells “fail” long after the osmotic challenge took place, about 10 to 20 min later. Based on image analysis, the criteria for determining exactly when the cells structurally fail after the osmotic downshift are unclear. In some cases, the failure process appears to be continuous (e.g., the fading away of cells). However, in the case of bursting or blebbing cells, we can determine the time when a sudden change (less than one video frame) occurs, e.g., when the phase contrast drops or the bleb first appears. We define the moment of this event as the “time of failure.” It can be taken as a rough, if somewhat arbitrary, indicator of when the cell starts to lose its integrity. Such an analysis was performed for blebbing cells of strain MJF465. The histograms of the number of blebbing cells versus their time of failure were constructed for samples shocked at various downshift rates (see Fig. 5A to C for representative histograms).
FIG 5.

Distribution of failure times of MJF465 for different medium exchange rates: 0.35 s−1 (A), 0.62 s−1 (B), and 1 s−1 (C). An exponential decay function (abundance of ∼a0e−νt) was fit to the histograms, where the first bin was neglected (see Materials and Methods for details). (D) The failure rate ν versus the medium exchange rate.
As discussed earlier, the rate of medium exchange does not seem to influence the mechanism by which the cells die. However, we observe that the downshift rate does influence the time interval between the osmotic challenge and bleb failure. To quantify this dependence, we fit the histograms to a decaying exponential function (Fig. 5A to C), where the fitted exponential decay rate ν can be taken as the failure rate of blebbing cells. Interestingly, the failure rate monotonically increases with the rate of the shock, consistent with a linear dependence (Fig. 5D).
DISCUSSION
Prior to this work, the survival rates of cells after osmotic downshift had been studied only after exposure to a step-like change in the medium osmolarity. Our results examine the behavior of MS channels over a broader range of time scales and reveal the rate-dependent nature of osmoprotection. There are results, prior to the discovery of MS channels, which hint at rate dependence, where it was reported that the amount of the osmolytes released, post-osmotic shock, depended on the rate of shock (15–17); however, none of these studies directly looked at survival rates. As determined by the challenge assay, the effectiveness of some MS channels (YbdG and the set of YbiO, YnaI, and YjeP) may have been underappreciated, since they had been evaluated in one extreme limit of osmotic change. We find these channels can be quite effective, leading to survival rates exceeding 50% and approaching 90%, when examined on the appropriate time scale. MscS homologs were previously described as having “threshold” behavior, where they provided high protection against modest magnitude shocks, typically 4- or 5-fold less than a drop of 0.5 M NaCl (13). In contrast, we find it is not the magnitude of the shock but the rate of osmotic exchange that is the actual determining factor for how well the channels protect. There is no threshold for each type of channel per se. Instead, we propose that the cell's sensitivity to downshift, i.e., the slope of survival versus shock rate in Fig. 2, is a more revealing and sensitive measure of how much a given type of channel contributes to osmoprotection. For example, using the slope as a figure of merit, our results showed that the presence of YbdG in the MJF465 strain reduced its sensitivity to osmotic shock by more than a factor of 2 over the comparable strain lacking YbdG (MJF612).
Channels like MscL and MscS in E. coli, solely by themselves, are expected to provide high protection at all rates. However, even these channels may be aided by the presence of MscS homologs, as appears to be the case for a strain with MscL and MscK present (MJF451) versus a strain with MscL and no MscK present (MJF429), under our conditions. Perhaps the most relevant test is to examine how much the individual homologs contribute with both MscS and MscL present, which is closer to the true wild-type condition. This can be inferred from shocking single-channel deletion strains, where just a single MscS homolog is deleted. We have done this using our flow cell technique and find that the survival rates of the various single deletion strains are 90% or higher (see Fig. S6 in the supplemental material), placing an upper bound on the contribution from all the homologs at less than 10%, roughly at the resolution of our experiment. While this may not seem like much of a contribution, it is possible that even a small percent enhancement in survival rate is sufficient evolutionary incentive for these channels to evolve. Also, there may be more subtle differences associated with the homologs other than changes in survival rate, such as the length of the lag phase or other phenotypic responses to various different environmental conditions (18). These are topics for future studies.
The mechanisms responsible for the observed rate dependence are not entirely clear. It is possible that for the slower time scales, the cell could adapt to the shock by inserting membrane proteins or exchanging lipids (19), since these things can occur over a several-second time scale. It is, however, perhaps more tractable to first explore theoretically how physical processes may contribute to the rate dependence, such as the time it takes to transport water through activated channels (20) and how long it takes for the membrane to relax its tension. Simple biophysical models based on these processes have been proposed (21) or are in development. A more complete picture should consider each channel's critical properties, such as conductance, abundance (22, 23) (see Table S2 in the supplemental material), and gating tension, in order to understand the origin of rate dependence and the interplay of the various channels.
The paradigmatic explanation of how cells die during an osmotic downshift is that cells lyse due to the sudden rupture of all three layers of cell envelope (24). It is only recently that alternative types of death phenotypes have been observed. Similar to our findings, Reuter et al. (25) observed there are various classes or phenotypes of cells after osmotic shock, with cells that lyse immediately and cells that slowly fade away. They draw similar conclusions that many of the cells have damaged cell walls, as opposed to being completely lysed, and are able to stay intact for several minutes after the shock before the cell wall loses integrity and fails. A key finding of our work is that the time of failure is exponentially distributed and depends on the rate of osmotic shock, which has implications about material damage. Consider the case of blebbing cells, which represent roughly half of the cells that die. If we ignore any kind of biological response from the cell, we can make a first approximation of the bacteria, or parts of it, as purely a material object. For example, a simple model of the cell membrane is that of a lipid bilayer vesicle. The rupture tension and defect rate of synthetic lipid bilayer vesicles have been demonstrated to increase with the rate of membrane tension increase, the so-called loading rate (26). To explain the multiminute delays (Fig. 5A to C) between the osmotic challenge and ensuing membrane failure, we hypothesize the downshift introduces fracture-like damage to the cell wall (most likely the peptidoglycan layer). The membrane remains intact during the downshift. Over the course of cellular growth, the damage to the cell wall might cause larger-scale integrity failure, leading to the deleterious formation of membrane blebs. Cast in the language of material science, we can view our osmotic shock and the ensuing lysis results as a demonstration of a material failure rate versus loading rate (and magnitude). The increasing dependence of failure rate versus medium exchange (loading) rate shown in Fig. 5D lends credence to this view, as it is a typical response of a material (27). An upper bound of the loading rate can be estimated from the effective osmotic pressure difference between the two exchanged media divided by the timescale of the drop. The true osmotic pressure difference and associated tension will likely be less than this estimate due to the transport rate of water and osmolytes through channels activated during the osmotic downshift. Thus, the actual loading rate experienced by the cell envelope will most likely depend on the combination of channels present. A possible explanation for the hierarchy of responses we see in Fig. 2 is that as various types of channels are added to a cell, they progressively mitigate the loading rate during osmotic downshift by relieving more of the driving pressure difference, which in turn leads to a lower failure rate and improved survival.
The observation of previously unnoticed various morphology changes leading to cell death suggests that the exposure to an osmotic shock may damage various parts of the cell envelope. The damage of various parts of the cell envelope has been previously reported due to efflux (28), pressure treatment (29), and dehydration-rehydration (30). To address the possible damage modes in greater detail, there needs to be a better understanding of the mechanical properties of all layers of the cell envelope. However, the measured values of the basic parameters vary substantially (31). This motivates further studies on the role of cell envelope in the protection from the osmotic challenge.
Supplementary Material
ACKNOWLEDGMENTS
We thank Ian Booth, Doug Rees, Bill Klug, Pierre Sens, and Liz Haswell for many helpful comments and discussions, and Samantha Miller, Susan Black, and the CGSC at Yale University for valuable materials.
R.P., M.B.-F., and H.J.L. were supported by NIH grant R01 GM084211 and National Institutes of Health Director's Pioneer Award grant DP1 OD000217. M.B.-F. was supported by a Caltech Provost's office fellowship.
Footnotes
Supplemental material for this article may be found at http://dx.doi.org/10.1128/JB.02175-14.
REFERENCES
- 1.Martinac B, Buechner M, Delcour AH, Adler J, Kung C. 1987. Pressure-sensitive ion channel in Escherichia coli. Proc Natl Acad Sci U S A 84:2297–2301. doi: 10.1073/pnas.84.8.2297. [DOI] [PMC free article] [PubMed] [Google Scholar]
- 2.Edwards MD, Black S, Rasmussen T, Rasmussen A, Stokes NR, Stephen TL, Miller S, Booth IR. 2012. Characterization of three novel mechanosensitive channel activities in Escherichia coli. Channels 6:272–281. doi: 10.4161/chan.20998. [DOI] [PMC free article] [PubMed] [Google Scholar]
- 3.Pivetti CD, Yen MR, Miller S, Busch W, Tseng YH, Booth IR, Saier MH Jr. 2003. Two families of mechanosensitive channel proteins. Microbiol Mol Biol Rev 67:66–85. doi: 10.1128/MMBR.67.1.66-85.2003. [DOI] [PMC free article] [PubMed] [Google Scholar]
- 4.Haswell ES, Phillips R, Rees DC. 2011. Mechanosensitive channels: what can they do and how do they do it? Structure 19:1356–1369. doi: 10.1016/j.str.2011.09.005. [DOI] [PMC free article] [PubMed] [Google Scholar]
- 5.Hoffmann T, Boiangiu C, Moses S, Bremer E. 2008. Responses of Bacillus subtilis to hypotonic challenges: physiological contributions of mechanosensitive channels to cellular survival. Appl Environ Microbiol 74:2454–2460. doi: 10.1128/AEM.01573-07. [DOI] [PMC free article] [PubMed] [Google Scholar]
- 6.Levina N, Totemeyer S, Stokes NR, Louis P, Jones MA, Booth IR. 1999. Protection of Escherichia coli cells against extreme turgor by activation of MscS and MscL mechanosensitive channels: identification of genes required for MscS activity. EMBO J 18:1730–1737. doi: 10.1093/emboj/18.7.1730. [DOI] [PMC free article] [PubMed] [Google Scholar]
- 7.Boer M, Anishkin A, Sukharev S. 2011. Adaptive MscS gating in the osmotic permeability response in E. coli: the question of time. Biochemistry 50:4087–4096. doi: 10.1021/bi1019435. [DOI] [PMC free article] [PubMed] [Google Scholar]
- 8.Ireland P, Fordtran JS. 1973. Effect of dietary calcium and age on jejunal calcium absorption in humans studied by intestinal perfusion. J Clin Invest 52:2672–2681. doi: 10.1172/JCI107461. [DOI] [PMC free article] [PubMed] [Google Scholar]
- 9.Wiseman G. 1964. Absorption from the intestine. Academic Press, London, United Kingdom. [Google Scholar]
- 10.Poirier I, Marechal PA, Gervais P. 1997. Effects of the kinetics of water potential variation on bacteria viability. J Appl Microbiol 82:101–106. doi: 10.1111/j.1365-2672.1997.tb03303.x. [DOI] [PubMed] [Google Scholar]
- 11.Poirier I, Marechal PA, Evrard C, Gervais P. 1998. Escherichia coli and Lactobacillus plantarum responses to osmotic stress. Appl Microbiol Biotechnol 50:704–709. doi: 10.1007/s002530051354. [DOI] [PubMed] [Google Scholar]
- 12.Mille Y, Beney L, Gervais P. 2003. Magnitude and kinetics of rehydration influence the viability of dehydrated E. coli K-12. Biotechnol Bioeng 83:578–582. doi: 10.1002/bit.10706. [DOI] [PubMed] [Google Scholar]
- 13.Schumann U, Edwards MD, Rasmussen T, Bartlett W, van West P, Booth IR. 2010. YbdG in Escherichia coli is a threshold-setting mechanosensitive channel with MscM activity. Proc Natl Acad Sci U S A 107:12664–12669. doi: 10.1073/pnas.1001405107. [DOI] [PMC free article] [PubMed] [Google Scholar]
- 14.Huang KC, Mukhopadhyay R, Wen B, Gitai Z, Wingreen NS. 2008. Cell shape and cell-wall organization in Gram-negative bacteria. Proc Natl Acad Sci U S A 105:19282–19287. doi: 10.1073/pnas.0805309105. [DOI] [PMC free article] [PubMed] [Google Scholar]
- 15.Britten RJ, McClure FT. 1962. The amino acid pool in Escherichia coli. Bacteriol Rev 26:292–335. [DOI] [PMC free article] [PubMed] [Google Scholar]
- 16.Tsapis A, Kepes A. 1977. Transient breakdown of the permeability barrier of the membrane of Escherichia coli upon hypoosmotic shock. Biochim Biophys Acta 469:1–12. doi: 10.1016/0005-2736(77)90320-0. [DOI] [PubMed] [Google Scholar]
- 17.Meury J, Robin A, Monnier-Champeix P. 1985. Turgor-controlled K+ fluxes and their pathways in Escherichia coli. Eur J Biochem 151:613–619. doi: 10.1111/j.1432-1033.1985.tb09148.x. [DOI] [PubMed] [Google Scholar]
- 18.Nichols RJ, Sen S, Choo YJ, Beltrao P, Zietek M, Chaba R, Lee S, Kazmierczak KM, Lee KJ, Wong A, Shales M, Lovett S, Winkler ME, Krogan NJ, Typas A, Gross CA. 2011. Phenotypic landscape of a bacterial cell. Cell 144:143–156. doi: 10.1016/j.cell.2010.11.052. [DOI] [PMC free article] [PubMed] [Google Scholar]
- 19.Katz D, Rosenberger RF. 1971. Hyphal wall synthesis in Aspergillus nidulans: effect of protein synthesis inhibition and osmotic shock on chitin insertion and morphogenesis. J Bacteriol 108:184–190. [DOI] [PMC free article] [PubMed] [Google Scholar]
- 20.Louhivuori M, Risselada HJ, van der Giessen E, Marrink SJ. 2010. Release of content through mechano-sensitive gates in pressurized liposomes. Proc Natl Acad Sci U S A 107:19856–19860. doi: 10.1073/pnas.1001316107. [DOI] [PMC free article] [PubMed] [Google Scholar]
- 21.Ursell T. 2009. Bilayer elasticity in protein and lipid organization: theory and experiments in model systems. VDM Verlag, Saarbrücken, Germany. [Google Scholar]
- 22.Bialecka-Fornal M, Lee HJ, DeBerg HA, Gandhi CS, Phillips R. 2012. Single-cell census of mechanosensitive channels in living bacteria. PLoS One 7:e33077. doi: 10.1371/journal.pone.0033077. [DOI] [PMC free article] [PubMed] [Google Scholar]
- 23.Li GW, Burkhardt D, Gross C, Weissman JS. 2014. Quantifying absolute protein synthesis rates reveals principles underlying allocation of cellular resources. Cell 157:624–635. doi: 10.1016/j.cell.2014.02.033. [DOI] [PMC free article] [PubMed] [Google Scholar]
- 24.Perozo E, Rees DC. 2003. Structure and mechanism in prokaryotic mechanosensitive channels. Curr Opin Struct Biol 13:432–442. doi: 10.1016/S0959-440X(03)00106-4. [DOI] [PubMed] [Google Scholar]
- 25.Reuter M, Hayward NJ, Black SS, Miller S, Dryden DT, Booth IR. 2014. Mechanosensitive channels and bacterial cell wall integrity: does life end with a bang or a whimper? J R Soc Interface 11:20130850. doi: 10.1098/rsif.2013.0850. [DOI] [PMC free article] [PubMed] [Google Scholar]
- 26.Evans E, Heinrich V, Ludwig F, Rawicz W. 2003. Dynamic tension spectroscopy and strength of biomembranes. Biophys J 85:2342–2350. doi: 10.1016/S0006-3495(03)74658-X. [DOI] [PMC free article] [PubMed] [Google Scholar]
- 27.Freund LB. 1990. Dynamic fracture mechanics. Cambridge University Press, Cambridge, United Kingdom. [Google Scholar]
- 28.Guggino S, Gutknecht J. 1982. Turgor regulation in Valonia macrophysa following acute osmotic shock. J Membrane Biol 67:155–164. doi: 10.1007/BF01868658. [DOI] [Google Scholar]
- 29.Pagan R, Mackey B. 2000. Relationship between membrane damage and cell death in pressure-treated Escherichia coli cells: differences between exponential- and stationary-phase cells and variation among strains. Appl Environ Microbiol 66:2829–2834. doi: 10.1128/AEM.66.7.2829-2834.2000. [DOI] [PMC free article] [PubMed] [Google Scholar]
- 30.Simonin H, Beney L, Gervais P. 2007. Sequence of occurring damages in yeast plasma membrane during dehydration and rehydration: mechanisms of cell death. Biochim Biophys Acta 1768:1600–1610. doi: 10.1016/j.bbamem.2007.03.017. [DOI] [PubMed] [Google Scholar]
- 31.Tuson HH, Auer GK, Renner LD, Hasebe M, Tropini C, Salick M, Crone WC, Gopinathan A, Huang KC, Weibel DB. 2012. Measuring the stiffness of bacterial cells from growth rates in hydrogels of tunable elasticity. Mol Microbiol 84:874–891. doi: 10.1111/j.1365-2958.2012.08063.x. [DOI] [PMC free article] [PubMed] [Google Scholar]
Associated Data
This section collects any data citations, data availability statements, or supplementary materials included in this article.