Abstract
Here we report the synthesis, characterization and application of a multifunctional surface functionalized GdF3:Nd3+ nanophosphor that exhibits efficient near infrared (NIR) fluorescence as well as magnetic properties, which can be utilized for bimodal imaging in medical applications. The nanoparticles are small with an average size of 5 nm and form stable colloids that last for several weeks without settling, enabling the use for several biomedical and photonic applications. Their excellent NIR properties, such as nearly 11 % quantum yield of the 1064 nm emission, make them ideal contrast agents and biomarkers for in vitro and in vivo NIR optical bioimaging. The nanophosphors which were coated with poly(maleic anhydride- alt-1-octadicene) (PMAO) were implemented in cellular imaging and show no significant cellular toxicity for concentrations up to 200 μg ml−1. Furthermore, the incorporation of Gd into the nanocrystalline structure supplies exceptional magnetic properties, making them ideal for use as magnetic resonance imaging (MRI) contrast agents. The utility of these NIR emitting nanoparticles in infrared bioimaging and as contrast agent in magnetic resonance imaging was demonstrated by confocal imaging, magnetic resonance and tissue experiments.
Introduction
Medical imaging is a rapidly developing field where, in the last few years, there have been various improvements in current imaging techniques.1-4 Depending on the imaging location and details required, a vast range of imaging modalities may be used by physicians, including: (1) X-ray based methods, such as conventional X-ray, computed tomography (CT), (2) molecular imaging methods such as those used in nuclear medicine where radioactive markers, called radiopharmaceuticals, provide the contrast, (3) magnetic resonance imaging (MRI), (4) and ultrasound imaging.2 Many of the current imaging techniques have their own advantages and disadvantages. For example both X-ray and CT scan require ionizing radiation which is harmful to human body. Unlike conventional X-ray, CT, and Molecular Imaging, MRI and ultrasound operate without ionizing radiation, and therefore place the patient at a substantially lower risk for adverse effects due to the imaging. Similarly, MRI uses strong magnetic fields, which produce no known irreversible biological effects in humans.2,4 Diagnostic ultrasound systems use high-frequency sound waves to produce images of soft tissue and internal body organs but lack the contrast and detail of other imaging modalities. Also, both MRI and CT scans require a contrast agent to improve the image quality, and many of those used can exhibit some type of toxic effects in the human body.5
Currently, fluorescent dyes and quantum dots (QDs) have become widely utilized and versatile tools as optical imaging probes and markers in the medical industry. 6-8 In biological imaging and photodynamic therapy, light is targeted to a specific tissue location either directly or indirectly. In the case of direct light based imaging and therapy, high energy photons in the X-Ray, gamma ray, etc. regions may produce harmful effects to the biological tissue whereas modalities which use lower-energy wavelengths are much more desirable. The indirect method based on infrared (IR) light offers several advantages such as low energy IR excitation, low scattering and absorption by tissues, local delivery, and low tissue damage.9-11 One of the most common imaging technologies is based on organic fluorophores and QDs. 6-8,12-14 Short lived radioactive isotope labeling is also used in research as well as human diagnostics and treatment.15 However, there are significant shortcomings with these current imaging agents: viz. photobleaching in organic dyes and luminescence blinking in QDs, toxicity of QDs and radioactive materials, autofluorescence with UV excited dyes and QDs, low information density, and overall the high technology cost.14,16-19
Essentially, all of these limitations can be eliminated with IR based trivalent rare earth (RE) ions doped nanophosphor technology.9,20-24 Some of the advantages of RE doped nanophosphors are: (1) high signal to noise ratio: because of the biological transparent window in the 800-1200 nm region, soft tissues do not strongly absorb or scatter, thereby making the upconversion technology an excellent tool for background free images with high signal to noise ratio, (2) high penetration depth: because of this low scattering and absorption of NIR radiation in tissues, images can be obtained through greater thicknesses of tissue, therefore making in vivo imaging possible, (3) high resolution and information density; the sharpness and tunable emission allows for high information density and resolution as low as 10 nm, (4) low toxicity; compared to QD, many of the RE phosphors are less toxic as revealed from their toxicity studies. 9,21-26 For example, the LD50 for RE oxides is on the order of 1000 mg kg−1, while the LD50 value for selenium based QDs are on the order of 1 mg kg−1 (5) low cost technology: in RE phosphors since the color tunability is achieved by the dopant compositions, size tunability is not needed as in QD, which makes this technology cheaper, and (6) RE phosphors can also be imaged in scanning electron microscopy (SEM) due to their cathodoluminescence properties, so that it is possible to do both multiphoton imaging of nanophosphors in biological samples and ultra-high resolution SEM.27,28 Another obvious advantage of RE phosphor is their photo stability under external conditions and their emission intensities remain stable for years.
Optical imaging allows for high resolution of very small localized cells, even single cells, and provides clear visualization of the cells in relationship to their surrounding tissues. Because cells are able to internalize RE phosphors, it would even be possible for in vivo tracking. On the other hand, non-optical imaging, such as MRI can be used to image deeper in tissue that is not currently possible with optical imaging.9,21,28 It too can resolve down to the single cell level. Therefore, an ideal biomarker can be used for both forms of imaging simultaneously. Recently, Eu and Yb, Er doped GdVO4 luminomagnetic nanoparticles were studied as a candidate for biomedical imaging under UV excitation. 29-31 Similarly, rare earth doped NaGdF4 has been suggested as a potential bimodal imaging phosphor by several researchers.3,9,32-36 Fan Zhang et al. also proposed the idea of Fe3O4/SiO2/α-NaYF4: Yb,Er mesoporous core-shell nanorattles as a possible material.36
This paper discusses the synthesis, magnetic and optical properties, and multimodal imaging studies of Nd3+ doped GdF3 luminomagnetic nanophosphors. Bimodal imaging with these nanoparticles is achieved by the strong NIR fluorescence properties of the rare earth dopant Nd3+ as well as the magnetic properties of the Gd3+ in the nanocrystalline host. Most magnetic contrast agents currently used in clinical medicine consist of Gd3+-based organic chelates that are administered orally or intravenously and excreted mainly through the kidneys. Because of its toxicity, lone hydrated Gd3+ ions are separated by chelation to reduce potential toxic effects.28 However, even for Gd based chelates, the metal ions may be released during metabolic process, and the subsequent toxicity can lead to serious health issues.4 These issues can be circumvented by using Gd-based nanophosphors where the Gd ions are firmly attached to the rigid crystalline matrix. To the best of our knowledge, this is the first study reporting the synthesis and biomedical imaging applications of fully monodispersed water-soluble GdF3:Nd3+ nanophosphors with bifunctional imaging features.
Materials and Methods
2.1 Synthesis of GdF3:Nd3+
The nanocrystals GdF3:Nd3+ was synthesized the thermal decomposition (TD) method, where all the precursor chemicals used were purchased from GFS Chemicals, Powell, OH except the Gd (TFA) and Nd (TFA) which were produced in house described by Rhode et al. 37 For the thermal decomposition method of GdF3:Nd3+, stoichiometry amounts of neodymium trifluoroacetate (Nd (CF3COO)) and gadolinium trifluoroacetate ((Gd (CF3COO)) were dissolved in 20 mL of oleylamine. The solution was then heated rapidly to 340°C for 2 hours in a 3-kneck flask under a nitrogen atmosphere. After the precipitation of the nanoparticles is completed, the resulting mixture is then cooled down and washed 4-6 times with ethanol. Finally, the particles were freeze dried in a Virtis Freeze mobile 25EL for 15 hours to obtain the powder.
2.2 Morphology of GdF3:Nd3+
2.2.1 XRD and TEM Characterization
The X-ray powder diffraction (XRD) measurements were done using the RIGAKU Ultima IV X-ray diffractometer with Cu Kα (γ = 1.5 A) to determine the phase and structure of the particles [SI-1]. The morphology of the GdF3 doped with Nd3+ nanoparticles were characterized by using transmission electron microscope (TEM) and high resolution transmission electron microscopy (HRTEM 2010F) operated at 200 kV. The Scanning Transmission Electron Microscope (STEM) images were recorded in probe Cs-corrected JEOL JEM-ARM 200F operated at 200 kV. High Angular Annular Dark Field STEM images were obtained with a convergence angle of 26 mrad and the collection semi-angles from 50 to 180 mrad. These variations in semi-angles satisfy the conditions set forth for the detectors to eliminate contributions from unscattered and low-angle scattered electron beams. The probe size used was about 0.09 nm with the probe current of 22 pA. In addition, bright field (BF) STEM images were recorded by using a collection semi-angle of 11 mrad. Electron dispersive x-ray (EDX) spectrum was obtained using a probe size of 0.13 nm with the probe current 86 pA.
2.2.2 DLS Characterization
Dynamic Light Scattering (DLS) measurements were done using the Zetasizer Nano ZS (Malvern Instruments) with a 4mW He-Ne laser (632 nm). All data was obtained at 12.8° and 175° measurement angles and averaged over 12 scans.
2.3 Spectroscopy Characterization of GdF3:Nd3+
2.3.1 Fluorescence Characterization
Fluorescence characterization of the synthesized nanocrystals were done by using the near infrared (NIR) 808 nm power tunable fiber coupled Fabry Perot laser diode (Thorlab, Model LM14S2) and the emission of the sample was taken by the QuantaMaster 51 spectrofluorimeter from Photon Technology International Inc. (PTI) with a InGAS detector using the appropriate settings.
2.3.2 Lifetime Characterization
The photoluminescence decay curves were measured on a QuantaMaster 40 system from Photon Technology International Inc. (PTI) using the Single Shot Transient Digitizer technique with a Nitrogen Dye Laser (PTI part GL-3300 + GL-302) excitation source. The Nitrogen laser has an 800 ps pulse width that pumps a high resolution dye chamber to give 514±0.04 nm light. The collected decay curve was analyzed using built in software provided by PTI.
2.3.3 Quantum Yield Measurements
For the quantum yield measurements, a barium sulfate coated (203 mm in diameter) integrating sphere from Oriel (Model 70451) was used with a mounted spectrofluorometer sample chamber on the side, opposite to the excitation source. Powder sample was held in a specially designed sample holder with a quartz window to hold the powder in place and mounted at the sample port of the integrating sphere. The diffuse fluorescence spectra from the nanoparticles and the laser profile were recorded with the spectrofluorometer exciting the sample with an 808 nm power tunable fiber coupled Fabry Perot laser diode (Thorlab, Model LM14S2). Different excitation power densities were achieved by changing the current at diode controller. Three different power densities were used to evaluate the QY for Nd3+ doped GdF3 nanoparticles. The fluorescence output from the sphere was collected via a liquid light guide (LLG) with a specially designed baffle that prevents the direct entry of the exciting laser beam into the detector. The LLG collects the light from the sphere and fed to the InGAS detector through the emission monochromator.
2.4 Determination of the Magnetic Properties
2.4.1 Superconducting Quantum Interference measurements
The magnetic properties of our samples were measured by Superconducting Quantum Interference Device (SQUID) in the Magnet and Low Temperature Facility, MRC, at Northwestern University. The hysteresis loop of magnetization at room temperature was recorded with the magnetic field sweeping from −5 to 5 Tesla. The sample was weighted at 50 mg for the measurement [SI-2].
2.4.2 Magnetic Resonance Studies
Experiments were performed on a 7T Pharmscan MR scanner (Bruker, Billerica, MA, USA). For both RF transmission and reception, a quadrature volume coil (61 mm in diameter) was used. Diluted GdF3:Nd3+ (1.0, 0.6, 0.2, 0.1 mg ml−1) in deionized water was placed in 5 ml tubes for imaging. T1-weighted images were obtained with a Fast Low Angle Shot MRI sequence. Imaging parameters were as follows. Field-of-View (FOV) = 5 × 5 cm, matrix size = 128 × 128, slice thickness = 1.5 mm, repetition time (TR) = 400 ms, echo time = 4 ms. Relaxivity (T1 value) was measured using a RARE-VTR sequence. Eight TR (150, 300, 400, 500, 700, 1000, 2000, and 5000 ms) were used and TE = 8.3 ms. Other parameters were identical to the T1-weighted imaging. The data were collected and analysis using Bruker ParaVision 5.1 software. The MR signal intensity of the samples was ascertained by the average intensity in the defined region of interests (ROIs). T1 value of each sample was calculated by fitting M (t) = M0 [1-C × exp (-TR/T1)], where M (t) is the signal intensity at a particular TR, M0 is the equilibrium signal and C is a factor to account for incomplete inversion. The determined T1 values were plotted as R1 (1/T1) vs. concentration of GdF3:Nd3+. 38
2.5 Depth Penetration studies
Penetration depth experiments were done at the biophotonics lab of UTSA by using pork skin tissue. Using a 808 nm laser of maximum 100 mW (excitation power density ~0.17 W/cm2) for all experiments, the emission spectra was collected through various thicknesses of pork skin (0.0 mm, 0.67 mm, 1.39 mm, 2.35 mm, and 4.93 mm) using a 15 cm diameter integrating sphere (Oriel 20451) coupled with a fluorescence spectrometer (Photon Technology International, NJ) [SI-3]. Optical absorption spectrum of pig muscle was obtained using an upgraded Cary model 14R spectrophotometer [SI-4].
2.6 Cytotoxicity and Cell Viability Studies with GdF3:Nd3+
L-929 mouse fibroblast cell line was used to study the viability of cells in the presence of GdF3:Nd3+ nanoparticles. L-929 cells were obtained from ATCC (Manassas, VA, USA) and cultured in Dulbecco’s Modified Eagle medium (DMEM) (Life Technologies Corp., USA) supplemented with 10% fetal bovine serum (Life Technologies Corp., USA). Cells were maintained in an incubator (Panasonic, USA) at a temperature of 37°C regulated with 5% CO2.
Testing was done by plating 96-well plates (Falcon, USA) with L-929 cells at a concentration of approximately 10000 cells per well in DMEM-10%FBS. The cells were incubated at 37°C and 5% CO2 for 24 hours. After 24 hours, PMAO (poly (maleic anhydride- alt-1- octadicene)) coated GdF3:Nd3+ particles were added to the medium at different concentrations of 50, 100, and 200 μg ml−1 in quadruplicates. For the experiment, the blank was only the growth medium with no cells and nanoparticles whereas the positive control was cells in the DMEM-10% FBS with no addition of nanoparticle. After a further incubation for 24 hours, 20 μl of the combined MTS/PMS solution was added to each well and allowed to incubate for 4 hours at 37°C, 5% CO2. Absorbance readings at 490 nm were taken after incubation in the Synergy 2 microplate reader (BioTek, USA).
The cell viability was assessed based on the colorimetric MTS [3-(4,5-dimethylthiazol-2-yl)-5-(3-carboxymethoxyphenyl)-2-(4-sulfophenyl)-2H-tetrazolium, inner salt] assay that is composed of solutions of tetrazolium compound which is bioreduced by cells into a formazan product that is soluble in tissue culture medium. This conversion is accomplished by the dehydrogenase enzymes found in metabolically active cells and as such the amount of 490 nm absorbance measured is directly proportional to the number of living cells in the culture.
2.7 Two-Photon Microscopy
Fibroblast cells (L929) were seeded and grown on glass cover slips. The nanophosphors were infused into growth media by vigorous vortexing at a concentration of 200 μg mL−1, and the cells were incubated in it for 24 hours. Following this, the cells were washed three times with PBS to remove excess phosphors. Then the nuclei were stained with DAPI, and the cytoplasm with Alexa Fluor 647 phalloidin. The samples were then fixed and mounted on microscope slides for imaging in a customized Zeiss 710 multiphoton system. The phosphors were excited with a pulsed titanium sapphire laser by exciting the DAPI at 560 nm, the Alexa fluor at 647 nm while the nanoparticles were excited at 488 nm. In order to reduce the amount of streaking and elongation of the emission, the confocal pinhole was closed until only in-plane emission was detected. In order to confirm the uptake of the uncoated phosphors by cells, colocalization analysis of the raw image data was performed with Imaris.
Results and Discussion
3.1 Synthesis and morphology GdF3:Nd3+
The GdF3:Nd3+ nanoparticles were synthesized by the thermal decomposition (TD) route using trifluroacetate precursors and a three neck flask heated to 345°C in nitrogen atmosphere. The Nd3+ doping concentration was varied to yield 0.1, 0.5, 1.0, and 2.0 mol% of the solution. After synthesis, the solution was sonicated with ethanol, centrifuged to separate the product, and freeze dried. The nanoparticles were coated with poly (maleic anhydride- alt-1- octadicene) (PMAO) as described by Moros et al. to increase water-solubility, cellular uptake, and provide a platform for further bioconjugation through the available carboxyl groups. 1
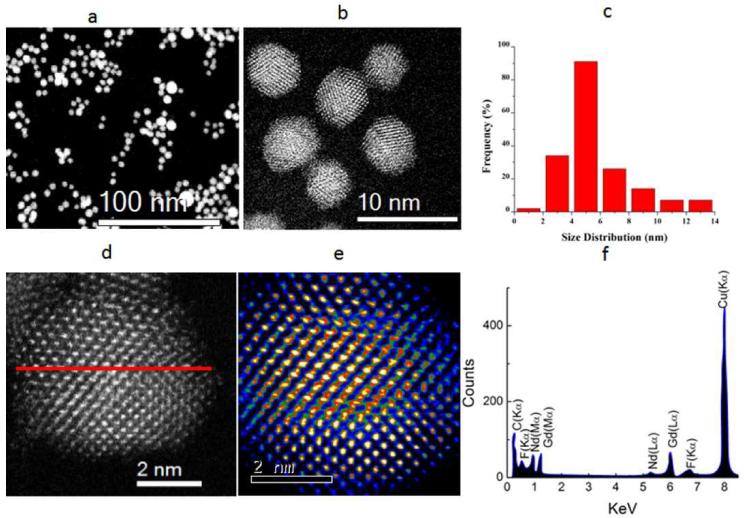
The X-ray diffraction (XRD) results (See SI-1) reveal that the well-crystallized GdF3:Nd3+ nanoparticles show a slight deviation from the hexagonal bulk GdF3 crystal PDF No. 05-0563 but matches well with PDF No. 05-0563 and PDF 72-1435 reported for hexagonal LaF3 and SmF3 nanoparticles respectively with the cell parameters a=b=0.6998, and c = 0.6813 nm. The broadening of the XRD peaks is due to the small size of the particles. Fig. 1 (a, b, d, and e) shows the High Angular Annular Dark Field (HAADF) Scanning Transmission Electron Microscope (STEM) images of the GdF3:Nd3+ nanoparticles which confirm the two different morphologies viz. quasi-spherical and octahedral with particle size distributions ranging from 3-13 nm (the average size of 5.52 nm and a standard deviation of 2.24 nm) as shown in histogram in the inset of Fig. 1(c). Statistically, almost all of the particles were found to be quasi-spherical, however roughly 2% of the nanoparticles were octahedral. A high resolution TEM (HRTEM) image in the inset of Fig. 1(b) elucidates the octahedral morphology of the synthesized particles, and the clear lattice fringes inFig. 1 (d and e) further validate the crystallinity of the Nd3+ doped GdF3 nanoparticles. The compositional distribution was obtained by Energy Dispersive X-ray (EDX) line-scanning analysis, and the spectrum recorded through the center of an individual GdF3:Nd3+ nanoparticle denoted by the red line Fig. 1(d) is shown in Fig. 1 (f). From the EDX, it is seen that the Gd, F, and Nd EDX signals obtained from K, L, and M shell electrons were clearly traced across the region of the nanoparticles.
Fig. 1.
(a, b) Low magnification High Angular Annular Dark Field (HAADF) STEM image of the Nd3+: GdF3 nanoparticles synthesized through thermal decomposition, inset of (b) shows the octahedral morphology of the particles, (c,d) High resolution HAADF image of the GdF3:Nd3+ nanoparticles at atomistic level, (e,) Particle size distribution of Nd3+:GdF3 nanoparticles (f) EDX pattern confirming the doping of Nd3+.
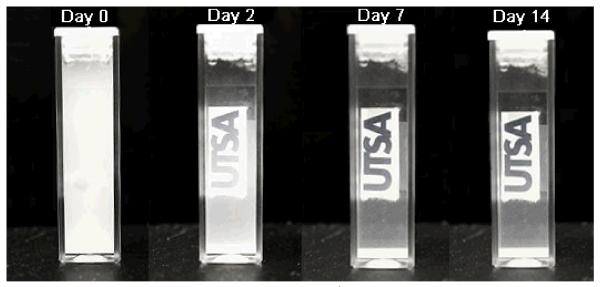
In order to understand the colloidal dispersion stability, a sedimentation study of the GdF3:Nd3+ within deionized water at a concentration of 40 mg mL−1 was performed to see how well the particles remain suspended within the liquid for extended periods of time (See Fig. 2). Even after two weeks, the suspension remains slightly opaque showing the excellent stability of the PMAO coated nanoparticles in water. The long suspension time and stability make them ideal for biomedical applications such as drug delivery.
Fig. 2.
Dispersion stability of GdF3:Nd3+ nanoparticles in deionized water. Even after one week we still can see that the water still has particles in suspension
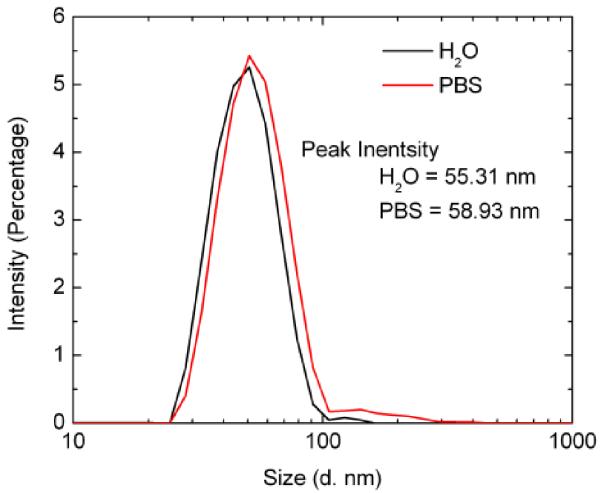
To explore the fundamental importance of using GdF3:Nd3+ nanostructures for bioimaging applications, Dynamic Light Scattering (DLS) measurements and a pH dependence studies were performed to determine the aggregation and the stability of the nanoparticles within media solutions. DLS measurements of PMAO coated GdF3:Nd3+ nanoparticles within DI water and Phosphate Buffer Solution (PBS) were performed at a concentration of 0.1 mg/mL (Fig. 3). The peak size distributions of the nanoparticles were 55.31 nm within DI water and 58.93 nm within PBS. The increase of size compared to the TEM images can be attributed to the PMAO polymer coating with the water molecules and solvent ions that produce a hydrodynamic shell around the nanoparticles when it is in solution. Some aggregation does seem to occur at larger diameters but the majority of the nanoparticles fall within the stated ranges. By showing that these particles exhibit low aggregation and high stability, further bioimaging applications at both in vitro and in vivo levels are to be performed in the future.
Fig. 3.
Dynamic Light Scattering (DLS) measurement of PMAO coated GdF3:Nd3+ nanoparticles in solution of DI water and Phosphate Buffer Solution (PBS) with a measured diameter of 55.31 nm and 58.93 nm respectively
3.2 Spectroscopy Characterization
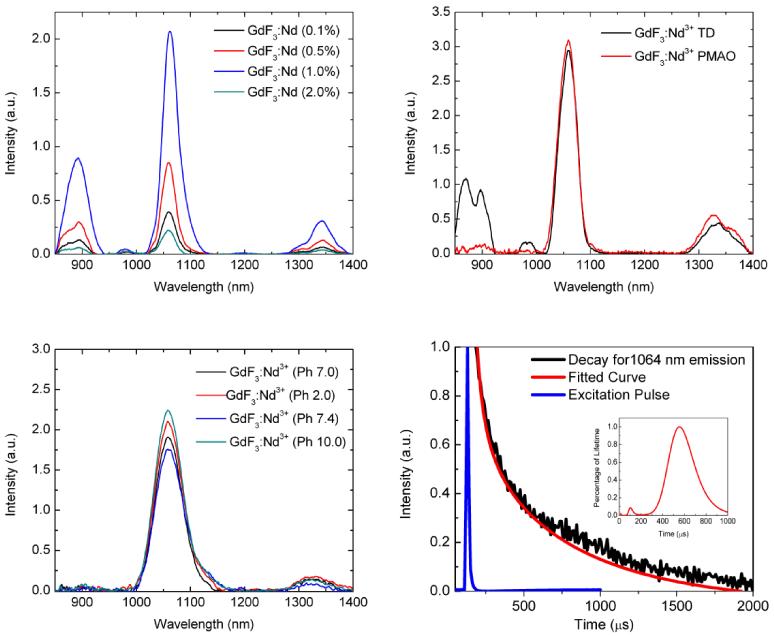
To explore the NIR fluorescence spectral properties of the nanoparticles, samples with Nd3+ concentrations of 0.1, 0.5, 1.0, 2.0 mol % were excited with an 808 nm diode laser under identical experimental conditions with a power density of 1.4 W cm−2 (See Fig. 4(a)). All emission spectra show four primary NIR emission bands at 870, 897, 1064, 1330 nm with the 1064 nm band having the greatest intensity. The GdF3:Nd3+ with a 1.0% doping of Nd3+ yielded the highest 1064 nm emission intensity which further decreased with higher Nd concentration. Fig. 4b) shows the NIR emission spectra obtained with and without the additional PMAO coating. The PMAO coating does not affect the dominant peak significantly which is important since the polymer coating is essential in making the particles biocompatible. Previous studies have shown that GdF3 nanoparticles have very low leeching of ions, so for many applications in biological media, it is essential that a biomarker or probe have pH independent fluorescence properties which may change if stability is altered.39,40 Therefore, a pH dependence study was conducted using deionized water (pH 7.0), HCl 0.1M solution (pH 2.0), NaOH 0.1M solution (pH 10.0), and Minimum Essential Media (MEM) Alpha with 10% Fetal Bovine Serum (pH 7.4) at a GdF3; Nd3+ (1.0%) concentration of 40 mg mL−1. The results shown in Fig. 4(c) suggest that the emission at 1064 nm is not significantly affected over a large change in the pH.
Fig. 4.
(a) The fluorescence profile of GdF3:Nd3+ at 0.1%, 0.5%, 1.0%, and 2.0% dopant concentrations at an 808 nm excitation (b) The fluorescence profile with and without PMAO coating at an 808 nm excitation. c) The emission profile of GdF3:Nd3+ (1.0%) nanoparticles at a concentration of 40 mg mL−1 with: deionized water (pH 7.0), HCl 0.1M solution (pH 2.0), NaOH 0.1M solution (pH 10.0), and Minimum Essential Media (MEM) Alpha with 10% Fetal Bovine Serum (pH 7.4) at a GdF3; Nd3+ (1.0%). d) Fluorescence decay curve for GdF3:Nd3+ (0.1%) at 1064 nm. Inset shows conformation of multi-exponential decays evaluated using the exponential series methods.
When using fluorescence materials in imaging applications, the quantum yield (QY) of the material is a very important factor to consider. To determine and compare the quantum yield for NIR emission at 1064 nm, the experimental setup was calibrated with a material of known efficiency, and the measurements were done following the standard reported procedure.41,42 For these samples, a maximum QY of 10.7 ± 1.6 % was measured for the GdF3: Nd3+ (0.1%) nanoparticles at a power density of 12.74 W cm−2 under 808 nm excitation.
The fluorescence decay times of the 1064 nm emission band were also obtained (See Fig. 4(d))), and the decay curve was fitted by the multiexponential function,
| (1) |
where A1 and A2 are the fitting parameters and τ1 and τ2 are the fluorescence decay times. The decay time values were found to be 81 μs and 708 μs. The statistical weight or contribution from each lifetime was 2% and 98 % respectively as shown in inset of Fig. 4(d). Since the short component of the decay is nearly negligible compared to long component of the decay, it can be inferred that lifetime of 1064 emission of (0.1%) Nd3+ doped GdF3 nanoparticles is almost similar to previously reported lifetime in the similar halide phosphors.43 In time gated fluorescence based biomaging, longer decay time is a favorable factor to discriminate the noises arising from scattered light and autofluorescence. Since the GdF3:Nd3+ (0.1%) shows comparatively higher decay time compared to lowest 110 μs for the GdF3:Nd3+ (2.0 %) dominated with short component, it can be considered as a potential candidate for fluorescence lifetime imaging application.44
3.3 Magnetic Properties
The magnetic properties of the nanoparticles were investigated using a Superconducting Quantum Interference Device (SQUID) magnetometer, and the room temperature magnetization curve is shown in Fig. 5(a). From the nature of the curve, it is clear that the sample exhibits strong magnetic properties because of the presence of the paramagnetic ion Gd3+ which has a larger number of unpaired electrons in the outer orbital. Additional Zero Field cooling (ZFC)-Field Cooling studies (SI-2) also support this conclusion. The magnetic moment per particle was calculated to be ~1020μB by fitting the magnetization curve with the Langevin function.44 As an example of the magnetic behavior, when the nanoparticles, both as a dry powder and in solution, are placed near a permanent magnet of field strength ~ 0.1 T, it is seen that the powder is rapidly attracted to the magnet as shown in the inset of Fig. 5(a). Nanoparticles were also dispersed in deionized water at a concentration of 40 mg ml−1 in a quartz cuvette with a permanent magnet of 0.2 T placed on one side (Fig. 5(b)). Initially the suspension was fully opaque with no visibility of the UTSA logo behind it. After 20 hours, it is clearly seen that most of the particles have moved towards the side containing the magnet, thereby making the solution transparent with the background logo being completely visible. This further demonstrates that the synthesized GdF3:Nd3+ phosphors possess strong enough magnetic tracking features which are useful for magnetic imaging applications.
Fig. 5.
a) Magnetization curve of GdF3: Nd3+ nanoparticles. The inset of a) shows the particles attracted to a magnet as a demonstration of the magnetic nature of the nanoparticles. b) The GdF3:Nd3+ nanophosphor are in deionized water with the original opaque colloidal suspension at 0 hours and an almost transparent suspension after 20 hour with magnet on one side (0.2 T) that shows most of the nanophosphors are attracted by the magnet as seen through the upper transparent part of the suspension.
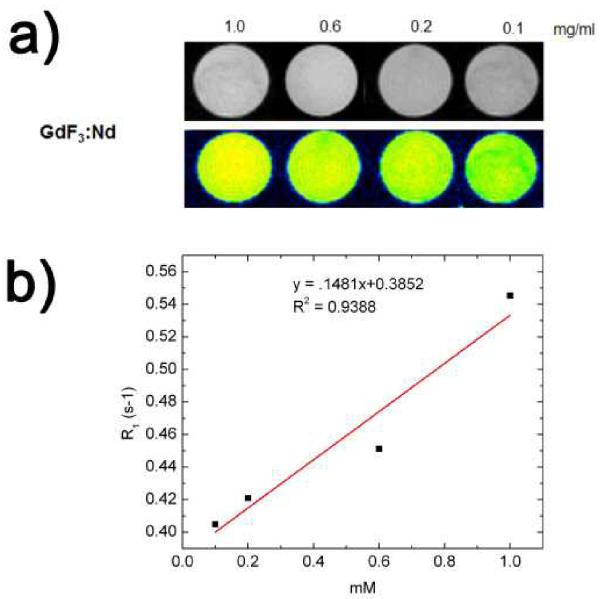
Because of the paramagnetic nature of the GdF3:Nd3+ nanophosphors, they should provide a positive signal enhancement when used as MRI contrast agents. Fig. 6(a) demonstrates the gray-scaled and color-mapped T1-weighted images of the GdF3:Nd3+ for different concentrations that range from 0.1-1.0 mg ml−1 in deionized water. The signal intensity increased with the concentration of GdF3:Nd3+, resulting in the brighter images shown with gray scale. These concentration-dependent differences in signal intensity were even more pronounced in the color-mapped images, and the sample with 1.0 mg ml−1 of the phosphor showed the maximum contrast.
Fig. 6.
a) T1-weighted images of our GdF3:Nd3+ nanoparticles for different concentrations ranging from 0.1 to 1.0 mg mL−1 in deionized water. b) The linearity of the T1 relaxation rate (R1) with the GdF3:Nd3+
The signal enhancement is also evident from the linearity of the T1 relaxation rate (R1) with Gd3+ ion concentrations as shown in Fig. 6(b). It can be seen that the R1 value of water protons enhanced as the Gd-based concentration increased. Relaxivity measurements also showed that the GdF3:Nd3+ phosphors have a concentration-dependent proton longitudinal relaxivity (r1) of 0.1481 mMol−1s−1 on the 7 T scanner. As reported previously, the most commonly used commercial contrast agent, Gd-DTPA, has an r value of 3.7 mMol−1s−1 per Gd3+ ion. A nanoparticle can contain many Gd3+ ions, thus providing much higher signal per probe than single molecule based probes such as Gd-DTPA.38
3.4 Bioimaging
It is well known that most biological tissues have a lower attenuation in the NIR region than in the UV-VIS region. The absorption spectrum of the pig skin under investigation is shown in SI-4, where the lowest attenuation is observed in the 700-1100 nm region. The penetration depth‡ of 1064 nm light makes this a highly favorable emission wavelength for deeper tissue imaging, and the GdF3: Nd3+ nanoparticles are particularly well suited to this due to their strong 1064 nm emission. Following the detailed optical and magnetic characterization of the GdF3:Nd3+ nanophosphors, they were then implemented as contrast agents for NIR excited imaging in tissues and as contrast agents in MRI. Furthermore, the cell viability and cytotoxicity of these nanophopshors was also explored at various concentrations.
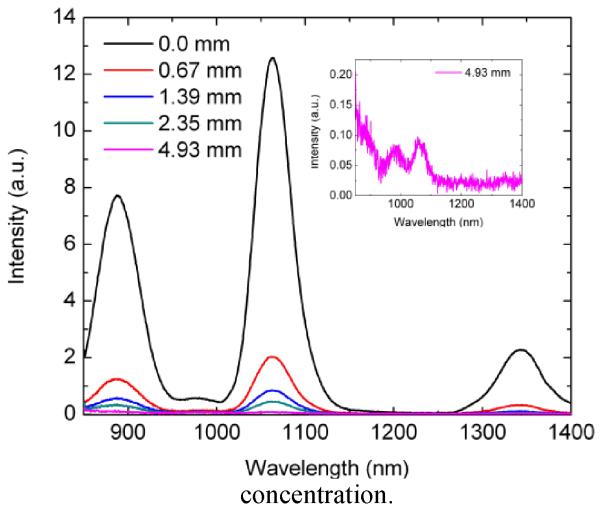
A proof of concept experiment for imaging through tissue was conducted by placing the GdF3:Nd3+ nanoparticles under varying thickness of pig skin, ranging from a 0.67 to 5 mm (See SI-3). Emission spectra were collected through each thickness (See Fig. 7), and it can be seen that the 1064 nm emission is easily discernible even at the greatest tissue thickness of 5 mm (inset of Fig. 7).
Fig. 7.
Fluorescence profile of GdF3:Nd3+ measured through various thicknesses of pork skin. The inset emission profile is at the highest thickness of 4.93 mm from which we can still detect the 1064 nm emission.
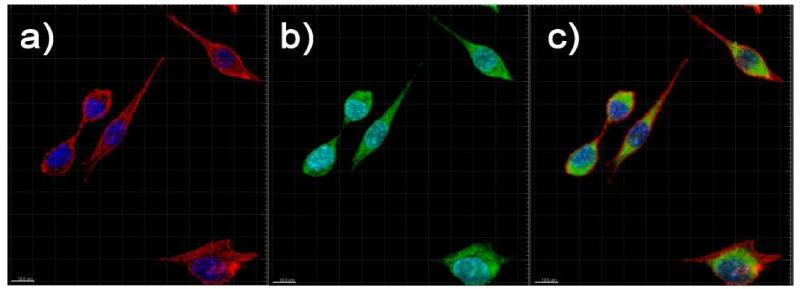
To investigate the suitability of these nanoparticles for bioimaging applications, fibroblast cells (L-929) were incubated with the PMAO coated phosphors for 24 hours, stained, and imaged with a multiphoton/confocal microscope. Optical slices of the cells were obtained by exciting the DAPI at 358 nm, the Alexa Fluor at 647 nm. The nanoparticles were excited at 488 nm and their emission at 532 nm was used to create the nanoparticle channel in the multiphoton microscopy since the current detectors do not respond to 1064 nm. As can be seen in Fig. 7, it is evident that nearly all of the nanoparticles have been internalized by the fibroblasts within 24 hours. The nanoparticles were found to be well dispersed within the cytoplasm and the nuclei when the images were taken, and there was no significant clustering of the nanoparticles nor deformation of the cells due to the nanoparticles.
3.5 Cytotoxicity
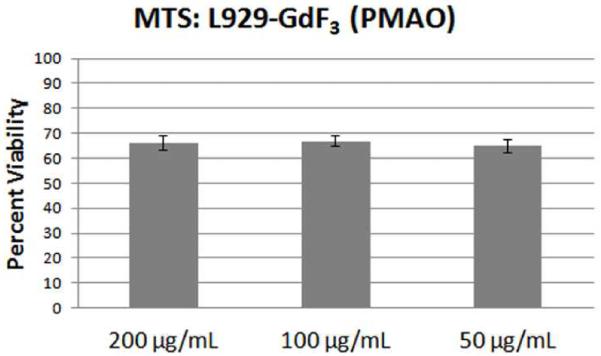
Cytotoxicity tests were performed using L-929 mouse fibroblast cell lines which were incubated with concentrations ranging from 50 to 200 μg mL−1 of uncoated and polymer coated GdF3:Nd3+ nanoparticles (See Fig. 8). After 24 hours, an MTS assay was used to assess the toxicity of nanoparticles at these concentrations. The PMAO coating was chosen to increase water solubility, cellular uptake, and provide a carboxyl group for ease of further functionalization. For the PMAO coated nanoparticles concentrations, the cell viability was above 60 % which shows that the coated particles do not exhibit high toxicity and are biocompatible for use in bioimaging applications.
Fig. 8.
Multiphoton microscope images of fibroblast cells with PMAO coated GdF3:Nd3+ nanoparticles. a) Image of the DAPI stained nuclei (blue channel) and phalloidin stained cytoplasm (red channel). b) Observed emission under 488 nm excitation. The green denotes emission correlated to within the cytoplasm, and the light blue denotes emission correlated to within the nuclei. c) Images of the DAPI, phalloidin, and fluorescent channels together.
4. Conclusion
In conclusion, we have synthesized a multifunctional GdF3:Nd3+ nanophosphor that exhibits efficient NIR fluorescence as well as strong magnetic properties which can be utilized for bimodal imaging in medical applications. These nanoparticles form very stable colloids and can be used as contrast agents for both NIR and magnetic imaging. In particular, the NIR property of these nanophosphors makes them excellent candidates for in vitro and deep tissue in vivo optical bioimaging. The nanophosphors which were coated with PMAO and implemented in cellular imaging show no significant cellular toxicity for concentrations up to 200 μg ml−1. Furthermore, the superior magnetic property of these Gd based nanophosphors also makes them ideal for use as MRI contrast agents. In the future, demonstrations of in vivo imaging within the NIR region will be conducted to show the importance of these particles as a contrast agent. In summary, we developed a nanophosphor that exhibits both excellent optical and magnetic properties to be utilized as a multimodal agent in biomedical applications such as imaging, targeted drug delivery, and photo dynamic therapy.
Supplementary Material
Fig. 9.
Toxicity study of GdF3:Nd3+ nanoparticles using L-929 mouse fibroblast cell line obtained by using MTS assay after 24 hrs. The PMAO (poly (maleic anhydride- alt-1-octadicene)) coated nanoparticles were used at different concentrations with minimal cell death occurring at all the concentrations studied.
Acknowledgements
The authors would like to acknowledge the financial support from the National Science Foundation Partnerships for Research and Education in Materials (NSF-PREM) grant NO-DMR-0934218. We also would like to acknowledge the partial funding from the NIGMS MBRS-RISE GM060655, the National Center for Research Resources (G12RR013646-12), and the National Institute on Minority Health and Health Disparities (G12MD007591) from the National Institutes of Health. The authors would like to thank Chris Rightsell and Zurab Kereselidze for their technical help, Dr. Kelly Nash in the UTSA Functional Nanomaterials Research Laboratory, Dr. Colleen Witt and Dr. Annette Rodriguez in the UTSA Biophotonics Core for their help with the two photon imaging, and Subarna Khanal and Daniel Bahena with their guidance with the HRTEM imaging.
Footnotes
Electronic Supplementary Information (ESI) available: [Four figures are available, SI-1. XRD patterns of the Nd3+: GdF3 nanoparticles synthesized through thermal decomposition; SI-2. Additional Zero Field cooling (ZFC)-Field Cooling studies of GdF3:Nd3+ nanoparticles; SI-3. Integrating sphere setup of our GdF3:Nd3+ nanoparticles placed behind pork skin. The particles were excited through the skin and the emission was collected through the skin using various thicknesses of pig skin; SI-4. The absorption coefficient and penetration depth of pig skin with the highest transmission in the region of emission from Nd3+.]
Penetration depth was obtained as the inverse of the absorption coefficient spectrum.
References
- 1.Moros M, Pelaz B, López-Larrubia P, García-Martin ML, Grazú V, Jesus M. Nanoscale. 2010;2:1746–1755. doi: 10.1039/c0nr00104j. [DOI] [PubMed] [Google Scholar]
- 2.Welch MJ, Redvanly CS. Handbook of radiopharmaceuticals. Wiley Online Library; 2003. [Google Scholar]
- 3.Zhou J, Sun Y, Du X, Xiong L, Hu H, Li F. Biomaterials. 2010;31:3287–3295. doi: 10.1016/j.biomaterials.2010.01.040. [DOI] [PubMed] [Google Scholar]
- 4.Haacke EM, Brown RW, Thompson MR, Venkatesan R. Magnetic resonance imaging: physical principles and sequence design. Wiley-Liss; New York: 1999. [Google Scholar]
- 5.K. M. Hasebroock and N. J. Serkova, 2009.
- 6.Dubertret B, Skourides P, Norris DJ, Noireaux V, Brivanlou AH, Libchaber A. Science. 2002;298:1759–1762. doi: 10.1126/science.1077194. [DOI] [PubMed] [Google Scholar]
- 7.Eggeling C, Widengren J, Rigler R, Seidel C. Anal. Chem. 1998;70:2651–2659. doi: 10.1021/ac980027p. [DOI] [PubMed] [Google Scholar]
- 8.Chan WC, Maxwell DJ, Gao X, Bailey RE, Han M, Nie S. Curr. Opin. Biotech. 2002;13:40–46. doi: 10.1016/s0958-1669(02)00282-3. [DOI] [PubMed] [Google Scholar]
- 9.Kumar R, Nyk M, Ohulchanskyy TY, Flask CA, Prasad PN. Adv. Funct. Mater. 2009;19:853–859. [Google Scholar]
- 10.Nyk M, Kumar R, Ohulchanskyy TY, Bergey EJ, Prasad PN. Nano lett. 2008;8:3834–3838. doi: 10.1021/nl802223f. [DOI] [PMC free article] [PubMed] [Google Scholar]
- 11.Liu Q, Sun Y, Yang T, Feng W, Li C, Li F. J. Am. Chem. Soc. 2011;133:17122–17125. doi: 10.1021/ja207078s. [DOI] [PubMed] [Google Scholar]
- 12.Michalet X, Pinaud F, Bentolila L, Tsay J, Doose S, Li J, Sundaresan G, Wu A, Gambhir S, Weiss S. Science. 2005;307:538–544. doi: 10.1126/science.1104274. [DOI] [PMC free article] [PubMed] [Google Scholar]
- 13.Oh E, Hong M-Y, Lee D, Nam S-H, Yoon HC, Kim H-S. J. Am. Chem. Soc. 2005;127:3270–3271. doi: 10.1021/ja0433323. [DOI] [PubMed] [Google Scholar]
- 14.Zhang J, Campbell RE, Ting AY, Tsien RY. Nat. Rev. Mol. Cell Bio. 2002;3:906–918. doi: 10.1038/nrm976. [DOI] [PubMed] [Google Scholar]
- 15.McAfee JG, Thakur ML. J. Nucl. Med. 1976;17:480. [PubMed] [Google Scholar]
- 16.Derfus AM, Chan WC, Bhatia SN. Nano Lett. 2004;4:11–18. doi: 10.1021/nl0347334. [DOI] [PMC free article] [PubMed] [Google Scholar]
- 17.Hardman R. Environ. Health Persp. 2006;114:165. doi: 10.1289/ehp.8284. [DOI] [PMC free article] [PubMed] [Google Scholar]
- 18.Kawano H, Nabekawa Y, Suda A, Oishi Y, Mizuno H, Miyawaki A, Midorikawa K. Biochem. Biophys. Res. Commun. 2003;311:592–596. doi: 10.1016/j.bbrc.2003.09.236. [DOI] [PubMed] [Google Scholar]
- 19.Wang Y, Shyy JY-J, Chien S. Annu. Rev. Biomed. Eng. 2008;10:1–38. doi: 10.1146/annurev.bioeng.010308.161731. [DOI] [PubMed] [Google Scholar]
- 20.Auzel F. Chem. Rev. Columbus. 2004;104:139–174. doi: 10.1021/cr020357g. [DOI] [PubMed] [Google Scholar]
- 21.Cheng L, Wang C, Ma X, Wang Q, Cheng Y, Wang H, Li Y, Liu Z. Adv. Funct. Mat. 2013;23:272–280. [Google Scholar]
- 22.Gai S, Yang P, Li C, Wang W, Dai Y, Niu N, Lin J. Adv. Funct. Mat. 2010;20:1166–1172. [Google Scholar]
- 23.He M, Huang P, Zhang C, Hu H, Bao C, Gao G, He R, Cui D. Adv. Funct. Mat. 2011;21:4470–4477. [Google Scholar]
- 24.Yi GS, Chow GM. Adv. Funct. Mat. 2006;16:2324–2329. [Google Scholar]
- 25.Pansare VJ, Hejazi S, Faenza WJ, Prud’homme RK. Chem. Mater. 2012;24:812–827. doi: 10.1021/cm2028367. [DOI] [PMC free article] [PubMed] [Google Scholar]
- 26.Huang Y-Y, Chen AC-H, Carroll JD, Hamblin MR. Dose-Response. 2009;7:358–383. doi: 10.2203/dose-response.09-027.Hamblin. [DOI] [PMC free article] [PubMed] [Google Scholar]
- 27.Ammar S, Helfen A, Jouini N, Fievet F, Rosenman I, Villain F, Molinie P, Danot M. J. Mater. Chem. 2001;11:186–192. [Google Scholar]
- 28.Caravan P, Ellison JJ, McMurry TJ, Lauffer RB. Chem. Rev. 1999;99:2293–2352. doi: 10.1021/cr980440x. [DOI] [PubMed] [Google Scholar]
- 29.He M, Huang P, Zhang C, Hu H, Bao C, Gao G, He R, Cui D. Adv. Funct. Mat. 2011;21:4470–4477. [Google Scholar]
- 30.Park YI, Kim JH, Lee KT, Jeon KS, Na HB, Yu JH, Kim HM, Lee N, Choi SH, Baik SI. Adv. Mat. 2009;21:4467–4471. [Google Scholar]
- 31.Shen J, Sun L-D, Zhu J-D, Wei L-H, Sun H-F, Yan C-H. Adv. Funct. Mat. 2010;20:3708–3714. [Google Scholar]
- 32.Cheng L, Yang K, Li Y, Chen J, Wang C, Shao M, Lee ST, Liu Z. Angew. Chem. 2011;123:7523–7528. doi: 10.1002/anie.201101447. [DOI] [PubMed] [Google Scholar]
- 33.Li Z, Zhang Y, Shuter B, Muhammad Idris N. Langmuir. 2009;25:12015–12018. doi: 10.1021/la903113u. [DOI] [PubMed] [Google Scholar]
- 34.Liu J, Bu W, Zhang S, Chen F, Xing H, Pan L, Zhou L, Peng W, Shi J. Chem. Eur. J. 2012;18:2335–2341. doi: 10.1002/chem.201102599. [DOI] [PubMed] [Google Scholar]
- 35.Xing H, Bu W, Zhang S, Zheng X, Li M, Chen F, He Q, Zhou L, Peng W, Hua Y. Biomaterials. 2012;33:1079–1089. doi: 10.1016/j.biomaterials.2011.10.039. [DOI] [PubMed] [Google Scholar]
- 36.Zhang F, Braun GB, Pallaoro A, Zhang Y, Shi Y, Cui D, Moskovits M, Zhao D, Stucky GD. Nano lett. 2011;12:61–67. doi: 10.1021/nl202949y. [DOI] [PubMed] [Google Scholar]
- 37.John D, Rohde A, Urland W. Z. Naturforsch. B Chem. 2006;61:699–707. [Google Scholar]
- 38.Donahue KM, Burstein D, Manning WJ, Gray ML. Magn. Reson. Med. 1994;32:66–76. doi: 10.1002/mrm.1910320110. [DOI] [PubMed] [Google Scholar]
- 39.Botta M, Tei L, Carniato F, Kalaivani T. J. Mater. Chem. B. 2013;1:2442. doi: 10.1039/c3tb20174k. [DOI] [PubMed] [Google Scholar]
- 40.Lux F, Roux S, Perriat P, Tillement O. Curr. Inorg. Chem. 2011;1:117–129. [Google Scholar]
- 41.Kumar GA, Pokhrel M, Sardar DK. Mater. Lett. 2013;98:63–66. [Google Scholar]
- 42.Pokhrel M, Gangadharan A. k., Sardar DK. Mater. Lett. 2013;99:86–89. [Google Scholar]
- 43.Kumar GA, Chen CW, Ballato J, Riman RE. Chemistry of Materials. 2007;19:1523–1528. [Google Scholar]
- 44.Mendoza D, Morales F, Escudero R, Walter J. J. Phys.: Condens. Matter. 1999;11:L317–L322. [Google Scholar]
Associated Data
This section collects any data citations, data availability statements, or supplementary materials included in this article.


