

Abstract
As the intensity of malaria transmission has declined, Plasmodium falciparum parasite populations have displayed decreased clonal diversity resulting from the emergence of many parasites with common genetic signatures (CGS). We have monitored such CGS parasite clusters from 2006 to 2013 in Thiès, Senegal, using the molecular barcode. The first, and one of the largest observed clusters of CGS parasites, was present in 24% of clinical isolates in 2008, declined to 3.4% of clinical isolates in 2009, and then disappeared. To begin to explore the relationship between the immune responses of the population and the emergence and decline of specific parasite genotypes, we have determined whether antibodies to CGS parasites correlate with their prevalence. We measured (i) antibodies capable of inhibiting parasite growth in culture and (ii) antibodies recognizing the surfaces of infected erythrocytes (RBCs). IgG obtained from volunteers in 2009 showed increased reactivity to the surfaces of CGS-parasitized erythrocytes over IgG from 2008. Since P. falciparum EMP-1 (PfEMP-1) is a major variant surface antigen, we used var Ups quantitative reverse transcription-PCR (qRT-PCR) and sequencing with degenerate DBL1α domain primers to characterize the var genes expressed by CGS parasites after short-term in vitro culture. CGS parasites show upregulation of UpsA var genes and 2-cysteine-containing PfEMP-1 molecules and express the same dominant var transcript. Our work indicates that the CGS parasites in this cluster express similar var genes, more than would be expected by chance in the population, and that there is year-to-year variation in immune recognition of surface antigens on CGS parasite-infected erythrocytes. This study lays the groundwork for detailed investigations of the mechanisms driving the expansion or contraction of specific parasite clones in the population.
INTRODUCTION
Malaria is a devastating tropical disease caused by the protozoan parasite Plasmodium. The most severe form of malaria is caused by Plasmodium falciparum and results in 200 million to 300 million people developing clinical disease annually and at least 655,000 deaths worldwide (1, 2). Malaria remains one of the leading causes of death in children under the age of 5 years in sub-Saharan Africa (3). The clinical manifestations of the disease are caused by the erythrocytic stage of the parasite's life cycle, and the majority of the immune response that develops is directed against this stage (4–6), both against parasite proteins involved in invasion and against proteins exported to the surface of the infected erythrocyte.
With the implementation of successful malaria control measures, transmission has declined in some regions, including Senegal. With the drop in transmission intensity, the complexity of exposure, multiplicity of infection, and population-level parasite diversity have decreased; as a result, different individuals—from different households and over different temporal periods of the transmission season—are infected with the same parasite genotype (7). Such observations have been facilitated by recently developed molecular genetic tools enabling rapid tracking of individual parasite genotypes within the population and over time (7, 8). In this study, we focus on a cluster of genetically identical parasites, termed common-genetic-signature (CGS) parasites, which was the first and one of the largest to be observed; these parasites both emerged and declined rapidly, reaching 24% of clinical isolates in 2008, declining to 3.4% in 2009, and then disappearing from all subsequently monitored populations.
Here we begin to address whether the rapid expansion and contraction of this particular parasite genotype can be partially explained by the specific humoral immune responses of infected individuals to these parasites. To do this, we have utilized two different standardized in vitro assays that measure antibodies to erythrocytic parasites, viz., in vitro parasite growth inhibition assays (GIAs) and assays of antibodies to variant surface antigens (VSA) on infected blood red cells (9, 10).
Many of the targets of protective humoral immunity have been identified as merozoite antigens that are involved in invasion (11). Humoral immunity directed against merozoite antigens is thought to act primarily by inhibiting merozoite invasion directly (12, 13), although it has also been suggested to act at the level of enhanced opsonophagocytosis of merozoites by monocytes (14). Great efforts have been made to develop standardized assays for measuring invasion and/or growth-inhibitory antibodies (15–17), a critical tool in assessing vaccine-induced or naturally acquired antibody activity.
Other possible targets for humoral immune responses to parasitized erythrocytes are the proteins on infected erythrocyte surfaces. These antibodies have been involved in cytoadherence, rosetting, and opsonization of infected erythrocytes and have been associated with protection from severe malaria (10, 18). Variation of some of these surface antigens allows the parasite to evade the antigen-specific partial immunity that develops with each exposure (4, 19). Traditionally, studies to measure the antibody response to VSA—encoded by multigene families such as the var, rif, and stevor families—have used agglutination assays and correlated results with protection from disease (20, 21); increasingly, however, these experiments are being performed by flow cytometry (22–25).
As individuals are infected with diverse strains of malaria parasites, acquired immunity develops, and antibodies are a critical component of the immune response (26). However, the parasite has devised strategies to evade these protective antibody responses through clonal antigenic variation of surface-exposed antigens (27, 28). The degree of immune protection against diverse parasite infections is related to the level of exposure to different variant antigens (4, 10, 18, 21). If exposure to the diverse repertoire of parasite antigens decreases, the immune responses generated to these antigens also become more restricted in their recognition.
Because of the variability in parasite antigens and the ability of host immune responses to evolve when confronted with novel parasite antigens, we have used GIAs and VSA assays to begin to test the hypothesis that the antibody responses of the population can modulate the expansion or contraction of specific parasite genotypes. These results lay the foundation for more-detailed investigations of host immune mechanisms and other factors influencing parasite kinetics in the face of declining transmission.
MATERIALS AND METHODS
P. falciparum field parasites.
This study was approved by both the Institutional Review Board of the Harvard School of Public Health (CR-16330-01) and the Ethics Committee of the Ministry of Health in Senegal (0127MSAS/DPRS/CNRES). Passive case detection was performed for patients visiting the clinic in Thiès, Senegal (Service de Lutte Anti-Parasitaire), with malaria-like symptoms, and those who were confirmed to be positive for P. falciparum malaria by a rapid diagnostic test (when available) and a microscopy slide were offered the opportunity to enroll in the study. Both venous blood samples (5 ml) and finger prick blood spotted onto filter paper were collected from consenting patients. Upon transport to the laboratory in Dakar, Senegal, erythrocytes and plasma were separated by centrifugation. Plasma was retained and was stored at −20°C prior to IgG purification. Infected erythrocytes were frozen in Glycerolyte for in vitro culture adaptation. In this study, we focus on one cluster of identical (CGS) parasites that was present in 22 of 91 monogenomic clinical isolates in 2008 (24%) and declined to 3 of 85 monogenomic clinical isolates (3.4%) in 2009. (Monogenomic status was determined by Msp1 and Msp2 typing and by 24-SNP [single nucleotide polymorphism] molecular barcoding from filter paper blood taken directly from patients.) The 25 total parasites in this CGS cluster did not demonstrate any significant difference in patient clinical parameters (age, parasitemia, temperature, and hematocrit [anemia]) from noncluster (non-CGS) parasites. Three monogenomic parasite strains were successfully adapted to short-term in vitro culture (no more than 1 month) prior to in vitro immune assays: Th109.09 (CGS-1), Th153.09 (CGS-2), and Th250.08 (non-CGS). Since these three strains were adapted to in vitro culture, periodic barcoding was performed to confirm that there was no cross-contamination with other genotypes and to confirm the specific molecular barcode of each strain.
Parasite genotyping.
Genomic DNA was extracted from whole-blood spots on Whatman FTA filter paper (Whatman). DNA was extracted from filter paper punches by using the manufacturer's protocol for the Promega Maxwell DNA IQ Casework Sample kit (Promega), and a molecular barcode genotype was generated for each sample, as described previously (8). Whole-genome 17,000-SNP array hybridization, in addition to sequencing of the highly polymorphic T cell epitope of circumsporozoite protein (CSP), established that parasites with identical barcodes are identical at the level of their DNA sequences (7).
RNA and cDNA preparation.
RNA from synchronous mid-schizont-stage parasite cultures was prepared using initial lysis with TRI reagent BD (Molecular Research Center), followed by purification on PureLink RNA minicolumns (Invitrogen). RNA was treated with Turbo DNase (Invitrogen), and cDNA was synthesized using SuperScript III and random hexamers (Invitrogen).
Total-IgG purification.
Plasma samples from patients infected with clinically mild malaria were isolated from 5 ml venous blood collected in EDTA Vacutainers. Plasma samples were separated and were stored at −20°C prior to use. Plasma samples were randomly selected from 2008 (n = 8) and 2009 (n = 9) based on available sample volume. IgG purification was performed from 1 ml of plasma from each sample, as described in detail previously (29). After purification, the protein concentration of each total-IgG sample was determined by a NanoDrop system and was adjusted to 20 mg/ml with sterile 1× unsupplemented RPMI medium. IgG samples were stored at −80°C until GIAs were performed.
GIAs with total IgG.
GIAs were performed as described previously (17), with minor modifications. The final IgG concentration in all assays was 10 mg/ml. Due to the lower parasite multiplication rate observed for some culture-adapted field strains than for lab strains, synchronous late-trophozoite to mid-schizont-stage parasite cultures were diluted to 0.5 to 1.0% initial parasitemia rather than 0.3%. After reinvasion and growth to late-trophozoite to mid-schizont stage, assays were harvested, and results were read immediately.
Variant surface antigen (VSA) binding of infected erythrocytes by flow cytometry.
Synchronous late-trophozoite to mid-schizont-stage parasite cultures were diluted to 1% hematocrit to prevent clumping and were washed twice with 1× PBS (phosphate-buffered saline) plus 2% FBS (fetal bovine serum). IgG surface staining was assessed as described previously (23) with minor modifications. Plasma samples from patients who were infected with clinically mild malaria were isolated from 5 ml venous blood collected in EDTA Vacutainers, separated, and stored at −20°C prior to use. The plasma samples were randomly selected from 2008 (n = 55) and 2009 (n = 55), based on available sample volume. Plasma samples were subjected to a specificity criterion of having an average IgG reactivity no greater than 5% (in general, the maximum observed background staining of unexposed plasma) to uninfected erythrocytes from two different donors. Any samples that failed to meet this criterion were excluded from analysis. Of the 110 plasma samples tested, only 1 failed to meet this criterion and was excluded, resulting in the inclusion of 109 plasma samples in the final analysis. In addition to measuring the percentage that were IgG positive, we scored plasma samples as responders or nonresponders based on a 2σ cutoff (mean + 2 times the standard deviation for nine unexposed Boston plasma samples). This allowed us to compare the percentage of positive responders across all experiments.
var gene Ups class expression profiling.
Quantitative PCR was performed on cDNAs using iTaq SYBR Green Supermix with ROX (Bio-Rad) with an ABI Prism real-time PCR machine. The primers used in these experiments have been described previously (30), but the exact primer pairs used are listed in Table S1 in the supplemental material. cDNA (prepared with and without reverse transcriptase) was diluted 1/10 with diethyl pyrocarbonate (DEPC)-grade water, and 1 μl was used per reaction. The reaction mixture was as follows for each primer pair: 1 μl cDNA, 10 μl SYBR green, 4 μl primer mixture (equal parts of forward and reverse primers at 2.5 μM; final concentration, 0.5 μM), and 5 μl DEPC-grade water. Samples were run in triplicate except for the controls seryl-tRNA synthetase and fructose bisphosphate aldolase, which were run in sextuplicate. The reaction conditions were as follows: 95°C for 10 min (initial denaturation), followed by 40 cycles of 95°C for 15 s, 54°C for 40 s, and 60°C for 1 min, with no final extension. Data were analyzed as the change in the threshold cycle (ΔCT) relative to the CT for seryl-tRNA synthetase.
var gene DBL1α sequencing.
DBL1α regions were amplified from cDNAs by PCR as described previously (31) and from genomic DNA (gDNA) as a control. Briefly, three sets of primer pairs, described in Table S2 in the supplemental material, were used to amplify overlapping regions of DBL1α: primer pair 1, nDBLF/α-BR (450- to 550-bp products); primer pair 2, α-AF/α-BR (375- to 475-bp products); primer pair 3, nDBLF/nDBLR (250- to 350-bp products) (31, 32). All PCR products were amplified with the following reaction mixture: 2.5 μl 10× Platinum Taq high-fidelity buffer, 0.5 μl deoxynucleoside triphosphates (dNTPs) (10 mM stock; Denville Scientific), 1 μl 50 mM MgCl2 (Invitrogen), 0.5 μl forward primer (10 μM), 0.5 μl reverse primer (10 μM), 0.2 μl Platinum Taq high-fidelity polymerase, 18.8 μl of DEPC water, to which 1 μl of cDNA or gDNA was added for each strain. Reactions with and without reverse transcriptase were performed for all PCR pairs. Primer pairs 1 and 3 were used with a program consisting of 95°C for 3 min, followed by 35 cycles of 94°C for 15 s, 45°C for 30 s, and 60°C for 45 s, with a final extension at 72°C for 7 min, as described previously (31). Primer pair 2 was used with a program consisting of 95°C for 5 min, 42°C for 1 min, and 60°C for 1 min, followed by 29 cycles of 94°C for 1 min, 42°C for 1 min, and 60°C for 1 min, with no final extension (32). PCR products were cloned into pCR 2.1 TOPO (Invitrogen), transformed into chemically competent Escherichia coli TOP10 or XL10-Gold cells, and plated on agar with 100 μg/ml carbenicillin. A total of 48 colonies per PCR were selected and were sequenced in both the forward and reverse directions using a Sanger dideoxy sequencing approach. Only sequences that yielded good-quality sequence in both directions were included in the analysis.
var sequence analysis.
Sequence reads were analyzed individually. Contigs were generated using SeqMan (Lasergene 10) and were translated using MacVector (version 12.7). Translated consensus sequences were scanned for the RSFADIG motif described previously (31). For sequences containing the RSFADIG motif, alignments of consensus sequences were performed using ClustalW. PfEMP-1 motifs associated with disease states have been described previously (31), and motif logos were created using WebLogo (UC Berkeley).
var transcript dominance.
The dominance of the var transcript for each patient was scored according to the method described by Normark et al. by using the equation fij = rij/ni (where rij is the number of sequences for patient i in cluster j and ni is the total number of reads from each patient i) for each primer pair (31). The α-AF/α-BR primer set (primer pair 2) was prioritized in the determination of the 3 dominant contigs for each patient isolate, as described previously (31). var sequences identified by BLAST as PFE1640w (varCOMMON or var1CSA) were excluded from dominance analysis.
var DBL1α network analysis.
We used a network approach to analyze the relationships between var sequences. We generated consensus sequences from the three primer sets (VARseg1 to -3 [see Fig. 4A]), yielding 126, 131, and 124 PCR products for non-CGS, CGS-1, and CGS-2 strains, respectively. These were then trimmed to subdomains II and III and were examined for 100% identity at the amino acid level, collapsing, respectively, to 36, 44, and 43 unique sequences for both gDNA and cDNA; 26, 30, and 26 unique sequences for gDNA alone; and 16, 22, and 21 unique sequences for cDNA alone. We refer to the number of redundant sequences that collapse to each unique sequence as the number of corroborating sequences. The percentage of identity between sequences was measured pairwise by (i) aligning sequences using MUSCLE (33) and (ii) calculating identity as the ratio of the number of residues of agreement in the alignment to the total possible, i.e.,
The 80%-identity network was formed by linking two vertices (genes) if they were identical at a level of 80% or higher.
FIG 4.

Characteristics of DBL1α domains of CGS parasites. (A) Schematic illustrating the DBL sequencing strategy as well as DBL1α subdomains and PCR segments. (B) Alignment of representative sequences from VARseg2 for CGS and non-CGS parasites. CGS parasites show a predominance of 2-Cys var genes, whereas non-CGS parasites show a predominance of 4-Cys var genes. Cysteines are highlighted in yellow. (C) Motifs identified in CGS and non-CGS parasites based on previous studies by Normark et al. (31). (D) Network showing the relationship of CGS and non-CGS sequences to the global background. Each var gene is represented by a vertex, and vertices are linked if they share an exact match of significant length at the amino acid level. Colored vertices correspond to Senegalese isolates and are slightly enlarged for clarity. Gray vertices correspond to the seven global isolates creating the global background of var DBL1α sequence diversity. (E) Overlap diagrams for the genomic var repertoire (gDNA) (left) and expressed var transcripts (cDNA) (right). Each vertex in the diagram represents a unique var DBL1α sequence tag, and links indicate 80% or more sequence identity at the amino acid level. Vertex sizes correspond to the numbers of corroborating sequences, with larger vertices indicating higher confidence.
To investigate the amount of var gene repertoire and expressed var transcript overlap at 80% identity that one would expect by chance, we conducted five randomization tests using an augmented data set consisting of CGS-1, CGS-2, and non-CGS parasites, as well as seven parasites whose var repertoires were published from whole-genome sequencing (34): 3D7, HB3, IT4, DD2, PFCLIN, IGH, and RAJ116. In our randomized tests, two parasites are selected—which two depends on which of the five tests—and we select sequences from each parasite's repertoire, without replacement. We create an 80%-identity network between the two sets of sequences and measure the Jaccard distance between them, where the size of the union is the total number of network components and the size of the intersection is the number of mixed components, connecting both parasites. The five randomized tests were as follows: (i) compare the repertoires of CGS-1 and CGS-2, (ii) compare the repertoires of 3D7 and 3D7, (iii) compare 2 of the 10 parasites' repertoires, chosen at random, provided that the 2 parasites are not the same and are not CGS-1 and CGS-2, (iv) compare the repertoires of the CGS-1 and non-CGS parasites, and (v) compare the repertoires of CGS-2 and non-CGS parasites. A total of 10,000 replicates were carried out for each test, giving a high degree of discriminating power. These five tests serve to measure the distributions of var repertoire overlap (under PCR-like subsampling) between (i) CGS-1 and CGS-2 parasites, (ii) two parasites known to be identical, (iii) two parasites believed to be different, and (iv and v) CGS and non-CGS parasites with the same subsampling procedure as comparisons i, ii, and iii. Subsampling was done with 15 sequences for cDNA analysis alone because the smallest expressed var transcript repertoire in the data set comprised 16 sequences. Subsampling was done with 25 sequences for gDNA analysis alone because the smallest var gene repertoire in the data set comprised 26 sequences.
Separately, a recombination network was generated using the same augmented set of CGS-1, CGS-2, and non-CGS parasites and the seven whole-genome repertoires (“global” [34]) and applying the network construction technique of Larremore et al. (35). Briefly, highly variable regions of sequences are extracted and compared pairwise at the amino acid level, with two sequences linked when they share an exact match of 6 amino acids or longer within the highly variable region.
RNA-seq analysis.
Two hundred nanograms of total RNA was sent to BGI (Tai Po, Hong Kong) for RNA-seq (transcriptome sequencing) data generation. cDNA transcripts were enriched using poly(A) selection, and raw read data were analyzed at the Broad Institute (Cambridge, MA). Reads were trimmed with Trimmomatic, ends of reads were removed if phred quality was less than 15 (36), reads were aligned to the 3D7 reference genome with TopHat (37), transcript expression was measured with CuffLinks (38), and samples were compared with CuffDiff2 (39). Statistical analysis was performed using FPKM (fragments per kilobase per million) metric values for each locus. Additionally, de novo transcriptome assembly (without a 3D7 consensus) was performed for each of the sequenced samples using the Trinity platform (40). Dominant var genes were identified in the transcriptome assemblies by using the RSEM utility (41) to map reads back onto the assembled contigs, and calculated FPKM values were compared with those identified by cloning and sequencing using BLAST (42).
RESULTS
Parasites with a common genetic signature are equally inhibited by IgG.
To determine whether parasites with a common genetic signature were equally or differentially recognized by growth-inhibitory antibodies, we performed standardized GIAs using IgG purified from randomly selected plasma samples collected from Senegalese malaria patients in 2008 (n = 8) and 2009 (n = 9) and CGS parasite strains adapted to short-term in vitro culture. We observed a strong correlation between GIA inhibition levels for the CGS-1 and CGS-2 parasite strains, indicating that these strains are antigenically similar, at least in terms of their growth-inhibitory repertoires (Fig. 1A). Further, when IgG was stratified by year, we observed no difference in the levels of inhibition by IgG from 2008 and IgG from 2009, whether cumulatively for both CGS parasites (Fig. 1B) or individually for the CGS-1 (Fig. 1C) or CGS-2 (Fig. 1D) parasite.
FIG 1.

Equivalent inhibition of CGS parasites by GIA. (A) Association between levels of inhibition of two CGS parasite strains by IgG. The percentages of inhibition by GIA are shown for the CGS-1 and CGS-2 strains. Inhibition by IgG from 2008 (n = 8) and 2009 (n = 9) is shown. The Spearman rank correlation coefficient and P value are shown. (B through D) No significant difference in inhibition between IgG from 2008 and IgG from 2009 was observed for the CGS parasites combined (CGS-1 and CGS-2) (B), for CGS-1 parasites (C), or for CGS-2 parasites (D). A nonparametric Mann-Whitney U test was performed. Wide horizontal bars represent medians; error bars, interquartile ranges. ns, not significant.
Parasites with a common genetic signature are equally recognized by surface binding of IgG, which differs year to year.
To determine whether parasites with an identical genetic signature were equally or differentially recognized by plasma IgG directed against variant surface antigens (VSA), we performed VSA staining assays by flow cytometry for CGS or non-CGS parasites (Fig. 2; see also Fig. S1 in the supplemental material). While we observed no significant positive correlation between the surface staining of the non-CGS parasite and that of either CGS parasite (data not shown), we observed a strong positive correlation between the VSA recognition by CGS-1 and that by CGS-2, implying that the CGS parasites are antigenically similar at the level of VSA recognition (Fig. 2A). When all 109 plasma samples analyzed were classified as positive or negative responders by using a cutoff, the non-CGS parasite showed equivalent reactivities to 2008 and 2009 plasma samples, whereas both CGS parasites exhibited dramatically higher surface recognition of 2009 plasma samples than of 2008 plasma samples by a Z-test for two population proportions (Fig. 2B).
FIG 2.

Differential recognition of CGS parasite variant surface antigens over time. (A) A significant positive correlation was observed for VSA staining of the two CGS parasites by using plasma samples from 2008 and 2009 combined. The data shown are from the largest experiment (n, 49 plasma samples). The Spearman rank correlation coefficient and P value are shown, as well as a line representing the best linear fit. (B) When the surface staining levels of all 109 IgGs were compared by using a 2σ cutoff, no difference between years was observed in VSA surface staining levels for the non-CGS parasite; however, significant differences in VSA surface staining levels were observed for both CGS parasites.
Parasites with a common genetic signature express similar var Ups types, marked by upregulation of var UpsA.
Various multigene families, such as the var, rif, and stevor multigene families, encode antigens expressed on the infected-erythrocyte surface that are recognized by anti-VSA antibodies. However, because PfEMP-1 is a dominant component of the VSA response (43), we characterized the var genes expressed by CGS parasites by var Ups quantitative reverse transcription-PCR (qRT-PCR) (Fig. 3). This approach allows us to determine the classes of var genes, defined by their promoters, expressed in each parasite strain. We observed that the CGS parasites expressed similar var Ups classes (Fig. 3A), marked by striking upregulation of UpsA var genes (between 5-fold and 4,000-fold), specifically var UpsA3 (upregulated 4,790-fold in CGS-1 and 200-fold in CGS-2) (Fig. 3B), relative to expression by the non-CGS parasite.
FIG 3.
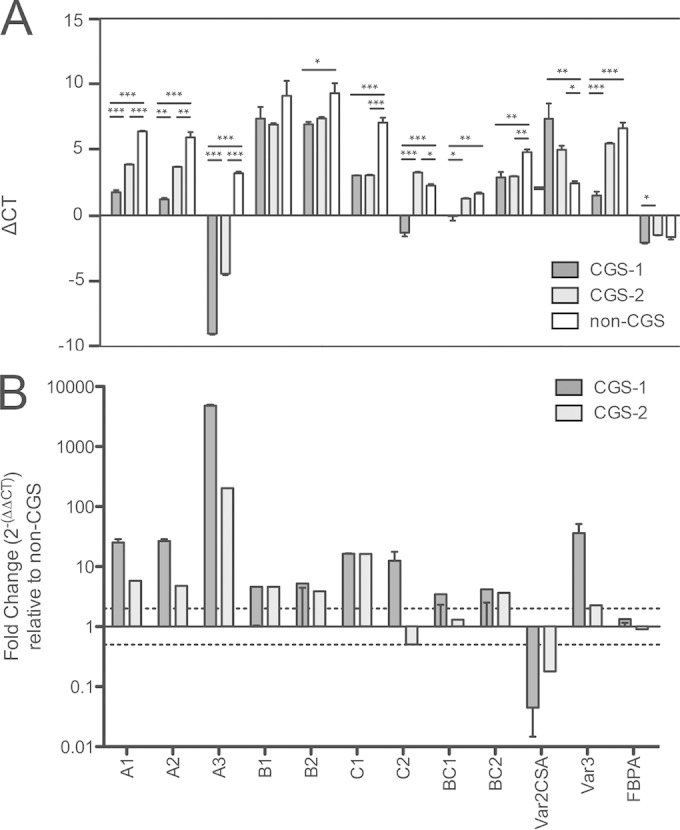
UpsA var expression in CGS parasites. (A) Quantitative PCR of var Ups classes. Data are displayed as ΔCT values relative to that of seryl-tRNA synthetase. Error bars represent means for triplicates (or, in the case of fructose biphosphate aldolase, for sextuplicates); error bars, standard errors of the means. Asterisks indicate significant differences by one-way analysis of variance (*, P < 0.05; **, P < 0.01; ***, P < 0.001). (B) The fold change in var Ups expression by CGS parasites from that by non-CGS parasites was calculated as 2−ΔΔCT. Dotted lines indicate 2-fold differences in either direction, which were selected as the cutoffs for biologically significant differences in transcription. Significant upregulation of UpsA (specifically UpsA3) is observed for CGS parasites relative to expression by non-CGS parasites. Bars represent mean fold changes; error bars, ranges. FBPA, fructose-bisphosphate aldolase.
Parasites with a common genetic signature express different yet similar dominant var genes and are marked by a predominance of 2-cysteine-containing (2-Cys) var genes.
In addition to Ups class, we wanted to determine the dominant var genes expressed in these parasites and to identify any sequence motifs or characteristics that might distinguish the groups functionally. We characterized the var gene DBL1α domains, which are involved in rosetting and endothelial binding, by sequencing using degenerate DBL1α domain primers, as described previously (31, 32) (Fig. 4A). The 3 dominant var transcripts expressed for each PCR segment are described in Table 1. The dominant var gene transcribed for both CGS parasites (CGS-1 and CGS-2) was PF3D7_1100200 (GenBank accession no. ABD92262.1), an UpsA var gene, whereas the dominant var gene expressed for the non-CGS parasite had GenBank accession no. ABC95935.1 and was most similar by homology to a var gene of an uncomplicated isolate from Mali (Table 1). These data were further corroborated by RNA-seq transcriptome assembly results, which identified the same dominant var transcript for each strain: PF3D7_1100200 for CGS-1 and CGS-2 and GenBank accession no. ABC95935.1 for the non-CGS parasite (data not shown). Further, the transcriptional profiles of the CGS parasites were highly similar, with no significant differences observed (see Fig. S2A in the supplemental material), whereas comparisons between the CGS-1 or CGS-2 strain and the non-CGS strain (see Fig. S2B and C in the supplemental material, respectively) yielded 4 and 6 significant differences, respectively, in the transcribed var profiles for 77 var genes and pseudogenes.
TABLE 1.
DBL1α-sequenced dominant var sequencesa
| Segment | Strain | Proportion of reads amplified (%) | PSI BLAST GenBank accession no. | % identity | Annotation of similar sequence identified by BLAST |
|---|---|---|---|---|---|
| VARseg1 | CGS-1 | 7/15 (46.6) | ACH53749.1 | 64 | Var UpsC |
| 4/15 (26.6) | ABD92262.1 | 97 | Var UpsA | ||
| 2/15 (13.3) | ADX61680.1 | 77 | PIK11 (Pikine, Senegal) | ||
| CGS-2 | 5/12 (41.6) | ABM88755.1 | 65 | Isolate IT4/25/5 | |
| 2/12 (16.6) | ADX61998.1 | 73 | PIK45 (Pikine, Senegal) | ||
| 2/12 (16.6) | ADX61557.1 | 99 | PIK05 (Pikine, Senegal) | ||
| Non-CGS | 7/14 (50) | ADX60873.1 | 73 | KIL04 (Kilifi, Kenya) | |
| 2/14 (14.3) | ACH53720.1 | 77 | Var UpsC | ||
| 2/14 (14.3) | ADX61012.1 | 70 | KIL31 (Kilifi, Kenya) | ||
| VARseg2 | CGS-1 | 7/33 (21.2) | ABD92262.1 | 99 | Var UpsA |
| 5/33 (15.2) | CAJ39106.1 | 86 | Patient 4140, sequence group 2, Kilifi, Kenya (2-Cys) | ||
| 4/33 (12.1) | CAJ39782.1 | 81 | Patient 4130, sequence group 3, Kilifi, Kenya (2-Cys) | ||
| 4/33 (12.1) | ABD92262.1 | 100 | Var UpsA | ||
| CGS-2 | 10/32 (31.3) | ABD92262.1 | 99 | Var UpsA | |
| 7/32 (21.9) | ACH53883.1 | 67 | Isolate u24D163f9.1 | ||
| 4/32 (12.5) | ACH53674.1 | 77 | Isolate u19B74r125.3, Var UpsB | ||
| Non-CGS | 16/27 (59.3) | ABC95935.1 | 75 | Mali, uncomplicated isolate | |
| 2/27 (7.4)b | ABC95940.1 | 91 | Mali, uncomplicated isolate | ||
| 2/27 (7.4)b | CAJ40536.1 | 100 | Patient 4187, sequence group 4, Kilifi, Kenya (4-Cys) | ||
| VARseg3 | CGS-1 | 6/14 (42.9) | ADX61607.1 | 86 | PIK07 (Pikine, Senegal) |
| 5/14 (35.7) | ADX61607.1 | 87 | PIK07 (Pikine, Senegal) | ||
| 2/14 (14.3) | ADX61607.1 | 87 | PIK07 (Pikine, Senegal) | ||
| CGS-2 | 3/11 (27.3) | ADX60838.1 | 71 | KIL23 (Kilifi, Kenya) | |
| 3/11 (27.3) | ADX60703.1 | 69 | KIL09 (Kilifi, Kenya) | ||
| 1/11 (9.0)b | ADX61607.1 | 87 | PIK07 (Pikine, Senegal) | ||
| Non-CGS | 15/22 (68.2) | ADX61664.1 | 66 | PIK10 (Pikine, Senegal) | |
| 3/22 (13.6) | ADX61664.1 | 66 | PIK10 (Pikine, Senegal) | ||
| 3/22 (13.6) | ACH53748.1 | 70 | Isolate s29C32r25.2, UpsC |
The three rows represent the three dominantly expressed var sequences for each parasite strain (CGS-1, CGS-2, and non-CGS) based on the results from 48 clones. Boldface sequences represent the dominant var expressed for each parasite isolate.
The percentage of reads amplified falls below the 10% cutoff for a dominant transcript.
We observed that the CGS parasites expressed predominantly 2-cysteine-containing PfEMP-1 molecules, in contrast to the non-CGS parasite, which expressed mostly 4-cysteine-containing PfEMP-1 molecules (Fig. 4B). In addition to the difference in the number of cysteine in PfEMP-1 molecules, we observed motifs previously associated with disease severity (31) in the CGS parasites, in contrast to largely mild motifs and low-rosetting motifs in the non-CGS parasite (Fig. 4C).
Senegalese isolates exhibit a level of diversity comparable to that of global var gene repertoires, yet var gene repertoires and expressed var transcripts of parasites with a common genetic signature are highly overlapping.
To determine the relationships between var DBL1α sequences, we employed a network approach described previously (35). While standard phylogenetic analyses are appropriate in many applications, the extreme diversity of var sequences, generated by frequent recombination, is better analyzed using networks. First, by comparison to other global populations, we sought to determine whether the overall diversity of the Senegalese sequences obtained in this study was in some way unique. We compared CGS-1, CGS-2, and non-CGS parasite sequences to those from 3D7, HB3, IT4, DD2, PFCLIN, IGH, and RAJ116 (34). The Senegalese vertices did not cluster together but instead were spread throughout the network, indicating within-isolate diversity on the same order as total global diversity (35) (Fig. 4D). Moreover, the Senegalese vertices were distributed into all major network communities, indicating full var gene repertoire diversity and structure similar to those of the global population.
To directly investigate similarities between expressed var cDNA transcripts, we generated an additional var sequence network at 80% identity (described in detail in Materials and Methods). This network shows that the expressed var transcripts of CGS-1 and CGS-2 overlap substantially, while the expressed var transcripts of the non-CGS parasite are almost unique (Fig. 4E). At 80% sequence identity, the first link from the non-CGS parasite to either of the CGS parasites appears, while the CGS-1 and CGS-2 parasites are linked at 100% transcript sequence identity.
To investigate the amount of var gene or transcript repertoire overlap at 80% identity that one would expect by chance, we conducted five randomization tests using the CGS-1, CGS-2, and non-CGS parasites, as well as seven parasite strains whose var repertoires have been published previously (34). Null model calculations (described in detail in Materials and Methods) confirm that the non-CGS parasite represents a distinct var repertoire, while those of the CGS-1 and CGS-2 parasites, though statistically different by a Wilcoxon rank-sum test of 10,000 iterations (all P values are <0.0001), are not substantially different, showing high similarity both at the gDNA level (see Fig. S3A and B in the supplemental material) and at the cDNA level (see Fig. S3C and D in the supplemental material). We can conclude with high confidence that the CGS parasites are not unrelated—the “different” and “similar” parasite distributions are completely nonoverlapping, meaning there is a high degree of discriminating power. (Some uncertainty arises in the comparison at the gDNA level due to subsampling of the total ∼60 var genes of each isolate, as 48 clones were sampled per isolate.) The CGS-1 and CGS-2 parasites were similar in both their gDNA var gene repertoires and their expressed var transcripts nearly at the level of replicates of an individual strain (see Fig. S3A and C).
DISCUSSION
In this population-based study, we characterize the immune response to genetically identical parasites isolated from different infected individuals from Thiès, Senegal. While these identical parasites have been observed within a transmission season, they have also been observed across multiple years. These clusters of identical parasites both grow and decline, and some remain stable in their frequency over the years. Such observations could have important implications for the diversity of the immune responses generated over time within the population, and therefore for patterns of herd immunity, but this will depend on the strength of association between antigenic determinants and the loci that are usually tracked by genotyping techniques, which tend to be neutral. In pathogens with high rates of recombination, this association may be weak or variable. Many questions remain as to the forces driving the frequencies of these genetically identical parasites, and we have begun to address the role of host immune responses in the expansion or contraction of specific parasite genotypes in the population.
Here we characterized the immune response to CGS parasites from the first large cluster to be observed that expanded in 2008 and contracted in 2009 before disappearing from subsequent populations. Since the dynamics of the emergence and decline of this particular parasite population were so dramatic, it might be possible to isolate responses to this CGS group from general year-to-year variations. We utilized two different immunologic measurements that might reflect functional antibodies to asexual parasites, viz., an in vitro parasite growth inhibition assay and a VSA assay measuring antibodies to parasite antigens on the surfaces of infected erythrocytes. The former assay evaluates the ability of antibodies to inhibit the invasion of erythrocytes by merozoites, and the latter measures antibodies that could be involved in the clearance of infected red cells.
We found that the two representative CGS parasites from this large cluster were recognized to similar degrees by IgG in both GIAs and VSA assays, showing that they are antigenically similar. To determine whether associations exist between the level of immune reactivity and the frequency of the parasite genotype in the population, we compared the level of GIA activity and VSA staining over time, in 2008 and 2009. While there was no difference in the level of growth inhibition by GIA between 2008 and 2009, there was a dramatic difference in VSA surface recognition between these years. Since VSA recognition has been correlated with protective immunity (10, 18), the increase in population-level recognition in 2009 could possibly help explain why this parasite genotype declined from 24% of clinical isolates to 3.4% in this period before disappearing from the population. One possible mechanism is that a higher level of VSA recognition could lead to increased antibody-mediated effector function against parasitized cells, thus reducing the frequency of this genotype in the population. However, to prove causality would require looking at clusters that span multiple years and ideally looking longitudinally within individuals to measure the development of genotype-specific immunity over time and the potential of this immunity to neutralize reinfecting strains of the same genotype.
While the CGS parasites appeared to be antigenically similar in functional immune assays, we wanted to determine the level of similarity in their variant surface antigen repertoires. While not the only determinant, one of the major determinants of the infected erythrocyte surface immune response is PfEMP-1 (43), encoded by approximately 60 var genes. Depending on the domain architecture of a particular PfEMP-1 molecule, these antigens can be involved in pathogenic processes such as cytoadherence and rosetting (44–46). Immune responses directed against PfEMP-1 have been shown to protect against severe malaria (10, 18). Here we used var Ups qRT-PCR and sequencing with degenerate DBL1α domain primers to characterize the var genes expressed by CGS parasites. We observed that the CGS parasites expressed the same var Ups classes, marked by a striking upregulation of UpsA var genes, while this was not observed for the non-CGS control. This was an unusual result, because all the parasites in this study came from uncomplicated malaria cases; however, UpsA var genes have been associated in other studies with rosetting (47–49) and severe disease (30, 50, 51). Still, while this result is unusual, it is not unprecedented, since other groups have reported the expression of UpsA var genes in uncomplicated malaria cases (47). Of note, UpsA var expression is usually lost with culture adaptation (52, 53), so the upregulation of UpsA var genes is unlikely to be an artifact due to short-term culture adaptation. Additionally, we found a higher prevalence of 2-cysteine-containing PfEMP-1 molecules, which have been associated with UpsA var genes (47), in CGS parasites than in non-CGS parasites, potentially indicating a rosetting (47, 51) or endothelial protein C receptor (EPCR)-binding (54) phenotype. Further work is needed to determine whether these features are unique to this particular cluster or whether they represent a unifying feature that allows for genotype expansion within the population.
In addition to characterizing the var genes expressed by these parasites, we wanted to determine the identities of the dominant var genes expressed by each parasite and the similarity of var gene expression between CGS and non-CGS strains. Since the CGS parasites were isolated from different individuals, we hypothesized that the var genes expressed might be similar but not identical. However, when we sequenced the DBL1α domains from the cDNAs of CGS and non-CGS parasites, we observed that while not all of the top 3 dominant var genes expressed for the CGS parasites were identical, the most dominant var gene was identical and corresponded to a var UpsA gene (PF3D7_1100200), confirming our Ups qPCR results. This result was further confirmed by de novo assembly and expression-level analysis of our RNA-seq data. Additionally, we wanted to determine whether the var expression profiles of CGS parasites were related at a global scale. To this end, we employed network analysis and found that CGS parasites did not cluster within the network, implying that the within-parasite diversity is comparable to between-parasite diversity at the global scale. To investigate var expression repertoire similarities, we generated a var sequence similarity network that showed that the expressed var transcript repertoires of CGS-1 and CGS-2 overlap substantially, while the repertoire of the non-CGS parasite is almost unique. These results were somewhat unexpected, because expressed var transcript repertoires are generally shaped by host immune responses to past exposures, yet these parasites came from different human hosts and from unique transmission events separated by more than 10 days. Most studies involving var switching frequencies as related to mosquito transmission have been done using the rodent malaria model. However, this low-transmission environment might be the ideal setting for examination of the impact of transmission of a single genotype to multiple individual human hosts and the role of the individual immune response in shaping the variant antigen repertoire.
In order to definitively link the immune response to variant surface antigens and population-level immune selection, further studies examining more parasites from more clusters that span multiple years, both expanding and contracting clusters, are needed. Additionally, longitudinal measurement of the development of immunity to a specific genotype in order to determine if this immunity can protect against reinfection or in vitro challenge with autologous and heterologous parasites would provide valuable information on the development and potentially protective nature of immune responses to these genetically identical parasite clusters. Such studies could provide insight into protective immunity directed against novel target antigens that could provide cross-protection against diverse P. falciparum strains.
Supplementary Material
ACKNOWLEDGMENTS
We acknowledge Daria Van Tyne and Kate Fernandez for assistance with adapting Senegalese isolates to culture, Samuel E. Moretz for assistance with IgG purification, and Kim Brolin for useful discussions regarding Ups qPCR. We further acknowledge all the study participants in Thiès, Senegal, for agreeing to participate in this work, as well as Aminata Mbaye, Baba Dieye, Yaye Die Ndiaye, Amanda Lukens, Papa Diogoye Sene, Younous Diedhiou, Lamine Ndiaye, Amadou Mactar Mbaye, and Ngayo Sy for assistance with sample collection and processing.
A.K.B. is funded by an ASTMH Centennial Travel Award. This work was funded by the Bill and Melinda Gates Foundation. Partial support also came from the Intramural Research Program of NIAID, NIH, and from the PATH/Malaria Vaccine Initiative (to C.A.L.). D.B.L. and C.O.B. are supported by award R21GM100207 from the National Institute of General Medical Sciences.
Footnotes
Supplemental material for this article may be found at http://dx.doi.org/10.1128/IAI.01979-14.
REFERENCES
- 1.Snow RW, Guerra CA, Noor AM, Myint HY, Hay SI. 2005. The global distribution of clinical episodes of Plasmodium falciparum malaria. Nature 434:214–217. doi: 10.1038/nature03342. [DOI] [PMC free article] [PubMed] [Google Scholar]
- 2.Murray CJ, Rosenfeld LC, Lim SS, Andrews KG, Foreman KJ, Haring D, Fullman N, Naghavi M, Lozano R, Lopez AD. 2012. Global malaria mortality between 1980 and 2010: a systematic analysis. Lancet 379:413–431. doi: 10.1016/S0140-6736(12)60034-8. [DOI] [PubMed] [Google Scholar]
- 3.Snow RW, Craig M, Deichmann U, Marsh K. 1999. Estimating mortality, morbidity and disability due to malaria among Africa's non-pregnant population. Bull World Health Organ 77:624–640. [PMC free article] [PubMed] [Google Scholar]
- 4.Bull PC, Lowe BS, Kortok M, Molyneux CS, Newbold CI, Marsh K. 1998. Parasite antigens on the infected red cell surface are targets for naturally acquired immunity to malaria. Nat Med 4:358–360. doi: 10.1038/nm0398-358. [DOI] [PMC free article] [PubMed] [Google Scholar]
- 5.Beeson JG, Osier FH, Engwerda CR. 2008. Recent insights into humoral and cellular immune responses against malaria. Trends Parasitol 24:578–584. doi: 10.1016/j.pt.2008.08.008. [DOI] [PubMed] [Google Scholar]
- 6.Doolan DL, Dobano C, Baird JK. 2009. Acquired immunity to malaria. Clin Microbiol Rev 22:13–36. doi: 10.1128/CMR.00025-08. [DOI] [PMC free article] [PubMed] [Google Scholar]
- 7.Daniels R, Chang HH, Sene PD, Park DC, Neafsey DE, Schaffner SF, Hamilton EJ, Lukens AK, Van Tyne D, Mboup S, Sabeti PC, Ndiaye D, Wirth DF, Hartl DL, Volkman SK. 2013. Genetic surveillance detects both clonal and epidemic transmission of malaria following enhanced intervention in Senegal. PLoS One 8:e60780. doi: 10.1371/journal.pone.0060780. [DOI] [PMC free article] [PubMed] [Google Scholar]
- 8.Daniels R, Volkman SK, Milner DA, Mahesh N, Neafsey DE, Park DJ, Rosen D, Angelino E, Sabeti PC, Wirth DF, Wiegand RC. 2008. A general SNP-based molecular barcode for Plasmodium falciparum identification and tracking. Malar J 7:223. doi: 10.1186/1475-2875-7-223. [DOI] [PMC free article] [PubMed] [Google Scholar]
- 9.Crompton PD, Miura K, Traore B, Kayentao K, Ongoiba A, Weiss G, Doumbo S, Doumtabe D, Kone Y, Huang CY, Doumbo OK, Miller LH, Long CA, Pierce SK. 2010. In vitro growth-inhibitory activity and malaria risk in a cohort study in Mali. Infect Immun 78:737–745. doi: 10.1128/IAI.00960-09. [DOI] [PMC free article] [PubMed] [Google Scholar]
- 10.Giha HA, Staalsoe T, Dodoo D, Roper C, Satti GM, Arnot DE, Hviid L, Theander TG. 2000. Antibodies to variable Plasmodium falciparum-infected erythrocyte surface antigens are associated with protection from novel malaria infections. Immunol Lett 71:117–126. doi: 10.1016/S0165-2478(99)00173-X. [DOI] [PubMed] [Google Scholar]
- 11.Kyes S, Horrocks P, Newbold C. 2001. Antigenic variation at the infected red cell surface in malaria. Annu Rev Microbiol 55:673–707. doi: 10.1146/annurev.micro.55.1.673. [DOI] [PubMed] [Google Scholar]
- 12.Brown GV, Anders RF, Mitchell GF, Heywood PF. 1982. Target antigens of purified human immunoglobulins which inhibit growth of Plasmodium falciparum in vitro. Nature 297:591–593. doi: 10.1038/297591a0. [DOI] [PubMed] [Google Scholar]
- 13.Yazdani SS, Mukherjee P, Chauhan VS, Chitnis CE. 2006. Immune responses to asexual blood-stages of malaria parasites. Curr Mol Med 6:187–203. doi: 10.2174/156652406776055212. [DOI] [PubMed] [Google Scholar]
- 14.Bouharoun-Tayoun H, Attanath P, Sabchareon A, Chongsuphajaisiddhi T, Druilhe P. 1990. Antibodies that protect humans against Plasmodium falciparum blood stages do not on their own inhibit parasite growth and invasion in vitro, but act in cooperation with monocytes. J Exp Med 172:1633–1641. doi: 10.1084/jem.172.6.1633. [DOI] [PMC free article] [PubMed] [Google Scholar]
- 15.Dent AE, Bergmann-Leitner ES, Wilson DW, Tisch DJ, Kimmel R, Vulule J, Sumba PO, Beeson JG, Angov E, Moormann AM, Kazura JW. 2008. Antibody-mediated growth inhibition of Plasmodium falciparum: relationship to age and protection from parasitemia in Kenyan children and adults. PLoS One 3:e3557. doi: 10.1371/journal.pone.0003557. [DOI] [PMC free article] [PubMed] [Google Scholar]
- 16.Persson KE, McCallum FJ, Reiling L, Lister NA, Stubbs J, Cowman AF, Marsh K, Beeson JG. 2008. Variation in use of erythrocyte invasion pathways by Plasmodium falciparum mediates evasion of human inhibitory antibodies. J Clin Invest 118:342–351. doi: 10.1172/JCI32138. [DOI] [PMC free article] [PubMed] [Google Scholar]
- 17.Miura K, Zhou H, Moretz SE, Diouf A, Thera MA, Dolo A, Doumbo O, Malkin E, Diemert D, Miller LH, Mullen GE, Long CA. 2008. Comparison of biological activity of human anti-apical membrane antigen-1 antibodies induced by natural infection and vaccination. J Immunol (Baltimore) 181:8776–8783. doi: 10.4049/jimmunol.181.12.8776. [DOI] [PMC free article] [PubMed] [Google Scholar]
- 18.Mackintosh CL, Mwangi T, Kinyanjui SM, Mosobo M, Pinches R, Williams TN, Newbold CI, Marsh K. 2008. Failure to respond to the surface of Plasmodium falciparum infected erythrocytes predicts susceptibility to clinical malaria amongst African children. Int J Parasitol 38:1445–1454. doi: 10.1016/j.ijpara.2008.03.009. [DOI] [PMC free article] [PubMed] [Google Scholar]
- 19.Smith JD, Chitnis CE, Craig AG, Roberts DJ, Hudson-Taylor DE, Peterson DS, Pinches R, Newbold CI, Miller LH. 1995. Switches in expression of Plasmodium falciparum var genes correlate with changes in antigenic and cytoadherent phenotypes of infected erythrocytes. Cell 82:101–110. doi: 10.1016/0092-8674(95)90056-X. [DOI] [PMC free article] [PubMed] [Google Scholar]
- 20.Bull PC, Kortok M, Kai O, Ndungu F, Ross A, Lowe BS, Newbold CI, Marsh K. 2000. Plasmodium falciparum-infected erythrocytes: agglutination by diverse Kenyan plasma is associated with severe disease and young host age. J Infect Dis 182:252–259. doi: 10.1086/315652. [DOI] [PubMed] [Google Scholar]
- 21.Marsh K, Otoo L, Hayes RJ, Carson DC, Greenwood BM. 1989. Antibodies to blood stage antigens of Plasmodium falciparum in rural Gambians and their relation to protection against infection. Trans R Soc Trop Med Hyg 83:293–303. doi: 10.1016/0035-9203(89)90478-1. [DOI] [PubMed] [Google Scholar]
- 22.Lopera-Mesa TM, Doumbia S, Chiang S, Zeituni AE, Konate DS, Doumbouya M, Keita AS, Stepniewska K, Traore K, Diakite SA, Ndiaye D, Sa JM, Anderson JM, Fay MP, Long CA, Diakite M, Fairhurst RM. 2013. Plasmodium falciparum clearance rates in response to artesunate in Malian children with malaria: effect of acquired immunity. J Infect Dis 207:1655–1663. doi: 10.1093/infdis/jit082. [DOI] [PMC free article] [PubMed] [Google Scholar]
- 23.Zeituni AE, Miura K, Diakite M, Doumbia S, Moretz SE, Diouf A, Tullo G, Lopera-Mesa TM, Bess CD, Mita-Mendoza NK, Anderson JM, Fairhurst RM, Long CA. 2013. Effects of age, hemoglobin type and parasite strain on IgG recognition of Plasmodium falciparum-infected erythrocytes in Malian children. PLoS One 8:e76734. doi: 10.1371/journal.pone.0076734. [DOI] [PMC free article] [PubMed] [Google Scholar]
- 24.Staalsoe T, Giha HA, Dodoo D, Theander TG, Hviid L. 1999. Detection of antibodies to variant antigens on Plasmodium falciparum-infected erythrocytes by flow cytometry. Cytometry 35:329–336. doi:. [DOI] [PubMed] [Google Scholar]
- 25.Williams TN, Newbold CI. 2003. Reevaluation of flow cytometry for investigating antibody binding to the surface of Plasmodium falciparum trophozoite-infected red blood cells. Cytometry A 56:96–103. doi: 10.1002/cyto.a.10088. [DOI] [PubMed] [Google Scholar]
- 26.Cohen S, McGregor IA, Carrington S. 1961. Gamma-globulin and acquired immunity to human malaria. Nature 192:733–737. doi: 10.1038/192733a0. [DOI] [PubMed] [Google Scholar]
- 27.Marsh K, Howard RJ. 1986. Antigens induced on erythrocytes by P. falciparum: expression of diverse and conserved determinants. Science 231:150–153. doi: 10.1126/science.2417315. [DOI] [PubMed] [Google Scholar]
- 28.Biggs BA, Gooze L, Wycherley K, Wollish W, Southwell B, Leech JH, Brown GV. 1991. Antigenic variation in Plasmodium falciparum. Proc Natl Acad Sci U S A 88:9171–9174. doi: 10.1073/pnas.88.20.9171. [DOI] [PMC free article] [PubMed] [Google Scholar]
- 29.Malkin EM, Diemert DJ, McArthur JH, Perreault JR, Miles AP, Giersing BK, Mullen GE, Orcutt A, Muratova O, Awkal M, Zhou H, Wang J, Stowers A, Long CA, Mahanty S, Miller LH, Saul A, Durbin AP. 2005. Phase 1 clinical trial of apical membrane antigen 1: an asexual blood-stage vaccine for Plasmodium falciparum malaria. Infect Immun 73:3677–3685. doi: 10.1128/IAI.73.6.3677-3685.2005. [DOI] [PMC free article] [PubMed] [Google Scholar]
- 30.Rottmann M, Lavstsen T, Mugasa JP, Kaestli M, Jensen AT, Muller D, Theander T, Beck HP. 2006. Differential expression of var gene groups is associated with morbidity caused by Plasmodium falciparum infection in Tanzanian children. Infect Immun 74:3904–3911. doi: 10.1128/IAI.02073-05. [DOI] [PMC free article] [PubMed] [Google Scholar]
- 31.Normark J, Nilsson D, Ribacke U, Winter G, Moll K, Wheelock CE, Bayarugaba J, Kironde F, Egwang TG, Chen Q, Andersson B, Wahlgren M. 2007. PfEMP1-DBL1α amino acid motifs in severe disease states of Plasmodium falciparum malaria. Proc Natl Acad Sci U S A 104:15835–15840. doi: 10.1073/pnas.0610485104. [DOI] [PMC free article] [PubMed] [Google Scholar]
- 32.Taylor HM, Kyes SA, Newbold CI. 2000. Var gene diversity in Plasmodium falciparum is generated by frequent recombination events. Mol Biochem Parasitol 110:391–397. doi: 10.1016/S0166-6851(00)00286-3. [DOI] [PubMed] [Google Scholar]
- 33.Edgar RC. 2004. MUSCLE: multiple sequence alignment with high accuracy and high throughput. Nucleic Acids Res 32:1792–1797. doi: 10.1093/nar/gkh340. [DOI] [PMC free article] [PubMed] [Google Scholar]
- 34.Rask TS, Hansen DA, Theander TG, Pedersen AG, Lavstsen T. 2010. Plasmodium falciparum erythrocyte membrane protein 1 diversity in seven genomes—divide and conquer. PLoS Comput Biol 6:e1000933. doi: 10.1371/journal.pcbi.1000933. [DOI] [PMC free article] [PubMed] [Google Scholar]
- 35.Larremore DB, Clauset A, Buckee CO. 2013. A network approach to analyzing highly recombinant malaria parasite genes. PLoS Comput Biol 9:e1003268. doi: 10.1371/journal.pcbi.1003268. [DOI] [PMC free article] [PubMed] [Google Scholar]
- 36.Lohse M, Bolger AM, Nagel A, Fernie AR, Lunn JE, Stitt M, Usadel B. 2012. RobiNA: a user-friendly, integrated software solution for RNA-Seq-based transcriptomics. Nucleic Acids Res 40(Web Server issue):W622–W627. doi: 10.1093/nar/gks540. [DOI] [PMC free article] [PubMed] [Google Scholar]
- 37.Kim D, Pertea G, Trapnell C, Pimentel H, Kelley R, Salzberg SL. 2013. TopHat2: accurate alignment of transcriptomes in the presence of insertions, deletions and gene fusions. Genome Biol 14:R36. doi: 10.1186/gb-2013-14-4-r36. [DOI] [PMC free article] [PubMed] [Google Scholar]
- 38.Trapnell C, Williams BA, Pertea G, Mortazavi A, Kwan G, van Baren MJ, Salzberg SL, Wold BJ, Pachter L. 2010. Transcript assembly and quantification by RNA-Seq reveals unannotated transcripts and isoform switching during cell differentiation. Nat Biotechnol 28:511–515. doi: 10.1038/nbt.1621. [DOI] [PMC free article] [PubMed] [Google Scholar]
- 39.Trapnell C, Hendrickson DG, Sauvageau M, Goff L, Rinn JL, Pachter L. 2013. Differential analysis of gene regulation at transcript resolution with RNA-seq. Nat Biotechnol 31:46–53. doi: 10.1038/nbt.2450. [DOI] [PMC free article] [PubMed] [Google Scholar]
- 40.Haas BJ, Papanicolaou A, Yassour M, Grabherr M, Blood PD, Bowden J, Couger MB, Eccles D, Li B, Lieber M, Macmanes MD, Ott M, Orvis J, Pochet N, Strozzi F, Weeks N, Westerman R, William T, Dewey CN, Henschel R, Leduc RD, Friedman N, Regev A. 2013. De novo transcript sequence reconstruction from RNA-seq using the Trinity platform for reference generation and analysis. Nat Protoc 8:1494–1512. doi: 10.1038/nprot.2013.084. [DOI] [PMC free article] [PubMed] [Google Scholar]
- 41.Li B, Dewey CN. 2011. RSEM: accurate transcript quantification from RNA-Seq data with or without a reference genome. BMC Bioinformatics 12:323. doi: 10.1186/1471-2105-12-323. [DOI] [PMC free article] [PubMed] [Google Scholar]
- 42.Altschul SF, Gish W, Miller W, Myers EW, Lipman DJ. 1990. Basic local alignment search tool. J Mol Biol 215:403–410. doi: 10.1016/S0022-2836(05)80360-2. [DOI] [PubMed] [Google Scholar]
- 43.Chan JA, Howell KB, Reiling L, Ataide R, Mackintosh CL, Fowkes FJ, Petter M, Chesson JM, Langer C, Warimwe GM, Duffy MF, Rogerson SJ, Bull PC, Cowman AF, Marsh K, Beeson JG. 2012. Targets of antibodies against Plasmodium falciparum-infected erythrocytes in malaria immunity. J Clin Invest 122:3227–3238. doi: 10.1172/JCI62182. [DOI] [PMC free article] [PubMed] [Google Scholar]
- 44.Rowe JA, Moulds JM, Newbold CI, Miller LH. 1997. P. falciparum rosetting mediated by a parasite-variant erythrocyte membrane protein and complement-receptor 1. Nature 388:292–295. doi: 10.1038/40888. [DOI] [PubMed] [Google Scholar]
- 45.Chen Q, Barragan A, Fernandez V, Sundstrom A, Schlichtherle M, Sahlen A, Carlson J, Datta S, Wahlgren M. 1998. Identification of Plasmodium falciparum erythrocyte membrane protein 1 (PfEMP1) as the rosetting ligand of the malaria parasite P. falciparum. J Exp Med 187:15–23. doi: 10.1084/jem.187.1.15. [DOI] [PMC free article] [PubMed] [Google Scholar]
- 46.Vogt AM, Barragan A, Chen Q, Kironde F, Spillmann D, Wahlgren M. 2003. Heparan sulfate on endothelial cells mediates the binding of Plasmodium falciparum-infected erythrocytes via the DBL1α domain of PfEMP1. Blood 101:2405–2411. doi: 10.1182/blood-2002-07-2016. [DOI] [PubMed] [Google Scholar]
- 47.Bull PC, Berriman M, Kyes S, Quail MA, Hall N, Kortok MM, Marsh K, Newbold CI. 2005. Plasmodium falciparum variant surface antigen expression patterns during malaria. PLoS Pathog 1:e26. doi: 10.1371/journal.ppat.0010026. [DOI] [PMC free article] [PubMed] [Google Scholar]
- 48.Janes JH, Wang CP, Levin-Edens E, Vigan-Womas I, Guillotte M, Melcher M, Mercereau-Puijalon O, Smith JD. 2011. Investigating the host binding signature on the Plasmodium falciparum PfEMP1 protein family. PLoS Pathog 7:e1002032. doi: 10.1371/journal.ppat.1002032. [DOI] [PMC free article] [PubMed] [Google Scholar]
- 49.Falk N, Kaestli M, Qi W, Ott M, Baea K, Cortes A, Beck HP. 2009. Analysis of Plasmodium falciparum var genes expressed in children from Papua New Guinea. J Infect Dis 200:347–356. doi: 10.1086/600071. [DOI] [PubMed] [Google Scholar]
- 50.Jensen AT, Magistrado P, Sharp S, Joergensen L, Lavstsen T, Chiucchiuini A, Salanti A, Vestergaard LS, Lusingu JP, Hermsen R, Sauerwein R, Christensen J, Nielsen MA, Hviid L, Sutherland C, Staalsoe T, Theander TG. 2004. Plasmodium falciparum associated with severe childhood malaria preferentially expresses PfEMP1 encoded by group A var genes. J Exp Med 199:1179–1190. doi: 10.1084/jem.20040274. [DOI] [PMC free article] [PubMed] [Google Scholar]
- 51.Kyriacou HM, Stone GN, Challis RJ, Raza A, Lyke KE, Thera MA, Kone AK, Doumbo OK, Plowe CV, Rowe JA. 2006. Differential var gene transcription in Plasmodium falciparum isolates from patients with cerebral malaria compared to hyperparasitaemia. Mol Biochem Parasitol 150:211–218. doi: 10.1016/j.molbiopara.2006.08.005. [DOI] [PMC free article] [PubMed] [Google Scholar]
- 52.Fastman Y, Noble R, Recker M, Dzikowski R. 2012. Erasing the epigenetic memory and beginning to switch—the onset of antigenic switching of var genes in Plasmodium falciparum. PLoS One 7:e34168. doi: 10.1371/journal.pone.0034168. [DOI] [PMC free article] [PubMed] [Google Scholar]
- 53.Peters JM, Fowler EV, Krause DR, Cheng Q, Gatton ML. 2007. Differential changes in Plasmodium falciparum var transcription during adaptation to culture. J Infect Dis 195:748–755. doi: 10.1086/511436. [DOI] [PMC free article] [PubMed] [Google Scholar]
- 54.Turner L, Lavstsen T, Berger SS, Wang CW, Petersen JE, Avril M, Brazier AJ, Freeth J, Jespersen JS, Nielsen MA, Magistrado P, Lusingu J, Smith JD, Higgins MK, Theander TG. 2013. Severe malaria is associated with parasite binding to endothelial protein C receptor. Nature 498:502–505. doi: 10.1038/nature12216. [DOI] [PMC free article] [PubMed] [Google Scholar]
Associated Data
This section collects any data citations, data availability statements, or supplementary materials included in this article.