

Abstract
Throughout the vertebrate lineage, dopaminergic neurons form important neuromodulatory systems that influence motor behavior, mood, cognition, and physiology. Studies in mammals have established that dopaminergic neurons often use γ-aminobutyric acid (GABA) or glutamatergic cotransmission during development and physiological function. Here, we analyze vglut2, gad1b and gad2 expression in combination with tyrosine hydroxylase immunoreactivity in 4-day-old larval and 30-day-old juvenile zebrafish brains to determine which dopaminergic and noradrenergic groups may use GABA or glutamate as a second transmitter. Our results show that most dopaminergic neurons also express GABAergic markers, including the dopaminergic groups of the olfactory bulb (homologous to mammalian A16) and the subpallium, the hypothalamic groups (A12, A14), the prethalamic zona incerta group (A13), the preoptic groups (A15), and the pretectal group. Thus, the majority of catecholaminergic neurons are gad1b/2-positive and coexpress GABA. A very few gad1/2-negative dopaminergic groups, however, express vglut2 instead and use glutamate as a second transmitter. These glutamatergic dual transmitter phenotypes are the Orthopedia transcription factor–dependent, A11-type dopaminergic neurons of the posterior tuberculum. All together, our results demonstrate that all catecholaminergic groups in zebrafish are either GABAergic or glutamatergic. Thus, cotransmission of dopamine and noradrenaline with either GABA or glutamate appears to be a regular feature of zebrafish catecholaminergic systems. We compare our results with those that have been described for mammalian systems, discuss the phenomenon of transmitter dualism in the context of developmental specification of GABAergic and glutamatergic regions in the brain, and put this phenomenon in an evolutionary perspective. J. Comp. Neurol. 522:2019–2037, 2014.
Keywords: hypothalamus, posterior tuberculum, preoptic region, subpallium, noradrenergic, A11 dopaminergic neurons
Understanding the roles of specific neurons in neural circuit function and control of behavior requires identification of the neurotransmitters they express to excite, inhibit, or modulate their target neurons. Recent studies on synaptic transmission support the concept that most—if not all—neurons communicate with more than one neurotransmitter (Burnstock, 2004; El Mestikawy et al., 2011; Hnasko and Edwards, 2012). Surprisingly, neurons sometimes even contain cotransmitters with supposedly opposing effects, such as excitatory glutamate and inhibitory γ-aminobutyric acid (GABA). Granule cells of the mammalian hippocampus, for example, release glutamate at synapses connected to CA3 pyramidal neurons. During development and after hyperexcitation or seizure, however, they also discharge GABA (Gutièrrez et al., 2003).
There is evidence that cotransmission is also crucial for neurons that use monoamines as primary transmitter, such as dopamine or noradrenaline (Trudeau, 2004; Chuhma et al., 2009). Dopaminergic (DA) and noradrenergic phenotypes are among the best studied systems in the mammalian brain due to their important modulatory roles in a large variety of neural functions, including the generation and maintenance of emotional states, motivation, motor control, and body homeostasis (Björklund and Dunnett, 2007). In the fore- and midbrain of mammals, 10 major groups of DA neurons have been categorized according to their anatomical location (Dahlstroem and Fuxe, 1964; Hökfelt et al., 1984; Puelles and Verney, 1998). At least during development, a considerable number of these DA groups coexpress a second transmitter, mostly GABA or glutamate. GABA-containing DA neurons, for example, are found in the olfactory bulb A16 group, retinal A17 group, prethalamic zona incerta A13 group, and hypothalamic A12, A14, and A15 group DA neurons (Oertel et al., 1982; Everitt et al., 1984; Kosaka et al., 1987). Only a minority of DA neurons use glutamate as cotransmitter. These neurons are restricted to the mammalian ventral midbrain (A8–10), mainly the ventral tegmental area (VTA; A10) and the substantia nigra pars compacta (SNc; A9) (Descarries et al., 2008; Chuhma et al., 2009), as well as to the diencephalic A11 group (Kawano et al., 2006). The DA neurons of the VTA express vesicular glutamate transporter 2 (VGLUT2) and corelease glutamate during development and adulthood (Kawano et al., 2006; Bérubé-Carrière et al., 2009; Koos et al., 2011). In this case, glutamate serves as a cotransmitter, but in addition facilitates the uptake, packaging, and release of the primary transmitter dopamine, a process called vesicular synergy because of its collaborative effect (El Mestikawy et al., 2011; Hnasko and Edwards, 2012).
Recently, for A16 DA neurons, Borisovska and colleagues (2013) showed that dopamine and GABA are released in distinct modes in these dual transmitter neurons, and may serve temporally distinct roles, with GABA mediating brief and dopamine long-lasting responses. In general, though, the physiological significance of such transmitter dualisms of DA neurons is still fragmentary and their evolution among vertebrates largely unexplored (e.g., Moss et al., 2011).
In this study, we mapped dual GABAergic or glutamatergic neurotransmitter phenotypes of DA and noradrenergic neurons in zebrafish. Because of its significance as a vertebrate model in comparative neurogenetics and evolutionary developmental studies, zebrafish catecholaminergic systems have been extensively characterized. Previous work established that most DA groups topologically correspond to those typically found in mammals and other vertebrates (Holzschuh et al., 2001; Kaslin and Panula, 2001; Rink and Wullimann, 2002; Ma, 2003; McLean and Fetcho, 2004a,b; Filippi et al., 2010; Panula et al., 2010; Yamamoto et al., 2010; Yamamoto and Vernier, 2011). However, a small number of DA groups are either missing or specifically present in zebrafish and other teleost fish. For example, zebrafish lack ventral midbrain DA neurons homologous to the mammalian A8–10 group. Instead, an additional group of DA neurons exists in the zebrafish striatum (dorsal subpallium), which may substitute for some of the mammalian mesostriatal DA input into striatal circuits (Filippi et al., ,; Tay et al., 2011). Also, larval and adult zebrafish display a prominent pretectal group that is absent in the mature mammalian brain. Apart from these differences, most DA groups in zebrafish show clear similarities to mammalian systems. As in mammals, dispersed DA neurons are located in the olfactory bulb (OB; mammalian A16) and in the retina (mammalian A17) of zebrafish.
Also, the diencephalic DA clusters, numbered according to their caudorostral position, show conserved molecular characteristics. One of these conserved DA clusters is the prethalamic group (numbered DC1 in larvae) that depends on expression of the transcription factors arx and islet1 (Filippi et al., 2012). This group is homologous to mammalian neurons of the prethalamic zona incerta (A13), which are defined by the same set of transcription factors during development (Andrews et al., 2003). All DA clusters located in the posterior tuberculum in zebrafish (groups DC 2, 4, 5, and 6) require the activity of the transcription factor Orthopedia (Otp) and express either nkx2.1a or nkx2.1b during development. These groups are homologous to the OTP-dependent A11 DA neurons that form a contiguous band between the pretectum and the thalamus proper in the mammalian brain (Ryu et al., 2007). In contrast, both the DA groups of the preoptic region and the hypothalamus (groups DC 3 and 7) in zebrafish are developmentally defined by the expression of nk2.1a and dlx2a and correlate with mammalian A12 and A14 DA groups. Similar to mammals (Moore and Bloom, 1979), noradrenergic neurons are restricted to the hindbrain in larval zebrafish (Holzschuh et al., 2001), for which a rostral rhombencephalic group corresponding to the locus coeruleus (A6 in mammals), as well as medulla oblongata and area postrema groups of the caudal hindbrain (A1–A3 in mammals) have been described.
Transmitter dualism may represent an additional conserved feature of these ancient DA groups. None of these DA groups in zebrafish, however, has been examined with regard to their potential for GABAergic or glutamatergic transmission. We therefore systematically analyzed the distribution of catecholaminergic neurons in zebrafish with respect to markers that indicate GABA or glutamate as second transmitters. In 4-day-old (4 dpf) larvae and in 1-month-old (30 dpf) juvenile zebrafish, we performed fluorescent in situ hybridization (FISH) to detect either the mRNAs of gad1b and gad2, or of vglut2a and vglut2b, both combined with anti-tyrosine hydroxylase (TH) immunofluorescence. Our findings show that coexpression of GABA or glutamate as a second transmitter is a fundamental feature of catecholaminergic neurons in zebrafish. Most importantly, the majority of DA neurons located in the forebrain are GABAergic, whereas only otp-dependent A11 type neurons, located in the posterior tuberculum, express glutamate as a cotransmitter. Our findings furthermore validate previously postulated homologies to DA and noradrenergic groups between zebrafish and mammals (Filippi et al., ,; Panula et al., 2010; Tay et al., 2011; Yamamoto and Vernier, 2011).
MATERIALS AND METHODS
Animals
Zebrafish (Danio rerio) were bred and maintained in our animal facility under standard conditions (Westerfield, 2000). Fertilized eggs obtained from AB/TL wild-type matings were raised at 28°C and fixed at larval stages in cold 4% paraformaldehyde in phosphate-buffered saline (PBS). For analyses of gad1b/2 and vglut2 expression in the juvenile brain, fish were raised until 30 days of development (30 dpf, 10-mm stage), deeply anesthetized in 0.02% Tricaine (ethyl 3-aminobenzoate methanesulfonate; Sigma, St. Louis, MO), and sacrificed. The brains were removed from the skull, immediately transferred to cold 4% paraformaldehyde, and fixed for 3 days at 4°C. The samples were then dehydrated to 100% methanol and stored at −20°C until use. In total, 8 juvenile zebrafish brains were analyzed in the present study. All experimental procedures were in accord with the German laws for animal care, and a permit was obtained from the Regierungspräsidium Freiburg to sacrifice fish for organ removal and analysis.
Whole-mount fluorescent in situ hybridization
Tyramide signal amplification (TSA)-based fluorescent in situ hybridization was performed as previously described for embryos (Filippi et al., 2007). The same protocol was applied to larvae and whole brains. On the first day, the methanol-stored specimens were rehydrated to PBS containing 0.1% Tween 20 (PBST) and incubated in 1% H2O2 in PBST for 30 minutes, to quench endogenous peroxidase activity. They were then permeabilized by proteinase K treatment (10 μg/ml). The prehybridization was carried out at 65°C in Hybridization Mix (HM: 50% formamide, 5X standard saline citrate [SSC], 50 μg/ml heparin, 5 mg/ml torula RNA, 0.1% Tween 20), and the hybridization was carried out in HM with the specific digoxigenin-labeled antisense probes. On the second day, the probes were removed by formamide/SSC washing series at 65°C (Hauptmann and Gerster, 1994), and the last wash was performed with TNT buffer (100 mM Tris-HCl, pH 7.5, 150 mM NaCl, 0.5% Tween 20) at room temperature. The specimens were then blocked with 1% blocking reagent (Roche, Mannheim, Germany; #1096176) in TNT buffer and incubated overnight with a 1:400 dilution of a peroxidase-conjugated anti-digoxigenin antibody (Roche, #1207733) to detect the probes. On the third day, the samples were washed extensively with TNT buffer and incubated for 1 hour in the dark with the tyramide–Alexa 488 working solution (Invitrogen/ Molecular Probes, Carlsbad, CA; TSA kit #12), prepared according to the manufacturer's instructions. The staining solution was removed by washing the samples several times with TNT buffer.
To detect GABAergic neurons, the following antisense digoxigenin-labeled riboprobes were used: gad1b/gad67 (Martin et al., 1998) was a mixture of two fragments encompassing nucleotides 13–590 and 564–1308 of GenBank accession no. NM_194419; gad2/gad65 (Martin et al., 1998) covered nucleotides 921–1610 of GenBank accession no. NM_001017708.
To detect glutamatergic neurons, a mixture of antisense digoxigenin-labeled riboprobes against vglut2a/slc17a6b and vglut2b/slc17a6a were used (Higashijima et al., 2004). The riboprobes were as follows: vglut2a/slc17a6b comprised nucleotides 454–1387 of GenBank accession no. NM_001128821; vglut2b/slc17a6a comprised nucleotides 572–1026 of GenBank accession no. NM_001009982.
Antibody characterization
We used the anti -zebrafish TH primary antibody generated against a protein containing the amino acids 92–365 encoded by the tyrosine hydroxylase (th) gene (GenBank accession no. NM_131149), expressed in a bacterial system and purified (Ryu et al., 2007). The detailed characterization of the antibody has been previously published (Filippi et al., 2010). The specificity and identity of the antibody was verified by combined fluorescent whole-mount in situ hybridization using a th antisense probe (GenBank accession no. NM_131149) combined with anti-TH immunohistochemistry. Anti-TH immunoreactivity was observed in somata as well as in axons projecting from th mRNA-expressing cells, and the anti-TH antibody did not stain any cell somata in the brain that did not express th (see in Filippi et al., 2010). This antibody has been shown to be specific for the product of the th gene and does not detect the paralogous TH2 protein (Filippi et al., 2010) (Table1).
Table 1.
Antibody Characterization
| Name | Immunogen | Species; manufacturer |
|---|---|---|
| Anti-TH | Amino acids 92–365 encoded by the tyrosine hydroxylase (GenBank accession no. NM_131149) of Danio rerio | Rabbit polyclonal; Ryu et al., 2007; (produced by Sigma Genosys, Cambridge, UK: custom ordered, rabbit log no. 2914) |
| Alexa 555–conjugated secondary goat anti-rabbit antibody | IgG heavy chains and all classes of immunoglobulin light chains from rabbit | Goat polyclonal; Life Technologies (Darmstadt, Germany): Alexa Fluor 555 goat anti-rabbit IgG (H+L) (cat. no. A-21428) |
Immunohistochemistry
After FISH, the specimens were equilibrated with PBS containing 0.1% Tween 20 and 1% dimethyl sulfoxide (DMSO; PBTD), and preincubated for at least 2 hours with blocking solution (10% goat serum and 1% protease-free bovine serum albumin [BSA] in PBTD). They were then incubated overnight with a 1:500 rabbit polyclonal anti-TH primary antibody (Ryu et al., 2007), subsequently detected by a 1:1,000 Alexa 555–conjugated secondary goat anti-rabbit antibody (Life Technologies, Bethesda, MA; cat. no. A-21428).
Vibratome sections
Stained brains were embedded in 3% agarose (molecular biology grade, BIORON, Ludwigshafen Germany; cat. no. 604005) dissolved in PBS and sectioned by using a Leica VT1000S Vibratome. Then 80-μm slices were cut and mounted in Aqua-Poly/Mount (Polysciences, Warrington, PA) for confocal imaging.
Microscopy and imaging
For microscopic observation, larvae were mounted in 80% glycerol/PBS containing 1% agarose. Confocal z-stacks of whole-mount larvae and sectioned brains were recorded by using a Zeiss LSM 5 DUO laser scanning confocal microscope. Then z-projections from subsets of focal planes were generated with the Zeiss LSM software and exported as image format files. The images were assembled into figures and processed with the Adobe (San Jose, CA) Photoshop CS2 9.0 software. Adjustments to contrast and brightness were made by using the Photoshop Levels functions. All adjustments were made to whole images including the enlarged sections, except for Figures 1I1–I3, 3C1–C3, 3F1–F3, and 4F1–F3, for which in the whole enlarged section red and green levels were adjusted to better visualize red and green channel colocalization.
Figure 1.
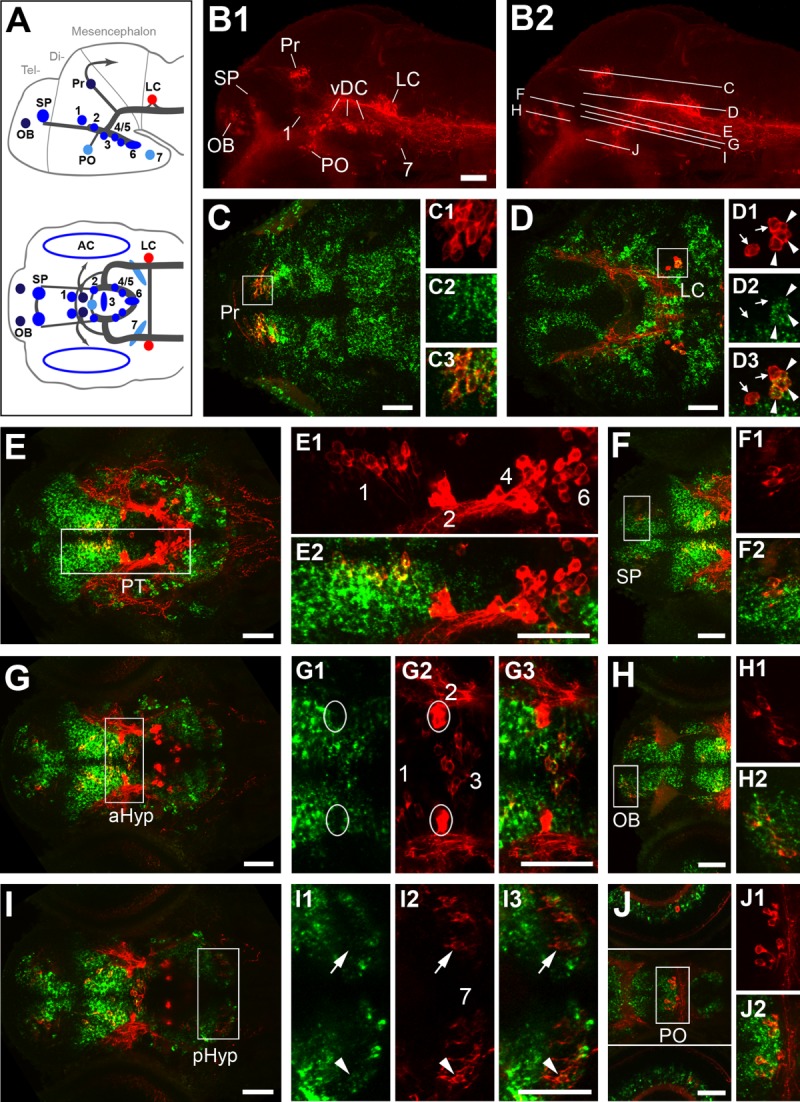
Expression of GABAergic markers gad1b/2 in relation to TH immunoreactivity at 96 hpf. A: Schematic lateral (top) and dorsal (bottom) views of the zebrafish larval brain showing the distribution of catecholaminergic groups detectable by immunohistochemistry at 4 dpf (modified from Tay et al., 2011). B1: Lateral overview of a larval brain immunostained for TH (red), showing the distribution of DA neurons in the olfactory bulb (OB), subpallium (SP), preoptic area (PO), pretectum (Pr), prethalamus (group 1), posterior tuberculum/medial hypothalamus (altogether labeled here vDC and comprising DA groups 2–6), and posterior hypothalamus (group 7), as well as the noradrenergic group in the locus coeruleus (LC). B2 Same image, indicating the dorsoventral level of the confocal planes shown in C–J. C–J: Fluorescent in situ hybridization to gad1b (C,D,F,H,J, green) or gad2 (E,G,I, green) combined with anti-TH immunofluorescence (red). Left panels (C–J) show overviews of dorsal views for planes encompassing different TH-ir clusters. Right panels (C1–C3 through J2) show enlargements of the areas framed by white boxes in the overviews. Double labeling revealed that the majority of DA groups expressed both gad isoforms, which had mostly overlapping expression patterns. gad expression and TH immunoreactivity were codetected for the pretectal group (Pr; C–C3), the prethalamic group (group 1; E,E2), the telencephalic groups (SP and OB; F,F2 and H,H2, respectively), and the preoptic group (PO; J center, J1,J2). The noradrenergic neurons of the locus coeruleus expressed only gad1b (D–D3, arrowheads), although not all of them did so (arrows in D1–D3). The liquor-contacting neurons in the medial hypothalamus (group 3; G–G3) and a subset in the posterior hypothalamus (group 7; I–I3) appear to weakly express only gad2. The arrowheads point at a gad2-expressing DA neuron, whereas a cell immunoreactive for TH but apparently free from gad2 expression is indicated by arrows. Neither gad1b nor gad2 expression could be detected in the posterior tubercular Otp-dependent groups 2,4–6 (E,E2, G–G3). All images in C–J2 are confocal z-projections (5–20-μm depth), except for those in G1–G3, and the top and bottom parts of J, which are separated by white lines and display the retina section, in single confocal planes only. For abbreviations, see list. A magenta–green copy of this figure is available as Supporting Information Figure S1. Scale bar = 50 μm in B1 (applies to B1,B2), C–E, E2 (applies to E1,E2),F, G, G3 (applies to G1–G3), I, J, J3 (applies to J1–J3).
Figure 3.
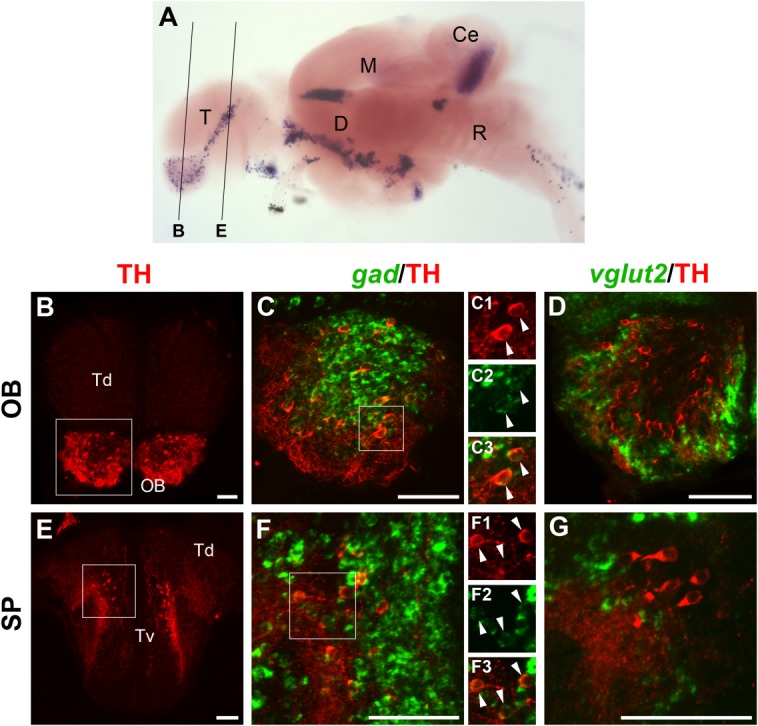
Localization of gad1b/2- or vglut2-expressing cells and TH-ir neurons in the telencephalon of the juvenile brain. A: Lateral overview of a juvenile brain stained for th by in situ hybridization (image taken from Filippi et al., 2010), which serves as anatomical reference to indicate the levels of the sections shown in B–G. B–G: Fluorescent in situ hybridization to detect gad1b/2 (C,F; green) or vglut2 (D,G; green) expression combined with anti-TH immunofluorescence (red). In each row, the image at the left shows an overview of the considered section and displays only TH immunostaining. Higher magnifications of the approximate area framed by the white square are shown to the right, together with either gad1b/2 (C,F) or vglut2 (D,G) staining. All images are 6–10-μm confocal z-projections of areas comprising TH-ir cells in the olfactory bulb (OB; B–D) and in the subpallium (SP; E-G). All telencephalic THir neurons express gad1b/2 (C,F) but not vglut2 (D,G), indicating that they are GABAergic. To better display the colocalization of the markers, C1–C3 and F1–F3 show the individual channels of the areas framed in C and F, respectively. For abbreviations, see list. A magenta–green copy of this figure is available as Supporting Information Figure S3. Scale bar = 50 μm in B–G.
Figure 4.
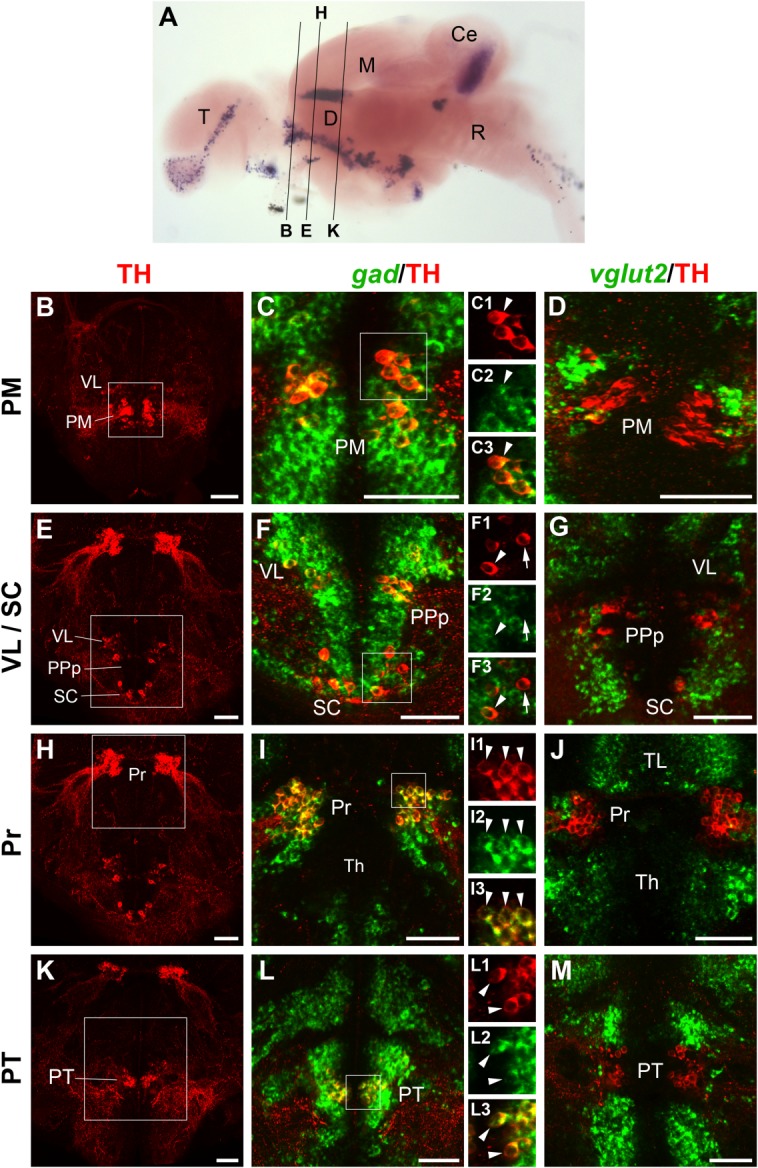
Localization of gad1b/2- or vglut2-expressing cells and TH-ir neurons in the anterior diencephalon of the juvenile brain. A: Overview of section planes shown in B–M (for details, see Fig. 3A legend). B–M: Fluorescent in situ hybridization to detect gad1b/2 (C,F,I,L; green) or vglut2 (D,G,J,M; green) expression combined with anti-TH immunofluorescence (red). The DA clusters in the magnocellular preoptic nucleus (PM; B–D), in the prethalamus and suprachiasmatic nucleus (VL, SC; E–G), in the pretectum (Pr; H–J), and in the posterior tuberculum (PT; K–M) are shown. In each row, the image at the left shows an overview of the considered section and displays only TH immunostaining. The pretectal, prethalamic, and suprachiasmatic clusters are included in the same overview, shown twice in E and H. Higher magnifications of the approximate area framed by the white square in the overviews are shown at their right, together with either gad1b/2 (C,F,I,L) or vglut2 (D,G,J,M) staining. The majority of the images are 4–15-μm confocal z-projections, except for C1–C3, G, and I1–I3, which are single planes. All DA clusters considered in this figure are also GABAergic, as demonstrated by coexpression of TH with gad1b/2, but not with vglut2. The only exception is represented by the suprachiasmatic nucleus, in which some DA neurons express gad1b/2 (arrowhead in F1–F3) and some do not (arrow in F1–F3). For abbreviations, see list. A magenta–green copy of this figure is available as Supporting Information Figure S4. Scale bar = 50 μm in B–M.
RESULTS
To analyze the distribution of GABAergic and glutamatergic cells with relation to DA neurons, we performed FISH to detect GABAergic or glutamatergic markers, coupled with immunofluorescence for TH to detect DA neurons. As markers for GABAergic neurons we used glutamate decarboxylase 1 (gad1b/gad67) and glutamate decarboxylase 2 (gad2/gad65). These genes encode two isoforms of the enzyme that catalyzes the conversion of L-glutamic acid into the neurotransmitter GABA (Martin et al., 1998). To visualize glutamatergic neurons, we used probes for the zebrafish paralogous genes vesicular glutamate transporter 2a (vglut2a) and vesicular glutamate transporter 2b (vglut2b), which code for transporters for uptake of glutamate into synaptic vesicles prior to their release into the synapse (Higashijima et al., 2004). We performed our analysis on whole-mount 4-dpf larvae, when all major larval catecholaminergic (CA) groups are clearly detectable by immunohistochemistry (Holzschuh et al., 2001; Kaslin and Panula, 2001; Rink and Wullimann, 2002). Moreover, to uncover potential changes in neurotransmitter distribution in relation to CA neurons during development, we decided to perform the analysis also in 30-dpf juvenile brains. At this stage of development, the brain is morphologically already very similar to the adult brain while still being small enough to be amenable to whole mount staining.
We used a mixture of vglut2a and vglut2b as riboprobe in all our experiments, and therefore will refer to them together as vglut2. gad1b and gad2 were analyzed together in juvenile brains, as well as individually in larval and juvenile brains, to highlight potential differences in the localization of the two isoforms.
gad1/2 colocalizes with TH in most larval DA clusters
gad1b and gad2 expression has been shown to largely overlap in the developing brain of several model organisms (Ahman et al., 1996; Dupuy and Houser, 1996; Martin et al., 1998). Indeed, a gross comparison of their expression patterns by FISH showed that they are both expressed in a similar manner in major areas of the zebrafish brain at 4 dpf (data not shown). We focused our analysis on the potential colocalization of gad1b/2 with TH immunoreactivity in larval DA clusters, and detected some differences in the distribution of gad1b/2 transcripts in specific nuclei of the brain. Our results are shown in Figure 1, organized from dorsal to ventral (see Fig. 1A, B1, B2 for orientation on the distribution of TH-immunoreactive clusters), and summarized in Table2.
Figure 2.

Expression of the glutamatergic marker vglut2 in relation to TH immunoreactivity at 96 hpf. A: Schematic lateral (top) and dorsal (bottom) views of the zebrafish larval brain showing the distribution of catecholaminergic groups detectable by immunohistochemistry at 4 dpf (modified from Tay et al., 2011). B1,B2: overviews indicating planes of histological sections (for details, see Fig. 1B1,B2). C–J: Fluorescent in situ hybridization to vglut2 (green) combined with anti-TH immunofluorescence (red). Left panels (C–J) show overviews of dorsal views for planes encompassing different TH-ir clusters. Right panels (D1–D3 through J2) show enlargements of the areas framed by white boxes in the overviews. The only groups that appear to express vglut2 are the Otp-dependent groups 2,4–6 in the posterior tuberculum/hypothalamus (E,E2, G,G2). The pretectal group (C), the prethalamic group 1 (E,E2), the hypothalamic groups 3 and 7 (G,G2, I,I2), and the preoptic group (J,J2) do not express vglut2. The noradrenergic neurons of the locus coeruleus (D–D3) are intermingled with vglut2-expressing cells, but they do not appear to express vglut2. The telencephalic groups in the olfactory bulb and in the subpallium (F,F2 and H,H2, respectively) do not express vglut2 but are located in areas adjacent to vglut2-expressing neurons. All images in C–J are 4–13-μm confocal z-projections, except for those in D1–D3, which show a single confocal plane. For abbreviations, see list. A magenta–green copy of this figure is available as Supporting Information Figure S2. Scale bar = 50 μm in B1 (applies to B1,B2), C, D, D3 (applies to D1–D3), E, E2 (applies to E1,E2), F, G, G2 (applies to G1,G2), I, I2 (applies to I2,I2), J.
Table 2.
Expression of gad Genes and vglut2 Genes in Catecholaminergic Groups of the Zebrafish Brain1
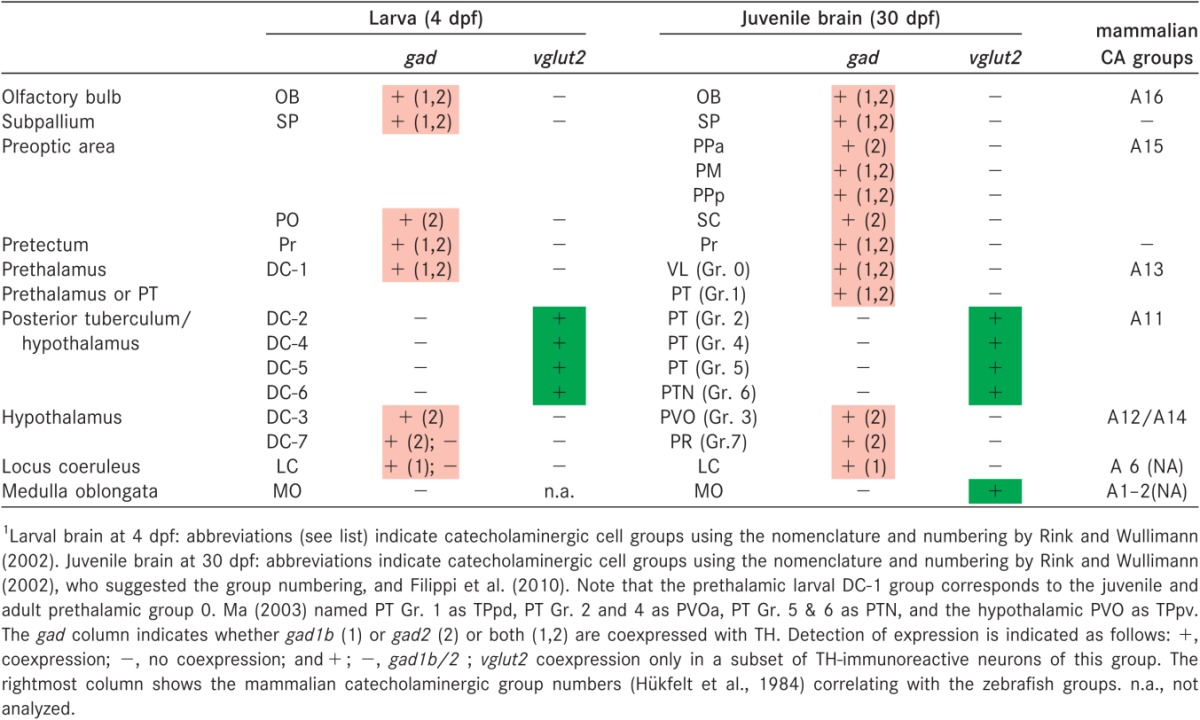 |
In the diencephalon, pretectal DA neurons strongly expressed both gad genes (shown for gad1b in Fig. 1C–C3). The same was true for prethalamic group 1 DA neurons, which reside in a region characterized by strong gad expression (shown for gad2 in Fig. 1E–E2). The Otp-dependent DA neurons (groups 2, 4–6) develop in the posterior tuberculum, and none of them expressed either gad1b or gad2 (Fig. 1E–E2). The large pear-shaped neurons belonging to group 2 were surrounded by GABAergic cells, but did not appear to express gad (Fig. 1G–G3). In the hypothalamus, the liquor-contacting group 3 DA neurons weakly expressed gad2, but did not express gad1b (Fig. 1G–G3). Similarly, group 7 in the posterior hypothalamus appeared to express gad2 only in some (Fig. 1I–I3, arrowhead) but not all neurons (Fig. 1I–I3, arrow). The larval preoptic group, which contributes to the adult suprachiasmatic nucleus, was only gad2-positive (Fig. 1J–J2). The telencephalic subpallial and olfactory bulb DA groups express both GAD isoforms (Fig. 1F–F2, H–H2), and develop in anatomical areas with prominent populations of gabaergic neurons.
In the hindbrain, most noradrenergic neurons of the locus coeruleus expressed gad1b (Fig. 1D–D3, arrowheads), but, interestingly, some cells were negative for both gad transcripts (Fig. 1D–D3, arrows). This suggests that the locus coeruleus group may be a potentially heterogeneous population of noradrenergic neurons.
Finally, the DA amacrine cells of the retina detectable at this stage appeared to be adjacent to cells expressing gad, but no colocalization was observed (Fig. 1J). This confirms previous findings based on double immunohistochemistry for TH and GABA or GAD in zebrafish and trout (Arenzana et al., 2006; Candal et al., 2008).
vglut2 is expressed in larval Otp-dependent DA neurons
When considering colocalization with TH immunoreactivity, the distribution of vglut2-expressing cells in the larval brain was generally complementary to that of gad. We did not observe colocalization of vglut2 and TH in the pretectal group (Fig. 2C). In the hindbrain, many cells surrounding the noradrenergic neurons of the locus coeruleus did express vglut2 (Fig. 2D). Our careful analysis of confocal images, however, revealed that TH-immunoreactive (TH-ir) noradrenergic neurons of the LC did not coexpress vglut2 (Fig. 2D1–D3). The prethalamic area around group 1 DA neurons appeared essentially vglut2-free (Fig. 2E–E2). We also did not detect any vglut2 expression in the liquor-contacting hypothalamic groups 3 and 7 (Fig. 2G–G2,I–I2), the preoptic group (Fig. 2J–J2), the telencephalic subpallial (Fig. 2F–F2), or the olfactory bulb DA neurons (Fig. 2H–H2), although they resided in areas adjacent to vglut2-positive cells. We found vglut2 expression in the ganglionic cell layer of the retina, but not in the amacrine cell layer, where DA neurons develop (Fig. 2J).
In contrast, the posterior tubercular region was characterized by intense vglut2 expression (Fig. 2E). All Otp-dependent DA neurons were double labeled for vglut2 (groups 2, and 4–6; Fig. E–E2,G–G2, arrowheads). Thus, among all DA neurons of the larval brain, coexpression of vglut2 and TH was only observed in the Otp-dependent, A11-type neurons residing in the posterior tuberculum and hypothalamus.
Expression of gad and vglut2 in juvenile brains
Consistent with earlier reports, we detected DA neurons in the olfactory bulb mainly in the glomerular and mitral cell/plexiform layers (Byrd and Brunjes, 1995) (Fig. 3B). In mammals, GABAergic neurons have been shown to develop in the glomerular, mitral, and granule cells layers (Parrish-Aungst et al., 2007), whereas glutamatergic neurons were detected in the external plexiform, glomerular, and mitral cells layers, but not granule cell layer (Brill et al., 2009). All of the TH-ir cells detected in the juvenile olfactory bulb were gad-positive (Fig. 3C–C3) and vglut2-negative (Fig. 3D). Similarly, all TH-ir neurons in the subpallium (Fig. 3E) expressed gad (Fig. 3F–F3), but not vglut2 (Fig. 3G), consistent with earlier reports on gad expression (Mueller and Guo, 2009).
The preoptic area is characterized by the presence of three main DA clusters, one populating the anterior parvocellular preoptic nucleus (PPa), one that reaches from the magnocellular preoptic nucleus (PM; Fig. 4B) to the posterior parvocellular preoptic nucleus (PPp; Fig. 4E), and one in the suprachiasmatic nucleus (SC; Fig. 4E) (Kaslin and Panula, 2001; Rink and Wullimann, 2001; Ma, 2003; Filippi et al., 2010). All these areas were strongly labeled by gad expression, and almost all TH-ir neurons were also gad-positive (Fig. 4C,F and data not shown). Only in the SC did we find a few TH-ir cells that did not appear to express gad (Fig. 4F–F3, arrows). No coexpression between TH and vglut2 was observed in these preoptic clusters (Fig. 4D,G, and data not shown).
In the dorsal diencephalon, the broad pretectal DA group strongly expressed gad (Fig. 4I–I3). Ma (2003) has described the zebrafish pretectal DA group as located exclusively in the ventral part of periventricular pretectal nucleus (PPv). According to Mueller and Guo (2009), who reported gad67 expression in PPd only (PPv being gad67-free), the overlap between gad and TH indicates that DA neurons in the pretectum belong to the dorsal subdivision of periventricular pretectal nucleus (PPd and not PPv). Some cells laterally adjacent to pretectal TH-ir neurons expressed vglut2 (Fig. 4J). In addition, we found strong vglut2 expression in the thalamus, a region of the dorsal diencephalon known to be predominantly glutamatergic (Bae et al., 2009; Scholpp et al., 2009).
The larval prethalamic group DA neurons populate the ventrolateral thalamic nucleus (VL) in the juvenile and adult brain (Rink and Wullimann, 2001; Filippi et al., 2010). As in larvae, the whole juvenile prethalamus was predominantly GABAergic; thus, not surprisingly, we found that all VL DA neurons expressed gad (Fig. 4E,F). Caudal to them, another group of cells characterized by similar morphology could be discerned, just anterior and dorsal to the large pear-shaped group 2 DA neurons (Fig. 4K). Like the prethalamic neurons, these cells were embedded in a GABAergic territory, and they expressed gad (Fig. 4L–L3) but not vglut2 (Fig. 4M).
The most rostral Otp-dependent DA neurons (larval group 2; Fig. 5B) expressed vglut2 (Fig. 5D–D3). These neurons, furthermore, did not express gad despite their proximity to gad-expressing cells (Fig. 5C, see also Fig. 6C). The more caudally located Otp-dependent DA groups in the posterior part of the PT and posterior tuberal nucleus (PTN) also expressed vglut2b during larval stages (larval groups 4–6; Fig. 5E,H) and in the mature brain (Fig. 5G–G3,J–J3). None of these groups expressed gad, whose expression domains were restricted to more ventral regions, namely, the dorsal and caudal zones of the periventricular hypothalamus (Fig. 5F,I).
Figure 5.
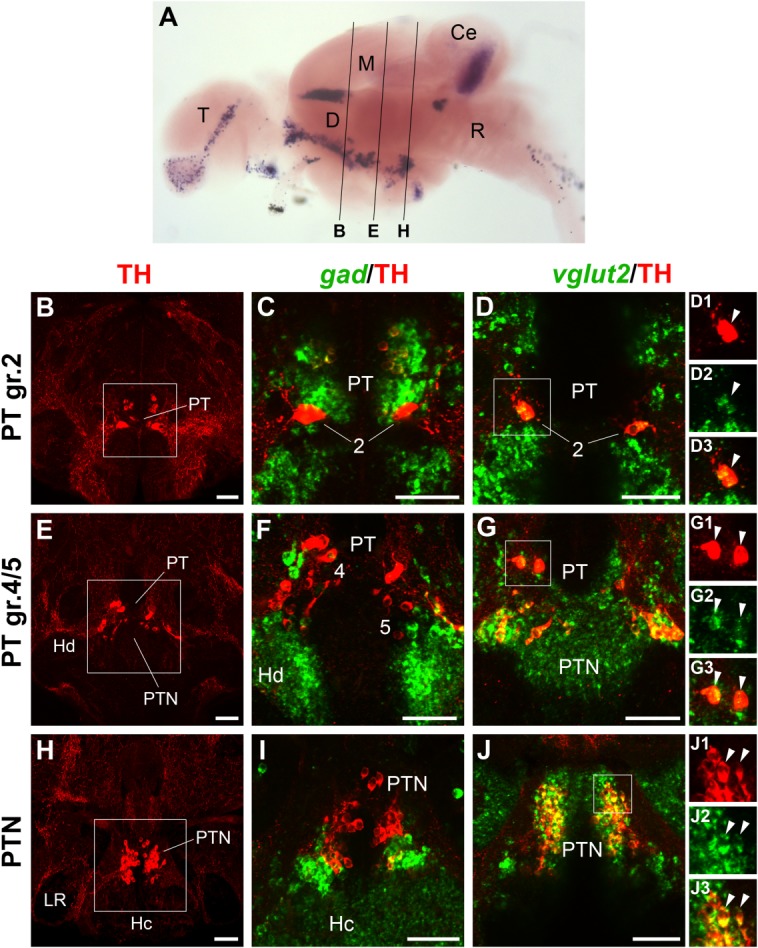
Localization of gad1b/2 or vglut2 expression and TH immunoreactivity in Otp-dependent DA neurons of the juvenile brain. A: Overview of section planes shown in B–J (for details, see Fig. 3A legend). B–J: Fluorescent in situ hybridization to detect gad1b/2 (C,F,I; green) or vglut2 (D,G,J; green) expression combined with anti-TH immunofluorescence (red). The posterior tubercular and hypothalamic Otp-dependent DA neurons are shown. The overviews in B, E, and H are 2–10-μm confocal z-projections encompassing the large pear-shaped DA neurons in the posterior tuberculum (PT; B,E) and the group in the posterior tuberal nucleus (PTN; H). Higher magnifications of the approximate areas framed by the white squares in the overviews are shown at their right, together with either gad1b/2 (C,F,I) or vglut2 (D,G,J) staining (3–16-μm z-projections). All Otp-dependent DA neurons express vglut2 (D,G,J) but not gad1b/2 (C,F,I), indicating that they are also glutamatergic. Individual channels demonstrating coexpression of TH with vglut2 are shown for each group in D1–D3, G1–G3, and J1–J3. For abbreviations, see list. A magenta–green copy of this figure is available as Supporting Information Figure S5. Scale bar = 50 μm in B–J.
Figure 6.
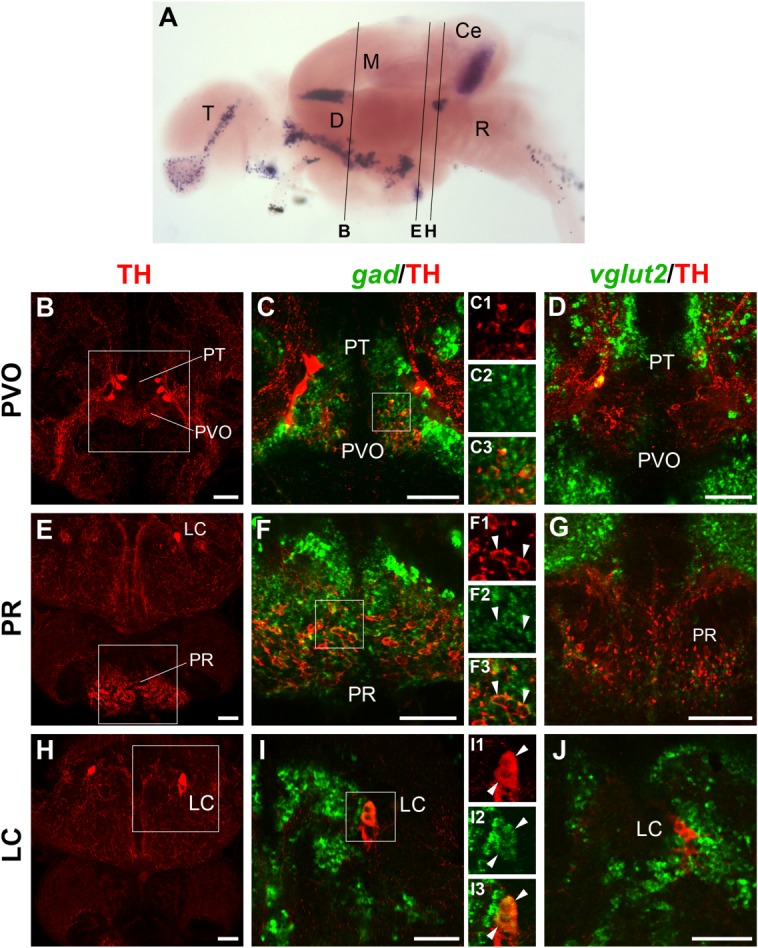
Localization of gad1b/2 or vglut2 expression and TH immunoreactivity in hypothalamus and hindbrain. A: Overview of section planes shown in B–J (for details, see Fig. 3A legend). B–J: Fluorescent in situ hybridization to detect gad1b/2 (C,F,I; green) or vglut2 (D,G,J; green) expression coupled with anti-TH immunofluorescence (red). The overviews in B, E, and H are 5–10-μm confocal z-projections encompassing the hypothalamic groups of liquor-contacting DA neurons located in the paraventricular organ (PVO; B) and in the posterior recess (PR; E), as well as the noradrenergic neurons of the locus coeruleus in the hindbrain (LC; H). All these groups appear to be GABAergic by coexpression of TH with gad1b/2 (C,F,I; 5–8-μm projections), but not with vglut2 (D,G,J; 3–9-μm projections). C1–C3, F1–F3, and I1–I3 are single-channel enlarged views of the framed areas in C, F, and I, respectively. For abbreviations, see list. A magenta–green copy of this figure is available as Supporting Information Figure S6. Scale bar = 50 μm in B–J.
In the periventricular hypothalamus, two main groups of liquor-contacting DA neurons were detected in the paraventricular organ (PVO; Fig. 6B) and in the caudal hypothalamus, lining the posterior recess of the third ventricle (PR; Fig. 6E). Both these regions were almost completely devoid of vglut2 transcripts (Fig. 6D,G), whereas they were mostly gad-positive (Fig. 6C–C3,F–F3). Expression analysis of individual gad isoforms revealed that only gad2 was expressed in these two groups (data not shown; Table2).
In the hindbrain, the noradrenergic neurons of the locus coeruleus (Fig. 6H) appeared to be sandwiched between areas of medial gad expression and lateral vglut2 expression (Fig. 6, compare I with J). Locus coeruleus noradrenergic neurons expressed gad, and were surrounded by both gad- and vglut2-positive cells (Fig. 6I–I3). Also in this case, expression analysis of individual gad isoforms revealed that only gad1b is expressed in the locus coeruleus (Table2).
In the medulla oblongata (Fig. 7B), whereas no overlap was observed between TH and gad (Fig. 7C), we clearly detected coexpression of TH with vglut2 in most noradrenergic neurons (Fig. 7D–D3). A minor number of cells, however, were free of vglut2-expression. However, due to the poor quality of the sections obtained for the posterior hindbrain, the data collected for the noradrenergic group of the medulla oblongata were not complete, and we were not able to determine whether those few vglut2-free cells were GABAergic instead.
Figure 7.
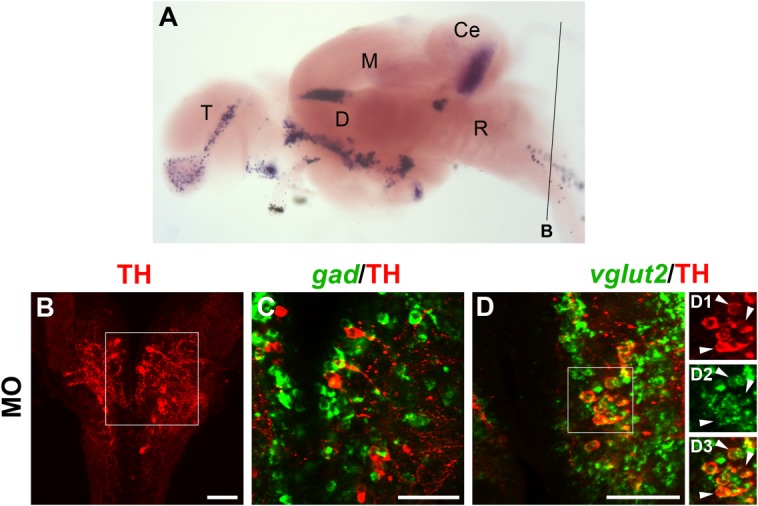
Localization of gad1b/2 or vglut2 expression and TH immunoreactivity in the medulla oblongata at 30 dpf. A: Overview of section plane shown in B–D (for details, see Fig. 3A legend). B–D3: Fluorescent in situ hybridization to detect gad1b/2 (C; green) or vglut2 (D; green) expression combined with anti-TH immunofluorescence (red). The overview in B is a 10-μm confocal z-projection showing TH-ir noradrenergic neurons of the medulla oblongata (MO) in the hindbrain. These neurons were intermingled but not colocalizing with gad-expressing cells (C; 3-μm projection). Instead, we detected coexpression of TH with vglut2 (D–D3; 6-μm projection). D1–D3 are single-channel enlarged views of the framed area in D. The arrowheads point at examples of coexpression. A magenta–green copy of this figure is available as Supporting Information Figure S7. Scale bar = 50 μm in B–D.
DISCUSSION
Expression studies over the past 30 years have revealed that in mammals the coexistence of two or more different neurotransmitters within a single neuron is a common phenomenon (Burnstock, 2004), including in catecholamine systems (Kosaka et al., 1987). Secondary transmitters are often expressed in higher concentrations during development and after seizure, when cotransmitters are suspected of participating in neuronal plasticity and synapse formation (Bérubé-Carrière et al., 2009; Fortin et al., 2012). Secondary transmitters in mammals also engage in neurotransmission proper and can be found in dual transmitter phenotypes in the mature brain (Seal and Edwards, 2006; Descarries et al., 2008; Stuber et al., 2010). A group of DA neurons of the mammalian ventral tegmental area (VTA), for example, contains glutamate, which facilitates vesicular uptake and storage of dopamine, but also acts as a true transmitter (Alsio et al., 2011; El Mestikawy et al., 2011). The role of GABA in DA neurons, however, has not been well studied. Investigations on mammalian retinal explants and olfactory bulb brain slices suggest participation in neural transmission (Maher and Westbrook, 2008; Hirasawa et al., 2012).
Our study on cotransmitters in zebrafish catecholaminergic neurons analyzed the dual expression of either GABAergic or glutamatergic markers together with TH in larval and juvenile zebrafish. Our previous report on the distribution of th-expressing cells in 30-dpf juvenile brains showed that all groups described for the adult by immunohistochemistry (Kaslin and Panula, 2001; Rink and Wullimann, 2001; Ma, 2003) were already developed at this stage (Filippi et al., 2010). Recent work suggested that a potential second TH-encoding gene, th2, may mark additional DA groups in the mature brain (Candy and Collet, 2005; Yamamoto et al., 2010), but the protein product is not detected by our TH antibody (Filippi et al., 2010). However, more recent work revealed that the th2 locus does not encode an enzyme with TH activity (Ren et al., 2013). Therefore, our analysis of TH-ir cells likely covers the entire set of dopamine-producing neurons of the juvenile brain.
We show that in 4-day-old larvae and 1-month-old juveniles all DA and noradrenergic neurons have the potential to synthesize GABA or to load glutamate into vesicles, as traced by the expression patterns of gad1b/2 and vglut2a/b genes versus TH protein. Our results thus demonstrate that in the zebrafish brain most DA neurons can synthesize GABA as a cotransmitter in larvae and mature brain. Prominent groups of gad1b/2-expressing DA neurons are located in areas that are predominantly populated by GABAergic neurons like the subpallium, the preoptic region, the prethalamus, and the hypothalamus (groups 3 and 7). Notably, all of these regions are largely free of vglut2a/b-expressing neurons. However, gad1b/2-positive DA groups also locate adjacent to glutamatergic neurons in regions where GABAergic populations are not predominant, like the pretectum. In contrast, the posterior tuberculum is the only region where we find vglut2a/b-expressing DA neurons (groups 2, 4/5, 6).
We also traced the coexpression of vglut2a/b and TH in noradrenergic neurons of the medulla oblongata in juvenile brains. This result is consistent with findings in rat, in which VGLUT2 was expressed in TH-positive adrenergic neurons of the C1, C2, and C3 groups, in the A2 noradrenergic group, and in cells of the area postrema (Stornetta et al., 2002). Our data for the rhombencephalic area did not allow us to discriminate specific noradrenergic subgroups. However, the correlation between dual glutamate/noradrenaline phenotype in zebrafish and rat points to a functional conservation of the cotransmitter of medullary noradrenergic neurons, in addition to the conservation of their projection pattern (Tay et al., 2011).
Our results show that TH is colocalized with gad1b (but not gad2) in the locus coeruleus of zebrafish. Similar studies in the rat show that noradrenergic neurons of the locus coeruleus are immunoreactive for GABA and stain for GAD in in situ hybridization experiments (Iijima et al., 1992). Although not specified in the original publication, we found in our search of the Rat Genome Database (http://rgd.mcw.edu) that the GAD probe synthesized by Iijima et al. (1992) based on a sequence cloned by Julien et al. (1990) corresponds to the rat GAD1 gene. We conclude that in mammals (rat), similar to zebrafish, expression of the Gad1 isoform alone defines the GABAergic phenotype of noradrenergic neurons within the locus coeruleus.
Our findings regarding the molecular phenotype and homology of most of the DA (and noradrenergic) groups are also consistent with gene expression studies of the genetic regulation of catecholaminergic phenotypes. For example, all of the DA A11-type neurons of the posterior tuberculum coexpressing vglut2a/b require the activity of orthopedia (otp). However, the adjacent hypothalamic DA neurons that express gad1b/2 do not express otp during development (Ryu et al., 2007). These differences can thus be used as a criterion to separate neurons of the hypothalamus from those of the posterior tuberculum, and distinguishing these regions helps in our understanding of gene expression data. As studies in mammals show, Neurogenin 1 (Ngn1) is important for the determination of glutamatergic phenotypes, but is absent in GABAergic phenotypes (Wullimann and Mueller, 2002; Schuurmans et al., 2004; Nakatani et al., 2007). Both the regulation and function of the zebrafish ortholog ngn1 are largely conserved (Blader et al., 2004). ngn1 is also a determinant of DA differentiation in the zebrafish basal forebrain (Jeong et al., 2006). During zebrafish development, ngn1 is expressed in forebrain regions of mostly glutamatergic neurons, including the region of the posterior tuberculum, but not in the hypothalamus (Mueller and Wullimann, 2003). Therefore, we need to assume that only the vglut2a/b-expressing DA groups of the posterior tuberculum, but not the gad1b/2-expressing ones of the hypothalamus, depend on the activity of ngn1.
In contrast, most DA neurons in the zebrafish forebrain reside in regions defined by the expression of dlx2a and zash1a (ascl1). These regions are the subpallium, the preoptic region, the ventral thalamus, and the hypothalamus (Mueller and Guo, 2009). Orthologs of dlx2a and ascl1 are required for the determination of GABAergic phenotypes, as shown in mammalian (Andrews et al., 2003; Roybon et al., 2010; Virolainen et al., 2012) and zebrafish (Macdonald et al., 2013) systems. Significantly, many DA neurons in the zebrafish forebrain express markers specific for precursor cells developing into GABAergic phenotypes, such as dlx2a and other dlx genes (Filippi et al., 2012).
In addition, we found in the zebrafish prethalamus another prominent cluster of gad1/2-expressing DA neurons that appears to extend into the posterior tuberculum. This cluster has been described as a bipartite structure in the mature brain, one part of which belongs to the prethalamus (group 0) and the other (group 1) to the posterior tuberculum, i.e., the periventricular posterior tubercular nucleus (TPp) (Rink and Wullimann, 2002). Furthermore, Wullimann and Rink (2001) showed that the prethalamic group (0) is intermingled with Pax6-expressing cells during development, whereas group 1, which they interpreted as belonging to the posterior tuberculum, lacks expression of Pax6, and only neurons of this latter region project to the subpallium. However, our recent and previous results demonstrate that these two populations of dopaminergic neurons express gad1b/2 and are developmentally defined by similar sets of molecular markers (Filippi et al., ,). Our results thus support the hypothesis that these neurons derive from the prethalamus and that they topologically correspond to DA neurons found in the mammalian prethalamus (zona incerta, A13; Filippi et al., ,).
Our finding that most DA neurons in the zebrafish brain also express markers for a GABAergic phenotype conforms with studies on various vertebrates including lampreys, amphibians, and mammals (Kosaka et al., 1987; de Rijk et al., 1992; Barreiro-Iglesias et al., 2009). GABAergic phenotypes have been shown specifically for DA groups in the olfactory bulb (A16; Mugnaini et al., 1984; Kosaka et al., 1985; Parrish-Aungst et al., 2007; Maher and Westbrook, 2008), in the hypothalamus (A12; Everitt et al., 1984; Meister and Hökfelt, 1988; Schimchowitsch et al., 1991), the zona incerta of the prethalamus (A13; Oertel et al., 1982), and the amacrine cell layer of the retina (A17; Wässle and Chun, 1988). Whereas spinal DA neurons have not been observed in zebrafish, in lamprey and elasmobranch liquor-contacting spinal DA neurons colocalization of DA and GABA or GAD and TH have been shown (Sueiro et al., 2004; Rodicio et al., 2008). Kosaka and colleagues (1987), however, did not find an overlap of GAD and TH in the far-projecting DA neurons of diencephalic A11 and mesodiencephalic A8–A10 groups, except for some neurons of the A10 group. These results are in line with our observations in zebrafish, in which the only diencephalic groups that do not express gad belong to the Otp-dependent A11-like groups.
We did not detect any coexpression of gad and TH in the amacrine cell layer of the larval retina of zebrafish, which is consistent with previous findings in adult zebrafish (Arenzana et al., 2006) and other teleosts (Wulle and Wagner, 1990; Candal et al., 2008). However, Huang and Moody (1998) colleges report that GABA and dopamine are coexpressed only transiently in the Xenopus tadpole. In contrast, in amniotes including reptiles, birds, and mammals, coexpression of TH and GABAergic markers in the inner nuclear layer of the retina is common (Kosaka et al., 1987; Wässle and Chun, 1988; Wulle and Wagner, 1990; Andrade da Costa and Hokoç, 2003). Perhaps the dual GABA/DA phenotype regresses during the development of anamniotes, as this observation suggests, whereas it remains present in amniotes also in the mature brain. Our study focused on 4-day-old larval zebrafish. This developmental stage may be too progressed to observe a similar coexpression. Additional studies need to investigate whether Gad/GABA and TH in the fish retina are coexpressed transiently as is the case in other vertebrates.
The main mammalian DA systems absent in zebrafish are the mesdiencephalic A8–A10 systems. There is strong evidence that a subset of these DA groups including VTA neurons also uses glutamatergic transmission (Sulzer et al., 1998; Hnasko et al., 2010) and that dual transmission is significant for physiological function (Chuhma et al., 2009; Stuber et al., 2010; Koos et al., 2011) as well as development (Fortin et al., 2012). Although this midbrain population of DA neurons with ascending striatal projections is absent in zebrafish (for a different view, see Wullimann, 2011), we note that the A11 DA neurons in zebrafish, which provide ascending projections to the subpallium/striatum (Rink and Wullimann, 2001; Tay et al., 2011), also have a glutamatergic dual transmitter phenotype. Thus, at least with regard to transmitter systems, the A11 Otp-dependent DA neurons in zebrafish may be equipped to elicit similar responses in the striatum as in the mammalian nigrostriatal system. Whether posterior tubercular–striatal DA circuits in zebrafish are organized and function similar to mammalian nigrostriatal circuits, as has been suggested for lamprey (Ericsson et al., 2013), remains to be determined. Interestingly, glutamatergic cotransmission is also present in both the mammalian A11 and nigrostriatal systems (Kawano et al., 2006).
To conclude, our study demonstrates that most DA and noradrenergic neurons in the zebrafish brain are dual transmitter types that express either GABA or glutamate. This finding, together with similar works on lamprey, amphibians, and mammals, supports the hypothesis that DA neurons with dual transmitter phenotype evolved in the earliest vertebrates. The pattern of gad1b/2- and vglut2a/b-expressing DA and noradrenergic neurons is consistent between 4-dpf larvae and 30-dpf juveniles. Therefore, this pattern likely remains stable into adulthood, similar to the situation reported for lampreys and mammals. Our study thus provides a solid foundation for physiological studies of GABA and glutamate cotransmitters in DA systems. In particular, the vglut2a/b-expressing A11-type DA neurons of the posterior tuberculum in zebrafish are promising candidates to examine the role of glutamate for the development and function of these important and far-projecting neurons. Similarly, the DA neurons of the hypothalamic and preoptic regions will allow investigation of the physiological significance of the cotransmitter GABA in dual transmission in these conserved parts of the brain.
Acknowledgments
We thank Meta Rath, Martha Manoli, and Eva Carl for discussions and comments on the manuscript, the zebrafish community for sharing reagents, and Sabine Götter for excellent zebrafish care.
Abbreviations
- AC
amacrine cells of the retina
- aHyp
anterior hypothalamus
- Ce
cerebellum
- D
diencephalon
- DA
dopaminergic
- dpf
days post fertilization
- Hc
caudal zone of periventricular hypothalamus
- Hd
dorsal zone of periventricular hypothalamus
- LC
locus coeruleus
- LR
lateral recess of diencephalic ventricle
- M
mesencephalon
- MO
medulla oblongata
- OB
olfactory bulb
- pHyp
posterior hypothalamus
- PM
magnocellular preoptic nucleus
- PO
preoptic group
- PPp
parvocellular preoptic nucleus, posterior part
- Pr
pretectal group
- PR
posterior recess of diencephalic ventricle
- PT
posterior tuberculum
- PTN
posterior tuberal nucleus
- PVO
paraventricular organ
- SC
suprachiasmatic nucleus
- SP
subpallium /subpallial DA group
- R
rhombencephalon
- T
telencephalon
- Td
dorsal telencephalic area
- Tv
ventral telencephalic area
- Th
thalamus
- TL
torus longitudinalis
- vDC
ventral diencephalic groups
- VL
ventrolateral thalamic nucleus
CONFLICT OF INTEREST STATEMENT
The authors declare that they have no conflict of interest.
ROLE OF AUTHORS
All authors had full access to all the data in the study and take responsibility for the integrity of the data and the accuracy of the data analysis. Study concept and design: AF, WD. Acquisition of data: AF. Analysis and interpretation of data: AF, TM, WD. Drafting of the manuscript: AF, TM. Critical revision of the manuscript for important intellectual content: WD. Obtained funding: WD. Study supervision: WD.
Supporting Information
Additional Supporting Information may be found in the online version of this article.
Supporting Information Figure S1 Expression of GABAergic markers gad1b/2 in relation to TH immunoreactivity at 96 hpf. A: Schematic lateral (top) and dorsal (bottom) views of the zebrafish larval brain showing the distribution of catecholaminergic groups detectable by immunohistochemistry at 4 dpf (modified from Tay et al., 2011). B1: Lateral overview of a larval brain immunostained for TH (magenta), showing the distribution of DA neurons in the olfactory bulb (OB), subpallium (SP), preoptic area (PO), pretectum (Pr), prethalamus (group 1), posterior tuberculum / medial hypothalamus (altogether labeled here vDC and comprising DA groups 2-6), and posterior hypothalamus (group 7), as well as the noradrenergic group in the locus coeruleus (LC). B2 displays the same image and indicates the dorsoventral level of the confocal planes shown in C-J. C-J: Fluorescent in situ hybridization to gad1b(C,D,F,H,J, green) or gad2 (E,G,I, green) combined with anti-TH immunofluorescence (magenta). Left panels (C-J) show overviews of dorsal views for planes encompassing different TH-ir clusters. Right panels (C1-C3 through J2) show enlargements of the areas framed by white boxes in the overviews. Double labeling revealed that the majority of DA groups expressed both gadisoforms, which had mostly overlapping expression patterns. gad expression and TH immunoreactivity were co-detected for the pretectal group (Pr; C-C3), the prethalamic group (group 1; E-E2), the telencephalic groups (SP and OB; F-F2 and H-H2, respectively), and the preoptic group (PO; J center, J1-J2). The noradrenergic neurons of the locus coeruleus expressed only gad1b (D-D3, arrowheads), although not all of them did so (arrows in D1-D3). The liquor-contacting neurons in the medial hypothalamus (group 3; G-G3) and a subset in the posterior hypothalamus (group 7; I-I3) appear to weakly express only gad2. The arrowheads point at a gad2-expressing DA neuron, whereas a cell immunoreactive for TH but apparently free from gad2 expression is indicated by arrows. Neither gad1b nor gad2 expression could be detected in the posterior tubercular Otp-dependent groups 2,4-6 (E-E2, G-G3). All images in C-J2 are confocal z-projections (5-20 μm depth), except for those in G1-G3, and those top and bottom parts of J, which are separated by white lines and display the retina section, in single confocal planes only. For abbreviations see list. Scale bars = 50 μm.
Supporting Information Figure S2 Expression of the glutamatergic marker vglut2 in relation to TH immunoreactivity at 96 hpf. A: Schematic lateral (top) and dorsal (bottom) views of the zebrafish larval brain showing the distribution of catecholaminergic groups detectable by immunohistochemistry at 4 dpf (modified from Tay et al., 2011). B1 and B2: overviews indicating planes of histological sections (for details see Figure 1B1-B2). C-J: Fluorescent in situ hybridization to vglut2(green) combined with anti-TH immunofluorescence (magenta). Left panels (C-J) show overviews of dorsal views for planes encompassing different TH-ir clusters. Right panels (D1-D3 through J2) show enlargements of the areas framed by white boxes in the overviews. The only groups which appear to express vglut2 are the Otp-dependent groups 2,4-6 in the posterior tuberculum / hypothalamus (E-E2, G-G2). The pretectal group (C), the prethalamic group 1 (E-E2), the hypothalamic groups 3 and 7 (G-G2, I-I2), and the preoptic group (J-J2) do not expressvglut2. The noradrenergic neurons of the locus coeruleus (D-D3) are intermingled with vglut2-expressing cells, but they do not appear to express vglut2. The telencephalic groups in the olfactory bulb and in the subpallium (F-F2 and H-H2, respectively) do not express vglut2but are located in areas adjacent to vglut2-expressing neurons. All images in C-J are 4-13 μm confocal z-projections, except for those in D1-D3, which show a single confocal plane. For abbreviations see list. Scale bars = 50 μm.
Supporting Information Figure S3 Localization of gad1b/2- or vglut2- expressing cells and TH-ir neurons in the telencephalon of the juvenile brain. A: Lateral overview of a juvenile brain stained for th by in situ hybridization (image taken from Filippi et al., 2010), which serves as anatomical reference to indicate the levels of the sections shown in B-G. B-G: Fluorescent in situ hybridization to detect gad1b/2 (C,F; green) or vglut2 (D,G; green) expression combined with anti-TH immunofluorescence (magenta). In each row, the image at the left shows an overview of the considered section and displays only TH immunostaining. Higher magnified views of the approximate area framed by the white square are shown to the right, together with either gad1b/2 (C,F) or vglut2 (D,G) staining. All images are 6–10 μm confocal z-projections of areas comprising THir cells in the olfactory bulb (OB; B-D) and in the subpallium (SP; E-G). All telencephalic THir neurons express gad1b/2 (C,F) but not vglut2 (D,G), indicating that they are GABAergic. To better display the co-localization of the markers, C1-C3 and F1-F3 show the individual channels of the areas framed in C and F, respectively. For abbreviations see list. Scale bars = 50 μm.
Supporting Information Figure S4 Localization of gad1b/2- or vglut2- expressing cells and TH-ir neurons in the anterior diencephalon of the juvenile brain. A: Overview of section planes shown in B-M (for details see Fig 3A legend). B-M: Fluorescent in situ hybridization to detect gad1b/2 (C,F,I,L; green) or vglut2 (D,G,J,M; green) expression combined with anti-TH immunofluorescence (magenta). The DA clusters in the magnocellular preoptic nucleus (PM; B-D), in the prethalamus and suprachiasmatic nucleus (VL, SC; E-G), in the pretectum (Pr; H-J), and in the posterior tuberculum (PT; K-M) are reported in this figure. In each row, the image at the left shows an overview of the considered section and displays only TH immunostaining. The pretectal, prethalamic and suprachiasmatic clusters are comprised in the same overview, shown twice in E and H. Higher magnified views of the approximate area framed by the white square in the overviews are shown at their right, together with either gad1b/2 (C,F,I,L) or vglut2 (D,G,J,M) staining. The majority of the images are 4–15 μm confocal z-projections, except for C1-C3, G, and I1-I3, which are single planes. All DA clusters considered in this figure are also GABAergic, as demonstrated by co-expression of TH with gad1b/2, but not with vglut2. The only exception is represented by the suprachiasmatic nucleus, in which some DA neurons express gad1b/2 (arrowhead in F1-F3) and some do not (arrow in F1-F3). For abbreviations see list. Scale bars = 50 μm.
Supporting Information Figure S5 Localization of gad1b/2 or vglut2 expression and TH immunoreactivity in Otp-dependent DA neurons of the juvenile brain. A: Overview of section planes shown in B-J (for details see Fig 3A legend). B-J: Fluorescent in situ hybridization to detect gad1b/2 (C,F,I; green) or vglut2 (D,G,J; green) expression combined with anti-TH immunofluorescence (magenta). The posterior tubercular and hypothalamic Otp-dependent DA neurons are shown in this figure. The overviews in B,E,H are 2-10 μm confocal z-projections encompassing the large pear-shaped DA neurons in the posterior tuberculum (PT; B,E) and the group in the posterior tuberal nucleus (PTN; H). Higher magnified views of the approximate areas framed by the white squares in the overviews are shown at their right, together with either gad1b/2 (C,F,I) or vglut2 (D,G,J) staining (3-16 μm z-projections). All Otp-dependent DA neurons express vglut2 (D,G,J) but not gad1b/2 (C,F,I), indicating that they are also glutamatergic. Individual channels demonstrating co-expression of TH with vglut2 are shown for each group in D1-D3, G1-G3, and J1-J3. For abbreviations see list. Scale bars = 50 μm.
Supporting Information Figure S6 Localization of gad1b/2 or vglut2 expression and TH-immunoreactivity in hypothalamus and hindbrain. A: Overview of section planes shown in B-J (for details see Fig 3A legend). B-J: Fluorescent in situ hybridization to detect gad1b/2 (C,F,I; green) or vglut2 (D,G,J; green) expression coupled with anti-TH immunofluorescence (magenta). The overviews in B,E,H are 5-10 μm confocal z-projections encompassing the hypothalamic groups of liquor-contacting DA neurons located in the paraventricular organ (PVO; B) and in the posterior recess (PR; E), as well as the noradrenergic neurons of the locus coeruleus in the hindbrain (LC; H). All these groups appear to be GABAergic by co-expression of TH with gad1b/2 (C,F,I; 5-8 μm projections), but not with vglut2 (D,G,J; 3-9 μm projections). C1-C3, F1-F3, I1-I3 are single channels enlarged views of the framed areas in C,F,I, respectively. For abbreviations see list. Scale bars = 50 μm.
Supporting Information Figure S7 Localization of gad1b/2 or vglut2 expression and TH immunoreactivity in the medulla oblongata at 30 dpf. A: Overview of section plane shown in B-D (for details see Fig 3A legend). B-D3: Fluorescent in situ hybridization to detect gad1b/2 (C; green) or vglut2 (D; green) expression combined with anti-TH immunofluorescence (magenta). The overview in B is a 10 μm confocal z-projection showing TH-ir noradrenergic neurons of the medulla oblongata (MO) in the hindbrain. These neurons were intermingled but not co-localizing with gad-expressing cells (C; 3 μm projection). Instead, we detected co-expression of TH with vglut2 (D-D3; 6 μm projection). D1-D3 are single channels enlarged views of the framed area in D. The arrowheads point at examples of co-expression. Scale bars = 50 μm.
LITERATURE CITED
- Ahman AK, Wågberg F, Mattsson MO. Two glutamate decarboxylase forms corresponding to the mammalian GAD65 and GAD67 are expressed during development of the chick telencephalon. Eur J Neurosci. 1996;8:2111–2117. doi: 10.1111/j.1460-9568.1996.tb00732.x. [DOI] [PubMed] [Google Scholar]
- Alsio J, Nordenankar K, Arvidsson E, Birgner C, Mahmoudi S, Halbout B, Smith C, Fortin GM, Olson L, Descarries L, Trudeau LE, Kullander K, Levesque D, Wallen-Mackenzie A. Enhanced sucrose and cocaine self-administration and cue-induced drug seeking after loss of VGLUT2 in midbrain dopamine neurons in mice. J Neurosci. 2011;31:12593–12603. doi: 10.1523/JNEUROSCI.2397-11.2011. [DOI] [PMC free article] [PubMed] [Google Scholar]
- Andrade da Costa BLdS, Hokoç JN. Coexistence of GAD-65 and GAD-67 with tyrosine hydroxylase and nitric oxide synthase in amacrine and interplexiform cells of the primate, Cebus apella. Vis Neurosci. 2003;20:153–163. doi: 10.1017/s0952523803202066. [DOI] [PubMed] [Google Scholar]
- Andrews GL, Yun K, Rubenstein JL, Mastick GS. Dlx transcription factors regulate differentiation of dopaminergic neurons of the ventral thalamus. Mol Cell Neurosci. 2003;23:107–120. doi: 10.1016/s1044-7431(03)00016-2. [DOI] [PubMed] [Google Scholar]
- Arenzana FJ, Arévalo R, Sénchez-Gonzélez R, Clemente D, Aijón J, Porteros A. Tyrosine hydroxylase immunoreactivity in the developing visual pathway of the zebrafish. Anat Embryol. 2006;211:323–334. doi: 10.1007/s00429-006-0084-2. [DOI] [PubMed] [Google Scholar]
- Bae YK, Kani S, Shimizu T, Tanabe K, Nojima H, Kimura Y, Higashijima S, Hibi M. Anatomy of zebrafish cerebellum and screen for mutations affecting its development. Dev Biol. 2009;330:406–426. doi: 10.1016/j.ydbio.2009.04.013. [DOI] [PubMed] [Google Scholar]
- Barreiro-Iglesias A, Villar-Cerviño V, Anadón R, Rodicio MC. Dopamine and gamma-aminobutyric acid are colocalized in restricted groups of neurons in the sea lamprey brain: insights into the early evolution of neurotransmitter colocalization in vertebrates. J Anat. 2009;215:601–610. doi: 10.1111/j.1469-7580.2009.01159.x. [DOI] [PMC free article] [PubMed] [Google Scholar]
- Bérubé-Carrière N, Riad M, Dal Bo G, Lévesque D, Trudeau LE, Descarries L. The dual dopamine-glutamate phenotype of growing mesencephalic neurons regresses in mature rat brain. J Comp Neurol. 2009;517:873–891. doi: 10.1002/cne.22194. [DOI] [PubMed] [Google Scholar]
- Björklund A, Dunnett SB. Dopamine neuron systems in the brain: an update. Trends Neurosci. 2007;30:194–202. doi: 10.1016/j.tins.2007.03.006. [DOI] [PubMed] [Google Scholar]
- Blader P, Lam CS, Rastegar S, Scardigli R, Nicod JC, Simplicio N, Plessy C, Fischer N, Schuurmans C, Guillemot F, Strähle U. Conserved and acquired features of neurogenin1 regulation. Development. 2004;131:5627–5637. doi: 10.1242/dev.01455. [DOI] [PubMed] [Google Scholar]
- Borisovska M, Bensen AL, Chong G, Westbrook GL. Distinct modes of dopamine and GABA release in a dual transmitter neuron. J Neurosci. 2013;33:1790–1796. doi: 10.1523/JNEUROSCI.4342-12.2013. [DOI] [PMC free article] [PubMed] [Google Scholar]
- Brill MS, Ninkovic J, Winpenny E, Hodge RD, Ozen I, Yang R, Lepier A, Gascón S, Erdelyi F, Szabo G, Parras C, Guillemot F, Frotscher M, Berninger B, Hevner RF, Raineteau O, Götz M. Adult generation of glutamatergic olfactory bulb interneurons. Nat Neurosci. 2009;12:1524–1533. doi: 10.1038/nn.2416. [DOI] [PMC free article] [PubMed] [Google Scholar]
- Burnstock G. Cotransmission. Curr Opin Pharmacol. 2004;4:47–52. doi: 10.1016/j.coph.2003.08.001. [DOI] [PubMed] [Google Scholar]
- Byrd CA, Brunjes PC. Organization of the olfactory system in the adult zebrafish: histological, immunohistochemical, and quantitative analysis. J Comp Neurol. 1995;358:247–259. doi: 10.1002/cne.903580207. [DOI] [PubMed] [Google Scholar]
- Candal E, Ferreiro-Galve S, Anadón R, Rodríguez-Moldes I. Morphogenesis in the retina of a slow-developing teleost: emergence of the GABAergic system in relation to cell proliferation and differentiation. Brain Res. 2008;1194:21–27. doi: 10.1016/j.brainres.2007.11.065. [DOI] [PubMed] [Google Scholar]
- Candy J, Collet C. Two tyrosine hydroxylase genes in teleosts. Biochim Biophys Acta. 2005;1727:35–44. doi: 10.1016/j.bbaexp.2004.11.005. [DOI] [PubMed] [Google Scholar]
- Chuhma N, Choi WY, Mingote S, Rayport S. Dopamine neuron glutamate cotransmission: frequency-dependent modulation in the mesoventromedial projection. Neuroscience. 2009;164:1068–1083. doi: 10.1016/j.neuroscience.2009.08.057. [DOI] [PMC free article] [PubMed] [Google Scholar]
- Dahlstroem A, Fuxe K. Evidence for the existence of monoamine-containing neurons in the central nervous system. I. Demonstration of monoamines in the cell bodies of brain stem neurons. Acta Physiol Scand Suppl. 1964;232:1–55. [PubMed] [Google Scholar]
- de Rijk EP, van Strien FJ, Roubos EW. Demonstration of coexisting catecholamine (dopamine), amino acid (GABA), and peptide (NPY) involved in inhibition of melanotrope cell activity in Xenopus laevis: a quantitative ultrastructural, freeze-substitution immunocytochemical study. J Neurosci. 1992;12:864–871. doi: 10.1523/JNEUROSCI.12-03-00864.1992. [DOI] [PMC free article] [PubMed] [Google Scholar]
- Descarries L, Berube-Carriere N, Riad M, Bo GD, Mendez JA, Trudeau LE. Glutamate in dopamine neurons: synaptic versus diffuse transmission. Brain Res Rev. 2008;58:290–302. doi: 10.1016/j.brainresrev.2007.10.005. [DOI] [PubMed] [Google Scholar]
- Dupuy ST, Houser CR. Prominent expression of two forms of glutamate decarboxylase in the embryonic and early postnatal rat hippocampal formation. J Neurosci. 1996;16:6919–6932. doi: 10.1523/JNEUROSCI.16-21-06919.1996. [DOI] [PMC free article] [PubMed] [Google Scholar]
- El Mestikawy S, Wallén-Mackenzie A, Fortin GM, Descarries L, Trudeau LE. From glutamate co-release to vesicular synergy: vesicular glutamate transporters. Nat Rev Neurosci. 2011;12:204–216. doi: 10.1038/nrn2969. [DOI] [PubMed] [Google Scholar]
- Ericsson J, Stephenson-Jones M, Perez-Fernandez J, Robertson B, Silberberg G, Grillner S. Dopamine differentially modulates the excitability of striatal neurons of the direct and indirect pathways in lamprey. J Neurosci. 2013;33:8045–8054. doi: 10.1523/JNEUROSCI.5881-12.2013. [DOI] [PMC free article] [PubMed] [Google Scholar]
- Everitt BJ, Hökfelt T, Wu JY, Goldstein M. Coexistence of tyrosine hydroxylase-like and gamma-aminobutyric acid-like immunoreactivities in neurons of the arcuate nucleus. Neuroendocrinology. 1984;39:189–191. doi: 10.1159/000123977. [DOI] [PubMed] [Google Scholar]
- Filippi A, Durr K, Ryu S, Willaredt M, Holzschuh J, Driever W. Expression and function of nr4a2, lmx1b, and pitx3 in zebrafish dopaminergic and noradrenergic neuronal development. BMC Dev Biol. 2007;7:135. doi: 10.1186/1471-213X-7-135. [DOI] [PMC free article] [PubMed] [Google Scholar]
- Filippi A, Mahler J, Schweitzer J, Driever W. Expression of the paralogous tyrosine hydroxylase encoding genes th1 and th2 reveals the full complement of dopaminergic and noradrenergic neurons in zebrafish larval and juvenile brain. J Comp Neurol. 2010;518:423–438. doi: 10.1002/cne.22213. [DOI] [PMC free article] [PubMed] [Google Scholar]
- Filippi A, Jainok C, Driever W. Analysis of transcriptional codes for zebrafish dopaminergic neurons reveals essential functions of Arx and Isl1 in prethalamic dopaminergic neuron development. Dev Biol. 2012;369:133–149. doi: 10.1016/j.ydbio.2012.06.010. [DOI] [PubMed] [Google Scholar]
- Fortin GM, Bourque MJ, Mendez JA, Leo D, Nordenankar K, Birgner C, Arvidsson E, Rymar VV, Bérubé-Carrière N, Claveau AM, Descarries L, Sadikot AF, Wallén-Mackenzie A, Trudeau LE. Glutamate corelease promotes growth and survival of midbrain dopamine neurons. J Neurosci. 2012;32:17477–17491. doi: 10.1523/JNEUROSCI.1939-12.2012. [DOI] [PMC free article] [PubMed] [Google Scholar]
- Gutièrrez R, Romo-Parra H, Maqueda J, Vivar C, Ramirez M, Morales MA, Lamas M. Plasticity of the GABAergic phenotype of the “glutamatergic” granule cells of the rat dentate gyrus. J Neurosci. 2003;23:5594–5598. doi: 10.1523/JNEUROSCI.23-13-05594.2003. [DOI] [PMC free article] [PubMed] [Google Scholar]
- Hauptmann G, Gerster T. Two-color whole-mount in situ hybridization to vertebrate and Drosophila embryos. Trends Genet. 1994;10:266. doi: 10.1016/0168-9525(90)90008-t. [DOI] [PubMed] [Google Scholar]
- Higashijima S-I, Mandel G, Fetcho JR. Distribution of prospective glutamatergic, glycinergic, and GABAergic neurons in embryonic and larval zebrafish. J Comp Neurol. 2004;480:1–18. doi: 10.1002/cne.20278. [DOI] [PubMed] [Google Scholar]
- Hirasawa H, Betensky RA, Raviola E. Corelease of dopamine and GABA by a retinal dopaminergic neuron. J Neurosci. 2012;32:13281–13291. doi: 10.1523/JNEUROSCI.2213-12.2012. [DOI] [PMC free article] [PubMed] [Google Scholar]
- Hnasko TS, Edwards RH. Neurotransmitter corelease: mechanism and physiological role. Annu Rev Physiol. 2012;74:225–243. doi: 10.1146/annurev-physiol-020911-153315. [DOI] [PMC free article] [PubMed] [Google Scholar]
- Hnasko TS, Chuhma N, Zhang H, Goh GY, Sulzer D, Palmiter RD, Rayport S, Edwards RH. Vesicular glutamate transport promotes dopamine storage and glutamate corelease in vivo. Neuron. 2010;65:643–656. doi: 10.1016/j.neuron.2010.02.012. [DOI] [PMC free article] [PubMed] [Google Scholar]
- Hökfelt T, Märtensson R, Björklund A, Kleinau S, Goldstein M. Distributional maps of tyrosine-hydroxylase immunoreactive neurons in the rat brain. In: Kuhar MJ, editor. Handbook of chemical neuroanatomy. Vol. 2. Amsterdam: Elsevier; 1984. pp. 227–379. [Google Scholar]
- Holzschuh J, Ryu S, Aberger F, Driever W. Dopamine transporter expression distinguishes dopaminergic neurons from other catecholaminergic neurons in the developing zebrafish embryo. Mech Dev. 2001;101:237–243. doi: 10.1016/s0925-4773(01)00287-8. [DOI] [PubMed] [Google Scholar]
- Huang S, Moody SA. Dual expression of GABA or serotonin and dopamine in Xenopus amacrine cells is transient and may be regulated by laminar cues. Vis Neurosci. 1998;15:969–977. doi: 10.1017/s0952523898155153. [DOI] [PubMed] [Google Scholar]
- Iijima K, Sato M, Kojima N, Ohtomo K. Immunocytochemical and in situ hybridization evidence for the coexistence of GABA and tyrosine hydroxylase in the rat locus ceruleus. Anat Rec. 1992;234:593–604. doi: 10.1002/ar.1092340415. [DOI] [PubMed] [Google Scholar]
- Jeong JY, Einhorn Z, Mercurio S, Lee S, Lau B, Mione M, Wilson SW, Guo S. Neurogenin1 is a determinant of zebrafish basal forebrain dopaminergic neurons and is regulated by the conserved zinc finger protein Tof/Fezl. Proc Natl Acad Sci U S A. 2006;103:5143–5148. doi: 10.1073/pnas.0600337103. [DOI] [PMC free article] [PubMed] [Google Scholar]
- Julien JF, Samama P, Mallet J. Rat brain glutamic acid decarboxylase sequence deduced from a cloned cDNA. J Neurochem. 1990;54:703–705. doi: 10.1111/j.1471-4159.1990.tb01928.x. [DOI] [PubMed] [Google Scholar]
- Kaslin J, Panula P. Comparative anatomy of the histaminergic and other aminergic systems in zebrafish (Danio rerio) J Comp Neurol. 2001;440:342–377. doi: 10.1002/cne.1390. [DOI] [PubMed] [Google Scholar]
- Kawano M, Kawasaki A, Sakata-Haga H, Fukui Y, Kawano H, Nogami H, Hisano S. Particular subpopulations of midbrain and hypothalamic dopamine neurons express vesicular glutamate transporter 2 in the rat brain. J Comp Neurol. 2006;498:581–592. doi: 10.1002/cne.21054. [DOI] [PubMed] [Google Scholar]
- Koos T, Tecuapetla F, Tepper JM. Glutamatergic signaling by midbrain dopaminergic neurons: recent insights from optogenetic, molecular and behavioral studies. Curr Opin Neurobiol. 2011;21:393–401. doi: 10.1016/j.conb.2011.05.010. [DOI] [PMC free article] [PubMed] [Google Scholar]
- Kosaka T, Hataguchi Y, Hama K, Nagatsu I, Wu JY. Coexistence of immunoreactivities for glutamate decarboxylase and tyrosine hydroxylase in some neurons in the periglomerular region of the rat main olfactory bulb: possible coexistence of gamma-aminobutyric acid (GABA) and dopamine. Brain Res. 1985;343:166–171. doi: 10.1016/0006-8993(85)91172-2. [DOI] [PubMed] [Google Scholar]
- Kosaka T, Kosaka K, Hataguchi Y, Nagatsu I, Wu JY, Ottersen OP, Storm-Mathisen J, Hama K. Catecholaminergic neurons containing GABA-like and/or glutamic acid decarboxylase-like immunoreactivities in various brain regions of the rat. Exp Brain Res. 1987;66:191–210. doi: 10.1007/BF00236215. [DOI] [PubMed] [Google Scholar]
- Ma PM. Catecholaminergic systems in the zebrafish. IV. Organization and projection pattern of dopaminergic neurons in the diencephalon. J Comp Neurol. 2003;460:13–37. doi: 10.1002/cne.10544. [DOI] [PubMed] [Google Scholar]
- Macdonald RB, Pollack JN, Debiais-Thibaud M, Heude E, Coffin TJ, Ekker M. The ascl1a and dlx genes have a regulatory role in the development of GABAergic interneurons in the zebrafish diencephalon. Dev Biol. 2013;381:276–285. doi: 10.1016/j.ydbio.2013.05.025. [DOI] [PMC free article] [PubMed] [Google Scholar]
- Maher BJ, Westbrook GL. Co-transmission of dopamine and GABA in periglomerular cells. J Neurophysiol. 2008;99:1559–1564. doi: 10.1152/jn.00636.2007. [DOI] [PubMed] [Google Scholar]
- Martin SC, Heinrich G, Sandell JH. Sequence and expression of glutamic acid decarboxylase isoforms in the developing zebrafish. J Comp Neurol. 1998;396:253–266. [PubMed] [Google Scholar]
- McLean DL, Fetcho JR. Ontogeny and innervation patterns of dopaminergic, noradrenergic, and serotonergic neurons in larval zebrafish. J Comp Neurol. 2004a;480:38–56. doi: 10.1002/cne.20280. [DOI] [PubMed] [Google Scholar]
- McLean DL, Fetcho JR. Relationship of tyrosine hydroxylase and serotonin immunoreactivity to sensorimotor circuitry in larval zebrafish. J Comp Neurol. 2004b;480:57–71. doi: 10.1002/cne.20281. [DOI] [PubMed] [Google Scholar]
- Meister B, Hökfelt T. Peptide- and transmitter-containing neurons in the mediobasal hypothalamus and their relation to GABAergic systems: possible roles in control of prolactin and growth hormone secretion. Synapse. 1988;2:585–605. doi: 10.1002/syn.890020604. [DOI] [PubMed] [Google Scholar]
- Moore RY, Bloom FE. Central catecholamine neuron systems: anatomy and physiology of the norepinephrine and epinephrine systems. Annu Rev Neurosci. 1979;2:113–168. doi: 10.1146/annurev.ne.02.030179.000553. [DOI] [PubMed] [Google Scholar]
- Moss J, Ungless MA, Bolam JP. Dopaminergic axons in different divisions of the adult rat striatal complex do not express vesicular glutamate transporters. Eur J Neurosci. 2011;33:1205–1211. doi: 10.1111/j.1460-9568.2011.07594.x. [DOI] [PubMed] [Google Scholar]
- Mueller T, Guo S. The distribution of GAD67-mRNA in the adult zebrafish (teleost) forebrain reveals a prosomeric pattern and suggests previously unidentified homologies to tetrapods. J Comp Neurol. 2009;516:553–568. doi: 10.1002/cne.22122. [DOI] [PMC free article] [PubMed] [Google Scholar]
- Mueller T, Wullimann MF. Anatomy of neurogenesis in the early zebrafish brain. Brain Res Dev Brain Res. 2003;140:137–155. doi: 10.1016/s0165-3806(02)00583-7. [DOI] [PubMed] [Google Scholar]
- Mugnaini E, Oertel WH, Wouterlood FF. Immunocytochemical localization of GABA neurons and dopamine neurons in the rat main and accessory olfactory bulbs. Neurosci Lett. 1984;47:221–226. doi: 10.1016/0304-3940(84)90517-2. [DOI] [PubMed] [Google Scholar]
- Nakatani T, Minaki Y, Kumai M, Ono Y. Helt determines GABAergic over glutamatergic neuronal fate by repressing Ngn genes in the developing mesencephalon. Development. 2007;134:2783–2793. doi: 10.1242/dev.02870. [DOI] [PubMed] [Google Scholar]
- Oertel WH, Tappaz ML, Berod A, Mugnaini E. Two-color immunohistochemistry for dopamine and GABA neurons in rat substantia nigra and zona incerta. Brain Res Bull. 1982;9:463–474. doi: 10.1016/0361-9230(82)90155-1. [DOI] [PubMed] [Google Scholar]
- Panula P, Chen YC, Priyadarshini M, Kudo H, Semenova S, Sundvik M, Sallinen V. The comparative neuroanatomy and neurochemistry of zebrafish CNS systems of relevance to human neuropsychiatric diseases. Neurobiol Dis. 2010;40:46–57. doi: 10.1016/j.nbd.2010.05.010. [DOI] [PubMed] [Google Scholar]
- Parrish-Aungst S, Shipley MT, Erdelyi F, Szabo G, Puche AC. Quantitative analysis of neuronal diversity in the mouse olfactory bulb. J Comp Neurol. 2007;501:825–836. doi: 10.1002/cne.21205. [DOI] [PubMed] [Google Scholar]
- Puelles L, Verney C. Early neuromeric distribution of tyrosine-hydroxylase-immunoreactive neurons in human embryos. J Comp Neurol. 1998;394:283–308. doi: 10.1002/(sici)1096-9861(19980511)394:3<283::aid-cne2>3.0.co;2-y. [DOI] [PubMed] [Google Scholar]
- Ren G, Li S, Zhong H, Lin S. Zebrafish tyrosine hydroxylase 2 gene encodes tryptophan hydroxylase. J Biol Chem. 2013;288:22451–22459. doi: 10.1074/jbc.M113.485227. [DOI] [PMC free article] [PubMed] [Google Scholar]
- Rink E, Wullimann MF. The teleostean (zebrafish) dopaminergic system ascending to the subpallium (striatum) is located in the basal diencephalon (posterior tuberculum) Brain Res. 2001;889:316–330. doi: 10.1016/s0006-8993(00)03174-7. [DOI] [PubMed] [Google Scholar]
- Rink E, Wullimann MF. Development of the catecholaminergic system in the early zebrafish brain: an immunohistochemical study. Brain Res Dev Brain Res. 2002;137:89–100. doi: 10.1016/s0165-3806(02)00354-1. [DOI] [PubMed] [Google Scholar]
- Rodicio MC, Villar-Cerviño V, Barreiro-Iglesias A, Anadón R. Colocalization of dopamine and GABA in spinal cord neurones in the sea lamprey. Brain Res Bull. 2008;76:45–49. doi: 10.1016/j.brainresbull.2007.10.062. [DOI] [PubMed] [Google Scholar]
- Roybon L, Mastracci TL, Ribeiro D, Sussel L, Brundin P, Li JY. GABAergic differentiation induced by Mash1 is compromised by the bHLH proteins Neurogenin2, NeuroD1, and NeuroD2. Cereb Cortex. 2010;20:1234–1244. doi: 10.1093/cercor/bhp187. [DOI] [PubMed] [Google Scholar]
- Ryu S, Mahler J, Acampora D, Holzschuh J, Erhardt S, Omodei D, Simeone A, Driever W. Orthopedia homeodomain protein is essential for diencephalic dopaminergic neuron development. Curr Biol. 2007;17:873–880. doi: 10.1016/j.cub.2007.04.003. [DOI] [PubMed] [Google Scholar]
- Schimchowitsch S, Vuillez P, Tappaz ML, Klein MJ, Stoeckel ME. Systematic presence of GABA-immunoreactivity in the tubero-infundibular and tubero-hypophyseal dopaminergic axonal systems: an ultrastructural immunogold study on several mammals. Exp Brain Res. 1991;83:575–586. doi: 10.1007/BF00229836. [DOI] [PubMed] [Google Scholar]
- Scholpp S, Delogu A, Gilthorpe J, Peukert D, Schindler S, Lumsden A. Her6 regulates the neurogenetic gradient and neuronal identity in the thalamus. Proc Natl Acad Sci U S A. 2009;106:19895–19900. doi: 10.1073/pnas.0910894106. [DOI] [PMC free article] [PubMed] [Google Scholar]
- Schuurmans C, Armant O, Nieto M, Stenman JM, Britz O, Klenin N, Brown C, Langevin LM, Seibt J, Tang H, Cunningham JM, Dyck R, Walsh C, Campbell K, Polleux F, Guillemot F. Sequential phases of cortical specification involve Neurogenin-dependent and -independent pathways. EMBO J. 2004;23:2892–2902. doi: 10.1038/sj.emboj.7600278. [DOI] [PMC free article] [PubMed] [Google Scholar]
- Seal RP, Edwards RH. Functional implications of neurotransmitter co-release: glutamate and GABA share the load. Curr Opin Pharmacol. 2006;6:114–119. doi: 10.1016/j.coph.2005.12.001. [DOI] [PubMed] [Google Scholar]
- Stornetta RL, Sevigny CP, Guyenet PG. Vesicular glutamate transporter DNPI/VGLUT2 mRNA is present in C1 and several other groups of brainstem catecholaminergic neurons. J Comp Neurol. 2002;444:191–206. doi: 10.1002/cne.10141. [DOI] [PubMed] [Google Scholar]
- Stuber GD, Hnasko TS, Britt JP, Edwards RH, Bonci A. Dopaminergic terminals in the nucleus accumbens but not the dorsal striatum corelease glutamate. J Neurosci. 2010;30:8229–8233. doi: 10.1523/JNEUROSCI.1754-10.2010. [DOI] [PMC free article] [PubMed] [Google Scholar]
- Sueiro C, Carrera I. Rodríguez-Moldes I, Anadón R. Distribution and development of glutamic acid decarboxylase immunoreactivity in the spinal cord of the dogfish Scyliorhinus canicula (elasmobranchs) J Comp Neurol. 2004;478:189–206. doi: 10.1002/cne.20285. , P. M, [DOI] [PubMed] [Google Scholar]
- Sulzer D, Joyce MP, Lin L, Geldwert D, Haber SN, Hattori T, Rayport S. Dopamine neurons make glutamatergic synapses in vitro. J Neurosci. 1998;18:4588–4602. doi: 10.1523/JNEUROSCI.18-12-04588.1998. [DOI] [PMC free article] [PubMed] [Google Scholar]
- Tay TL, Ronneberger O, Ryu S, Nitschke R, Driever W. Comprehensive catecholaminergic projectome analysis reveals single-neuron integration of zebrafish ascending and descending dopaminergic systems. Nat Commun. 2011;2:171. doi: 10.1038/ncomms1171. [DOI] [PMC free article] [PubMed] [Google Scholar]
- Trudeau LE. Glutamate co-transmission as an emerging concept in monoamine neuron function. J Psychiatry Neurosci. 2004;29:296–310. [PMC free article] [PubMed] [Google Scholar]
- Virolainen SM, Achim K, Peltopuro P, Salminen M, Partanen J. Transcriptional regulatory mechanisms underlying the GABAergic neuron fate in different diencephalic prosomeres. Development. 2012;139:3795–3805. doi: 10.1242/dev.075192. [DOI] [PubMed] [Google Scholar]
- Wässle H, Chun MH. Dopaminergic and indoleamine-accumulating amacrine cells express GABA-like immunoreactivity in the cat retina. J Neurosci. 1988;8:3383–3394. doi: 10.1523/JNEUROSCI.08-09-03383.1988. [DOI] [PMC free article] [PubMed] [Google Scholar]
- Westerfield M. The zebrafish book: a guide to the laboratory use of zebrafish. Eugene, OR: University of Oregon Institute of Neurosciences; 2000. [Google Scholar]
- Wulle I, Wagner HJ. GABA and tyrosine hydroxylase immunocytochemistry reveal different patterns of colocalization in retinal neurons of various vertebrates. J Comp Neurol. 1990;296:173–178. doi: 10.1002/cne.902960111. [DOI] [PubMed] [Google Scholar]
- Wullimann MF. Basal ganglia: insights into origins from lamprey brains. Curr Biol. 2011;21:R497–R500. doi: 10.1016/j.cub.2011.05.052. [DOI] [PubMed] [Google Scholar]
- Wullimann MF, Mueller T. Expression of Zash-1a in the postembryonic zebrafish brain allows comparison to mouse Mash1 domains. Brain Res Gene Expr Patterns. 2002;1:187–192. doi: 10.1016/s1567-133x(02)00016-9. [DOI] [PubMed] [Google Scholar]
- Wullimann MF, Rink E. Detailed immunohistology of Pax6 protein and tyrosine hydroxylase in the early zebrafish brain suggests role of Pax6 gene in development of dopaminergic diencephalic neurons. Brain Res Dev Brain Res. 2001;131:173–191. doi: 10.1016/s0165-3806(01)00270-x. [DOI] [PubMed] [Google Scholar]
- Yamamoto K, Vernier P. The evolution of dopamine systems in chordates. Front Neuroanat. 2011;5:21. doi: 10.3389/fnana.2011.00021. [DOI] [PMC free article] [PubMed] [Google Scholar]
- Yamamoto K, Ruuskanen JO, Wullimann MF, Vernier P. Two tyrosine hydroxylase genes in vertebrates: new dopaminergic territories revealed in the zebrafish brain. Mol Cell Neurosci. 2010;43:394–402. doi: 10.1016/j.mcn.2010.01.006. [DOI] [PubMed] [Google Scholar]
Associated Data
This section collects any data citations, data availability statements, or supplementary materials included in this article.
Supplementary Materials
Supporting Information Figure S1 Expression of GABAergic markers gad1b/2 in relation to TH immunoreactivity at 96 hpf. A: Schematic lateral (top) and dorsal (bottom) views of the zebrafish larval brain showing the distribution of catecholaminergic groups detectable by immunohistochemistry at 4 dpf (modified from Tay et al., 2011). B1: Lateral overview of a larval brain immunostained for TH (magenta), showing the distribution of DA neurons in the olfactory bulb (OB), subpallium (SP), preoptic area (PO), pretectum (Pr), prethalamus (group 1), posterior tuberculum / medial hypothalamus (altogether labeled here vDC and comprising DA groups 2-6), and posterior hypothalamus (group 7), as well as the noradrenergic group in the locus coeruleus (LC). B2 displays the same image and indicates the dorsoventral level of the confocal planes shown in C-J. C-J: Fluorescent in situ hybridization to gad1b(C,D,F,H,J, green) or gad2 (E,G,I, green) combined with anti-TH immunofluorescence (magenta). Left panels (C-J) show overviews of dorsal views for planes encompassing different TH-ir clusters. Right panels (C1-C3 through J2) show enlargements of the areas framed by white boxes in the overviews. Double labeling revealed that the majority of DA groups expressed both gadisoforms, which had mostly overlapping expression patterns. gad expression and TH immunoreactivity were co-detected for the pretectal group (Pr; C-C3), the prethalamic group (group 1; E-E2), the telencephalic groups (SP and OB; F-F2 and H-H2, respectively), and the preoptic group (PO; J center, J1-J2). The noradrenergic neurons of the locus coeruleus expressed only gad1b (D-D3, arrowheads), although not all of them did so (arrows in D1-D3). The liquor-contacting neurons in the medial hypothalamus (group 3; G-G3) and a subset in the posterior hypothalamus (group 7; I-I3) appear to weakly express only gad2. The arrowheads point at a gad2-expressing DA neuron, whereas a cell immunoreactive for TH but apparently free from gad2 expression is indicated by arrows. Neither gad1b nor gad2 expression could be detected in the posterior tubercular Otp-dependent groups 2,4-6 (E-E2, G-G3). All images in C-J2 are confocal z-projections (5-20 μm depth), except for those in G1-G3, and those top and bottom parts of J, which are separated by white lines and display the retina section, in single confocal planes only. For abbreviations see list. Scale bars = 50 μm.
Supporting Information Figure S2 Expression of the glutamatergic marker vglut2 in relation to TH immunoreactivity at 96 hpf. A: Schematic lateral (top) and dorsal (bottom) views of the zebrafish larval brain showing the distribution of catecholaminergic groups detectable by immunohistochemistry at 4 dpf (modified from Tay et al., 2011). B1 and B2: overviews indicating planes of histological sections (for details see Figure 1B1-B2). C-J: Fluorescent in situ hybridization to vglut2(green) combined with anti-TH immunofluorescence (magenta). Left panels (C-J) show overviews of dorsal views for planes encompassing different TH-ir clusters. Right panels (D1-D3 through J2) show enlargements of the areas framed by white boxes in the overviews. The only groups which appear to express vglut2 are the Otp-dependent groups 2,4-6 in the posterior tuberculum / hypothalamus (E-E2, G-G2). The pretectal group (C), the prethalamic group 1 (E-E2), the hypothalamic groups 3 and 7 (G-G2, I-I2), and the preoptic group (J-J2) do not expressvglut2. The noradrenergic neurons of the locus coeruleus (D-D3) are intermingled with vglut2-expressing cells, but they do not appear to express vglut2. The telencephalic groups in the olfactory bulb and in the subpallium (F-F2 and H-H2, respectively) do not express vglut2but are located in areas adjacent to vglut2-expressing neurons. All images in C-J are 4-13 μm confocal z-projections, except for those in D1-D3, which show a single confocal plane. For abbreviations see list. Scale bars = 50 μm.
Supporting Information Figure S3 Localization of gad1b/2- or vglut2- expressing cells and TH-ir neurons in the telencephalon of the juvenile brain. A: Lateral overview of a juvenile brain stained for th by in situ hybridization (image taken from Filippi et al., 2010), which serves as anatomical reference to indicate the levels of the sections shown in B-G. B-G: Fluorescent in situ hybridization to detect gad1b/2 (C,F; green) or vglut2 (D,G; green) expression combined with anti-TH immunofluorescence (magenta). In each row, the image at the left shows an overview of the considered section and displays only TH immunostaining. Higher magnified views of the approximate area framed by the white square are shown to the right, together with either gad1b/2 (C,F) or vglut2 (D,G) staining. All images are 6–10 μm confocal z-projections of areas comprising THir cells in the olfactory bulb (OB; B-D) and in the subpallium (SP; E-G). All telencephalic THir neurons express gad1b/2 (C,F) but not vglut2 (D,G), indicating that they are GABAergic. To better display the co-localization of the markers, C1-C3 and F1-F3 show the individual channels of the areas framed in C and F, respectively. For abbreviations see list. Scale bars = 50 μm.
Supporting Information Figure S4 Localization of gad1b/2- or vglut2- expressing cells and TH-ir neurons in the anterior diencephalon of the juvenile brain. A: Overview of section planes shown in B-M (for details see Fig 3A legend). B-M: Fluorescent in situ hybridization to detect gad1b/2 (C,F,I,L; green) or vglut2 (D,G,J,M; green) expression combined with anti-TH immunofluorescence (magenta). The DA clusters in the magnocellular preoptic nucleus (PM; B-D), in the prethalamus and suprachiasmatic nucleus (VL, SC; E-G), in the pretectum (Pr; H-J), and in the posterior tuberculum (PT; K-M) are reported in this figure. In each row, the image at the left shows an overview of the considered section and displays only TH immunostaining. The pretectal, prethalamic and suprachiasmatic clusters are comprised in the same overview, shown twice in E and H. Higher magnified views of the approximate area framed by the white square in the overviews are shown at their right, together with either gad1b/2 (C,F,I,L) or vglut2 (D,G,J,M) staining. The majority of the images are 4–15 μm confocal z-projections, except for C1-C3, G, and I1-I3, which are single planes. All DA clusters considered in this figure are also GABAergic, as demonstrated by co-expression of TH with gad1b/2, but not with vglut2. The only exception is represented by the suprachiasmatic nucleus, in which some DA neurons express gad1b/2 (arrowhead in F1-F3) and some do not (arrow in F1-F3). For abbreviations see list. Scale bars = 50 μm.
Supporting Information Figure S5 Localization of gad1b/2 or vglut2 expression and TH immunoreactivity in Otp-dependent DA neurons of the juvenile brain. A: Overview of section planes shown in B-J (for details see Fig 3A legend). B-J: Fluorescent in situ hybridization to detect gad1b/2 (C,F,I; green) or vglut2 (D,G,J; green) expression combined with anti-TH immunofluorescence (magenta). The posterior tubercular and hypothalamic Otp-dependent DA neurons are shown in this figure. The overviews in B,E,H are 2-10 μm confocal z-projections encompassing the large pear-shaped DA neurons in the posterior tuberculum (PT; B,E) and the group in the posterior tuberal nucleus (PTN; H). Higher magnified views of the approximate areas framed by the white squares in the overviews are shown at their right, together with either gad1b/2 (C,F,I) or vglut2 (D,G,J) staining (3-16 μm z-projections). All Otp-dependent DA neurons express vglut2 (D,G,J) but not gad1b/2 (C,F,I), indicating that they are also glutamatergic. Individual channels demonstrating co-expression of TH with vglut2 are shown for each group in D1-D3, G1-G3, and J1-J3. For abbreviations see list. Scale bars = 50 μm.
Supporting Information Figure S6 Localization of gad1b/2 or vglut2 expression and TH-immunoreactivity in hypothalamus and hindbrain. A: Overview of section planes shown in B-J (for details see Fig 3A legend). B-J: Fluorescent in situ hybridization to detect gad1b/2 (C,F,I; green) or vglut2 (D,G,J; green) expression coupled with anti-TH immunofluorescence (magenta). The overviews in B,E,H are 5-10 μm confocal z-projections encompassing the hypothalamic groups of liquor-contacting DA neurons located in the paraventricular organ (PVO; B) and in the posterior recess (PR; E), as well as the noradrenergic neurons of the locus coeruleus in the hindbrain (LC; H). All these groups appear to be GABAergic by co-expression of TH with gad1b/2 (C,F,I; 5-8 μm projections), but not with vglut2 (D,G,J; 3-9 μm projections). C1-C3, F1-F3, I1-I3 are single channels enlarged views of the framed areas in C,F,I, respectively. For abbreviations see list. Scale bars = 50 μm.
Supporting Information Figure S7 Localization of gad1b/2 or vglut2 expression and TH immunoreactivity in the medulla oblongata at 30 dpf. A: Overview of section plane shown in B-D (for details see Fig 3A legend). B-D3: Fluorescent in situ hybridization to detect gad1b/2 (C; green) or vglut2 (D; green) expression combined with anti-TH immunofluorescence (magenta). The overview in B is a 10 μm confocal z-projection showing TH-ir noradrenergic neurons of the medulla oblongata (MO) in the hindbrain. These neurons were intermingled but not co-localizing with gad-expressing cells (C; 3 μm projection). Instead, we detected co-expression of TH with vglut2 (D-D3; 6 μm projection). D1-D3 are single channels enlarged views of the framed area in D. The arrowheads point at examples of co-expression. Scale bars = 50 μm.