Abstract
Establishing the hippocampal cellular ensemble that represents an animal’s environment involves the emergence and disappearance of place fields in specific CA1 pyramidal neurons1–4, and the acquisition of different spatial firing properties across the active population5. While such firing flexibility and diversity have been linked to spatial memory, attention and task performance6,7, the cellular and network origin of these place cell features is unknown. Basic integrate-and-fire models of place firing propose that such features result solely from varying inputs to place cells8,9, but recent studies3,10 instead suggest that place cells themselves may play an active role through regenerative dendritic events. However, due to the difficulty of performing functional recordings from place cell dendrites, no direct evidence of regenerative dendritic events exists, leaving any possible connection to place coding unknown. Using multi-plane two-photon calcium imaging of CA1 place cell somata, axons, and dendrites in mice navigating a virtual environment, we show that regenerative dendritic events do exist in place cells of behaving mice and, surprisingly, their prevalence throughout the arbor is highly spatiotemporally variable. Further, we show that the prevalence of such events predicts the spatial precision and persistence or disappearance of place fields. This suggests that the dynamics of spiking throughout the dendritic arbor may play a key role in forming the hippocampal representation of space.
CA1 pyramidal cell dendrites contain voltage gated calcium and sodium channels along with NMDA receptors that allow them to produce nonlinear, regenerative (spiking) events. The spatial extent and site of generation of dendritic regenerative events can vary from wide-spread back propagation of somatic action potentials (bAPs) into the arbor11,12 and multi-dendrite calcium spikes10, to more spatially heterogeneous processes such as partial bAP propagation13,14 and local spike generation15–17. Such events can provide amplification of synaptic input15–17 and the depolarization necessary for Hebbian plasticity induction13,18,19, both of which may be important for place field firing20. However, no measurements of regenerative dendritic activity in place cells have been made during behavior, when network states affecting dendritic excitability are intact and relevant.
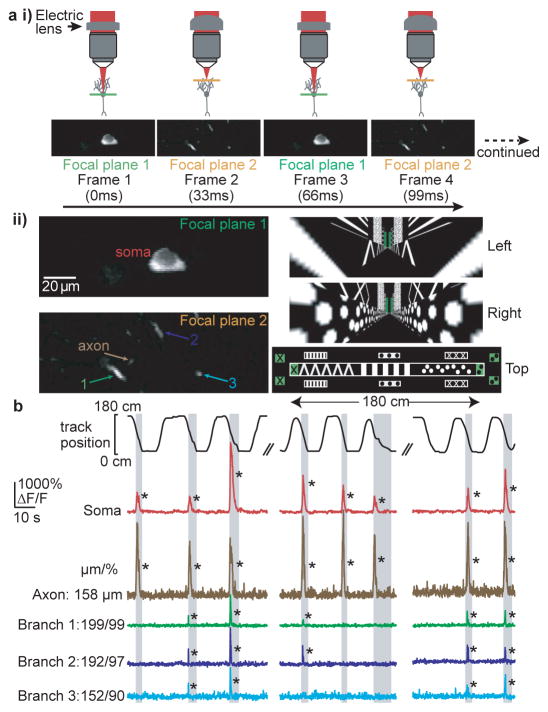
To study regenerative dendritic activity in the hippocampus during behavior we co-acquired time-series movies through a chronic imaging window of calcium transients from dendrites, axons and somata of CA1 place cells sparsely labeled with a genetically-encoded calcium indicator21 (GCaMP6f) while head-restrained mice navigated a virtual linear track1,22 (Fig. 1a). One imaging plane was focused on the soma while the other was focused in the dendritic arbor, slicing through several branches. Many of the labeled neurons were identified as place cells by somatic calcium transients repeatedly occurring during traversals of the same track location (place field significance P < 0.05 from bootstrapping). Unless otherwise stated, our analysis focused only on these cells (33 place fields, 28 place cells, 19.3 ± 13.2 minutes per place cell imaging session, 8 mice), their basal arbors (170 total branches), their axon (visible in 4 place cells, 5 place fields), and on activity observed during place field traversals. The dendritic fields of view (~145×75 μm) on average contained 5 ± 3.5 (range = 2–18) basal arbor branches connected to the co-imaged place cell soma. The imaged branch sections had a mean length of 10 ± 3 μm (range: 3–23 μm), were positioned a mean of 74 ± 15% (range: 38 – 99%) of the distance along the dendritic length (from soma to dendrite tips), a mean of 2.8 ± 0.9 branch points (range: 1 – 6) and 130 ± 44 μm (range: 58–284 μm) from the soma and a mean of 3.8 ± 2.0 branch points (range: 1–9) and 191 ± 83 μm (range: 20–440 μm) from each other. Our recordings of ~5 basal branches would typically represent about 1/3 of all basal dendritic branches at their branching depth (~2.8 branch points from the soma).
Figure 1. Co-acquired time-series of CA1 place cell somata, dendrites and axons during virtual navigation.
ai, Two photon microscopy with an electric lens (top) rapidly switches between two focal planes to generate co-acquired images of soma, dendrites and axon (bottom). aii, (left) Expanded view of place cell shown in a. The time-series was acquired while the mouse navigated a virtual linear track (right). b, top, mouse position along linear track; bottom, ΔF/F traces from the soma (red), dendrites (green, blue, cyan) and axon (brown) of place cell shown in a during place field traversals (gray columns). Note the absence of detectable branch spikes during some somatic firing. Branch distance to soma and % distance from soma to dendrite tip shown for each branch (μm/%). *P < 0.001 from Bootstrapping.
During track traversals we often found significant calcium transients (detectable transients with < 0.1% false positive error rates, * in figures; see Methods) in the soma, axon (mean of 139 ± 26 μm from soma) and basal dendrites in the cell’s somatic place field (Fig. 1b; activity in these structures along the track but outside of the place field was rarely observed). Somatic calcium transients (Extended Data Fig. 1) were used as a surrogate measure of AP firing1,21, and multiple lines of evidence (see Methods) showed that somatic AP firing occurred throughout nearly the entire somatic calcium transient-defined place field. In cells in which we were able to record from the axon along with the soma and dendrites, we found that axonal transients co-occurred with somatic transients 100% of the time (130 transients; n = 4 place cells; Video 1). Because axonal calcium transients are tightly coupled to somatic firing, they provided an independent indicator of AP firing (see Methods). In dendrites of CA1 pyramidal neurons of navigating mice (not necessarily place cells), we observed: 1). Calcium transients restricted to single spines, with no detectable shaft transient; more frequently we observed 2). Calcium transients invading all visible pixels of the recorded branch (both shaft and spines), larger in amplitude and spatial extent than single spine transients. These transients were considered non-regenerative (excitatory input to a single spine) or regenerative (bAPs or dendritically generated spikes, dspikes, such as Na+, NMDA and calcium spikes) depolarizations, respectively (see Methods and Extended Data Fig. 2d,e), and we focused our analysis on the latter.
Here, we refer to these regenerative dendritic events as branch spikes – events caused by either dspikes or bAPs or both. Further, because single spine transients are detectable under our recording conditions, we presume that our measurements are sensitive enough to detect most branch spiking, and therefore the absence of branch spiking additionally indicates that dspikes and bAPs likely did not occur.
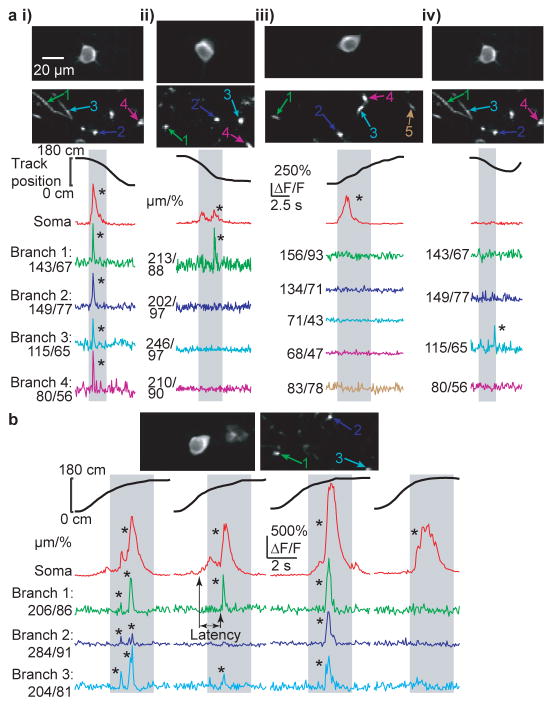
The ability to measure spiking in both the soma and in multiple dendrites of CA1 neurons during navigation allowed us to ask specifically whether somatic place field firing was associated with branch spiking. Indeed during many place-field traversals with somatic firing, dendritic branch spikes were observed (often with onset latencies with respect to somatic firing, Fig. 2, Extended Data Fig. 1d), providing the first direct evidence of their existence in place cells. Further, from traversal-to-traversal, branch spiking was found to be highly spatially variable across the arbor. For example, in many place field traversals, all observed dendritic branches in our imaging field (representing a subset of all the cell’s branches) spiked along with the soma (Fig. 2ai, Extended Data Fig. 5 and 6). However, in some cases, only a subset of the observed branches displayed detectable spikes (Fig. 2aii, Fig. 1b, Extended Data Fig. 3 and 4b). Finally, in many cases, none of the observed branches displayed detectable spikes during place-field traversals while the soma (and axon) fired (Fig. 2aiii, Extended Data Figs. 3–6). From 747 somatic place field transients (from all 28 place cells), 395 (52.9%) showed co-occurring branch spikes in all imaged branches while 154 (20.6%) showed at least one branch with and one without detectable spiking, and 198 somatic transients (26.5%) failed to show co-occurring detectable spikes in any of the imaged branches. Importantly, these three observation classes were often seen in the same place cell, but on different place-field traversals (Fig. 2b; Extended Data Figures 3, 4; Video 1).
Figure 2. Variability of dendritic branch spiking during somatic place field firing.
a, (top) Co-acquired images of place cell soma and dendrites (i–iii are different place cells from 3 mice, i and iv are the same cell). Bottom, ΔF/F traces from the (co-acquired) soma and numbered dendritic branches during a place field traversal (gray columns). Co-occurring somatic firing and detectable branch spiking was observed in all (i), some (ii) or none (iii) of the imaged dendrites. Branch spiking in the absence of detectable somatic firing was also observed (iv). b, Variability in branch spiking was often observed in the same place cell (top) during different place field traversals of the same session. Branch spikes also showed variable onset times with respect to somatic firing onset (black arrows). *P < 0.001 from Bootstrapping.
Characterizing somato-dendritic events as one of these three observation classes did not depend on the recording distance of the dendritic imaging plane from the soma or the number of observed dendritic branches (Supplementary Information, Extended Data Fig. 5a,b,d). Thus, recording from a subset of branches in a single dendritic imaging plane provides a reasonably accurate characterization of dendritic branch spiking throughout a large portion of the basal (and apical) arbor (Supplementary Information, Extended Data Figs. 5 and 6), implying some level of cooperativity between the spiking in different branches (Extended Data Fig. 7).
A fourth class of observation was also made: branch spiking in the absence of detectable somatic spiking (Fig. 2aiv; Extended Data Fig. 4b), representing probable evidence of dspikes in place cells. These localized dspikes were rarely observed in the absence of somatic spiking (6 total in or around the mean somatic place field, during 8.3 recording hours; 2 other dspikes were observed outside of place fields or in non-place cells; Extended Data Fig. 2a–c,f). However, dspikes could contribute to more global branch spiking, making isolated dspikes difficult to detect.
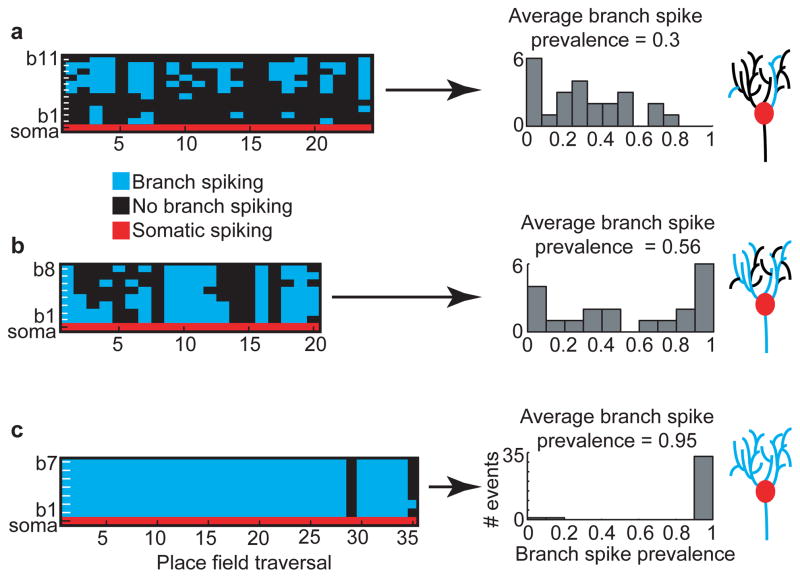
Place cells exhibited different degrees and patterns of branch-spiking heterogeneity. As a measure of this heterogeneity we calculated the prevalence of branch spiking (fraction of branches with detectable branch spikes) during each place field traversal, defined as branch spike prevalence (BSP, see methods for calculation). Figure 3 shows a place field with low average BSP (the average BSP across all place field traversals, Fig. 3a), one with moderate average BSP (Fig. 3b), and one with consistent somato-dendritic unison (high average BSP, Fig. 3c). Further, we observed that average BSP could differ significantly between different place fields of the same cell and that in-field average BSP was significantly greater than out-of-field BSP (Supplementary information, Extended Data Fig. 8). Together, these results demonstrate that average BSP varies between different place cells and place fields and is not solely determined by cellular properties, such as the general degree of excitability, but is also synaptic input specific.
Figure 3. Place field branch-spiking heterogeneity.
a–c, Colored plots (left; 3 different place cells from 2 mice) show occurrence of detectable spiking in each branch (blue or black) during somatic place field firing (red). Middle, histograms of branch spike prevalence on each traversal. Cartoons (far right) do not represent real data.
The above observations demonstrate spatiotemporal variability in the regenerative dendritic events that are widely believed to provide amplification of synaptic input and the depolarization necessary for Hebbian plasticity (defining plasticity “windows”). Many possible mechanisms could generate our observed patterns of somatic AP firing and branch spiking: 1. bAP induced branch spiking could be spatially and temporally modulated23 by inhibition, synaptic boosting or sodium channel inactivation, 2. Clustered synaptic input could generate branch spiking24,25 in the form of widespread calcium spikes and/or more local dspikes10,25,26, or 3. dspikes and bAPs could co-occur. However, regardless of spike initiation site(s), the known involvement of branch spiking in plasticity and input amplification suggests that differences between place cells and their firing fields may be related to branch spike prevalence.
To investigate the relationship between branch spiking and place field firing, we looked at two features of place fields previously linked to NMDA-receptor mediated plasticity: precision and stability. Place field spatial precision refers to a place cell’s somatic spatial firing consistency over many place field traversals, and has been shown to be related to spatial memory task performance6,7. Long-term place-field stability, which refers to the persistence of a place field over days, is thought to represent the storage of spatial memories4.
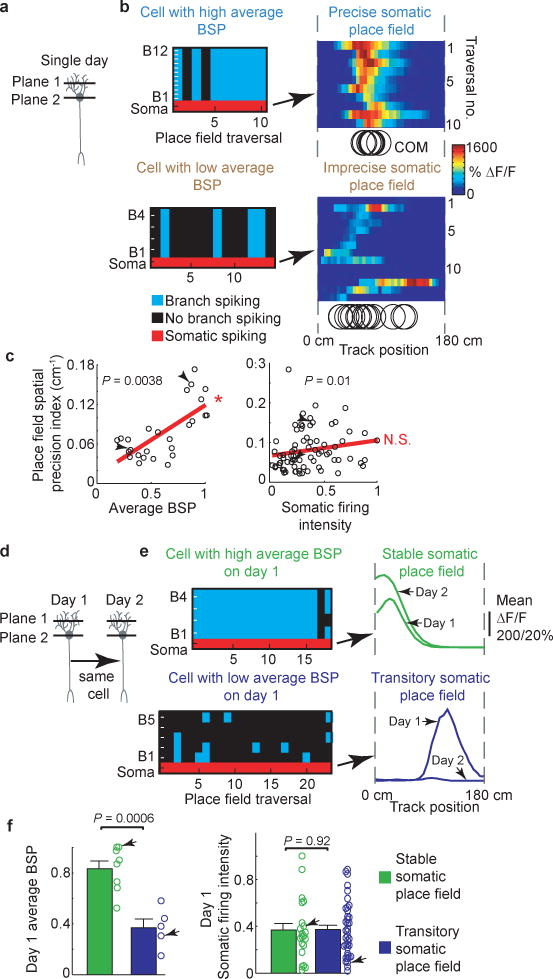
We found a significant correlation between a place field’s average BSP (Fig. 4a) and its spatial precision index (defined in Methods; Fig. 4aiii left; Spearman’s rank correlation coefficient: P = 0.0038; rho = 0.6442; significant positive linear slope within 95% confidence bounds, 26 place fields). The 9 fields with the largest average BSP were also the most precise, indicating that average BSP can be used to predict precision. Interestingly, when we compared a place field’s somatic firing intensity (integral of somatic transients, see Methods) to its spatial precision, little to no correlation was observed (Fig. 4aiii; Spearman’s rank correlation coefficient: P = 0.01; rho = 0.29; linear slope not significantly positive). Thus average BSP, but not somatic firing intensity, is a predictor of a place field’s spatial precision.
Figure 4. Dendritic branch spike prevalence predicts place field spatial precision and long-term stability.
ai, Schematic of imaging planes. aii, Example cells with high (top left) and low (bottom left) average BSP fields; right, somatic ΔF/F vs. track location raster plots with each traversal’s transient center of mass (COM) (black circles). aiii, left, plot of precision vs average BSP for each place field (n = 26 place fields from n = 8 mice); right, plot of precision vs somatic firing (includes single cell and population imaging experiments; n = 74 place fields from n = 11 mice). Arrows indicate examples from aii. P values from Spearman’s rank correlation test; linear fit shown in red; *significant positive linear slope. bi, Schematic of imaging planes on days 1 and 2. bii, Example cells with high (top left) and low (bottom left) day 1 average BSP; right, associated place fields on days 1 and 2. biii, average BSP (left) and somatic firing intensity (SFI; right, includes single cell and population imaging experiments) for stable (n = 8 place fields from n = 3 mice for average BSP group; n = 21 place fields from n = 6 mice for SFI group) and transitory (n = 5 place fields from n = 2 mice for average BSP group; n = 40 place fields from n = 5 mice for SFI group) place fields; error bars represent SEM; P values from Student’s Unpaired t-test.
We next assessed the relationship between average BSP and place field stability (Fig. 4b) by monitoring somatic and dendritic activity in the same cells over the course of 2 days. Place field average BSP was measured on day 1 and then the same cell was imaged the next day to determine whether it had the same somatic place field (Fig. 4bi). We classified place fields that persisted to day 2 as stable place fields and those that disappeared by day 2 as transitory place fields (Fig. 4bii). Stable fields had significantly greater average BSP than transitory fields (Fig. 4biii; 0.83 ± 0.06 vs. 0.37 ± 0.07; t test: P = 0.0006). When the somatic firing intensity of transitory and stable place fields was compared no significant difference was observed (Fig. 4biii; 0.374 ± 0.036 vs. 0.368 ± 0.057; t test: P = 0.92). This indicates that average BSP, but not somatic firing intensity, is a predictor of the long term stability of a place cell’s place field. Together, the above results indicate that place-field spatial precision, persistence and disappearance can be predicted based on the prevalence of regenerative events in place cell dendrites, but not based on somatic firing alone (precision and stability were also positively correlated, Supplementary Information and Extended Data Fig. 9).
Branch spikes can act to amplify synaptic input (through dspikes15–17) to drive somatic firing and can also provide the post-synaptic signal required for Hebbian plasticity13,18,19. In this context, our observation that BSP is variable, implies that spatially heterogeneous and temporally variable input amplification and synaptic plasticity play a role in place field precision and stability. Somewhat paradoxically, however, increased branch spiking did not strongly correlate with an increased average number of somatic APs during place field traversals (Extended Data Fig. 10), and fields associated with more “open plasticity windows” (more branch spiking possibly associated with greater plasticity) were actually more stable and precise.
How then might synaptic plasticity and amplification mechanisms be used by place cells to develop their representations of space? A “winner-takes-all” scenario incorporating synaptic Hebbian potentiation and somatic firing homeostasis, provides a potential answer as follows. Previous models27,28 examined spatially imprecise place fields generated by different combinations of synaptic input, each with different spatial tuning. The combinations which happened to overlap more (in space and time) generated greater post-synaptic responses and more Hebbian potentiation of the contributing inputs. This increased the effectiveness of the potentiated inputs to drive somatic firing relative to other inputs with non-overlapping spatial tuning. A repetition of this process caused the cell to respond mainly to the subset of strong inputs with spatial tuning overlap, leading to more precise place field firing. The increased effective drive to the cell caused by the potentiated inputs then triggered a homeostatic mechanism that lowered overall cellular excitability (through synaptic or intrinsic excitability renormalization)29. This increased the contribution from the strong inputs (in relation to the weak inputs) in driving somatic firing, thus further increasing spatial precision, but maintaining the average firing rate of the place cell.
Assuming that branch spikes represent the postsynaptic responses that signal Hebbian potentiation, our observation of increased spatial precision of somatic firing with greater average BSP fits with the above model. Also, the sets of surviving, stronger synapses in the model would be expected to persist longer in time, consistent with our observation of greater place field stability with increased average BSP. The use of a somatic AP firing homeostasis mechanism also explains the weak relationship observed between BSP and AP firing, with the implication that the firing may be driven more by regenerative dendritic activity in high average BSP fields, and less in low average BSP fields. Further, given the above scenario, in silent cells, strong sets of clustered synapses formed through potentiation in different environments may be partially activated in the animal’s current environment, but just below dspike threshold and therefore sensitive to small changes in somatic depolarization, as recently observed3.
In the context of synaptic plasticity (see Supplementary Information for further discussion), while our methods do not directly reveal if branch spikes induce LTP, LTD or no weight change30, the above model implies that in place fields, branch spiking potentiates synapses, is the result of previous potentiation, and/or maintains the strength of previously potentiated synapses through positive feedback. Our measurements demonstrate multiple levels of dissociation between AP firing and the mechanisms widely believed to signal dendritic plasticity, providing the first clues regarding the spatial and temporal scales at which associative Hebbian learning rules20 may operate in a behaving animal performing a task known to engage integration and plasticity in the cells being studied. One implication is that the process by which place cells orchestrate plasticity signals (dendritic branch spiking) may be variably, rather than consistently, linked to their mode of information transmission (the somato-axonal action potential).
Methods
Mouse surgery, virtual reality, and behavior training
All experiments were approved by the Northwestern University Animal Care and Use Committee. Male C57BL/6 mice (postnatal day ~70) were anesthetized (~1–2% Isoflurane) and a small (~0.5–1.0 mm) craniotomy was made over the hippocampus (1.8 mm lateral, 2.4 mm caudal of Bregma). For single cell dendritic imaging a low titer Cre-virus (AAV2/1-CamkII-Cre, 1.5×10⁸ GC/mL, all virus from University of Pennsylvania Vector Core) was injected (1 injection of ~30 nL at a depth of ~1250 μm below the dura surface using a beveled glass micropipette: ~1–2 MΩ after beveling) in combination with a high titer of flexed-GCaMP6 virus (AAV1-Syn-flex-GCaMP6f, 1.4×10¹³ GC/mL) leading to expression of GCaMP-6f21 in a sparse CA1 pyramidal neuron population. For population imaging (Extended Data Fig. 9), dense labeling was performed the same as sparse except AAV1-Syn-GCaMP6f (1.5×10¹³ GC/mL) was injected. Mouse water scheduling began the next day (0.8–1.0 mL/day) followed either the next day or ~7 days later by a hippocampal window and head-plate implantation surgery (as described in1), for population or single cell dendritic imaging respectively. Training in a 1.8 m virtual linear track (one ~40–60 minute session per mouse per day) began ~7 days after window implantation and continued until mice routinely ran back and forth along the linear track to achieve a high reward rate (>~2 rewards/minute); rewards consisted of water (4 μl) delivered as described previously1,22. Once this criterion was reached (~7–14 days of virtual reality training), place cell imaging commenced and was repeated daily for ~1–4 weeks. During the imaging sessions included in our analysis, mice received an average of 4.4 ± 1.1 rewards/min. GCaMP6f expression reached a somewhat steady state level ~21 days post injection.
Our virtual reality and spherical treadmill system were similar to those previously described1,22,31 but with the following differences. A curved screen monitor (CRVD, Ostendo) was used for displaying the virtual reality environment. The screen was adjusted for low light emission (brightness: 15/100, Contrast: 50/100, All RGB intensities: 1/100) and was placed ~14 inches in front of the mouse covering 133° and 48° of the mouse’s horizontal and vertical field of view, respectively. The Quake2 video game engine described previously22 was used here for the virtual simulation, with minor modifications: the virtual environment was rendered with 2880×900 pixels, and the horizontal field of view in the virtual environment was 105°. Mouse locomotion speed and direction on the spherical treadmill were read using a G-400 optical computer mouse (Logitech) and forward and yaw movements of the treadmill were used to update forward position and view angle in the virtual environment, respectively, as described previously22. The forward movement gain was set such that the full length of the virtual track was traversed by ~2.8 rotations of the ball (180 cm of linear distance) and the yaw gain was set such that ~7.5 rotations of the ball resulted in one full field of view rotation (360°) in the virtual environment.
Two-photon imaging of place cell soma, axon and dendrites
We customized a Moveable Objective Microscope (Sutter Instruments) for our imaging experiments. The microscope consisted of water cooled 6215H galvos with 3mm B1 coated mirrors (Cambridge technology), a 40×/0.8 NA objective (LUMPlanFL N 40×/0.8 W, Olympus) and enhanced collection optics. Green GCaMP6f fluorescence was routed to a GaAsP PMT (H10770PA-40) using a series of dichroic mirrors and band-pass filters (in order after leaving the back aperture; Semrock): FF665-Di02 long pass dichroic, FF01-680/sp short pass filter, FF560-Di01 long pass dichroic, FF01-510/84 band-pass filter. Stray light from the virtual reality monitor was blocked using a custom box surrounding the top of the microscope objective, the electric lens and the overlying dichroic mirror (not including the tube lens, scan lens, galvos or routing mirrors). This box had one hole on top, for entry of the excitation beam, which was covered with a color glass filter (FGL780, Thorlabs) and one hole on bottom for the microscope objective. This bottom hole was sealed using the same loose black rubber tube and tight fitting metal rings described previously1. ScanImage 3.8 was used for microscope control and acquisition32. Ti:Sapphire laser (Chameleon Ultra II, Coherent) light at 920 nm was used as the excitation source. Laser average power at the sample (after the objective) was 10–75 mW. An electric lens33 (EL-10-30-C-VIS-LD, Optotune; f=−100 mm offset lens) was used to rapidly switch between different focal planes (up to ~500 μm apart were possible). The electric lens was mounted in close proximity to the microscope back aperture and the focal plane was rapidly switched after each collected image of the time-series by changing the applied steady-state current (LD1255R current driver, Thorlabs). Simultaneous with focal plane switching, the average laser power was modulated, using a pockels cell (350-80-LA-BK-02, 302RM driver, Conoptics), to account for different amounts of tissue penetration (more power for deeper planes).
Images (256×64 pixels, 0.5 ms per line field of view of ~145×75 μm) in each plane were acquired at 31.3 Hz for single plane, 15.6 Hz for 2 plane and 10.4 Hz for 3 plane acquisitions. The resulting co-acquired time-series movies contain interleaved frames fast enough to provide sufficient sampling of transients in each plane. Note that while the effective frame rate at each plane changed depending on the number of acquired planes, the time to acquire each individual frame (32 ms) did not change. Time-series imaging sessions lasted 19.3 ± 13.2 minutes. Potential place cells were initially selected online during behavior by comparing changes in fluorescence with track location. These cells were then examined to ensure that their dendrites could be clearly separated from dendrites and axons of other cells. Multi-plane imaging was then performed on cells passing these criteria by selecting a dendritic plane(s) with multiple basal branches in the region above (dorsal to) the soma. Time-series acquisition was initiated during behavior periods of high-reward rate on the linear track task.
A Digidata1440A (Molecular Devices) data acquisition system was used to record (Clampex 10.2) and synchronize position in the linear track, reward timing, and two-photon image frame timing (using the command signal to the slow galvanometer).
After time-series imaging, z-series were acquired from each cell from the external capsule fiber surface through the proximal apical dendrite ~300 μm deep using the following parameters: 10 frames (short time-series) per z-plane, 2 μm steps between z-planes, 256×128 pixels per frame, ~145×75 μm, 1ms/line. Cell bodies were typically 100–150 μm below the surface.
Data Analysis and Statistics
Analysis was performed using ImageJ (1.45) and custom scripts written in MatLab (R2011b). All data in the text and figures are presented as mean ± S.D., except in reference to the plots shown in Fig. 4biii, Extended Data Fig. 9d and 10b where error represents SEM. Sample sizes were chosen to reliably measure experimental parameters while remaining in compliance with ethical guidelines to minimize the number of animals used. Experiments did not involve randomization or blinding because no place cell or animal groups were predefined.
Time-series movies for multi-plane recording were acquired using interleaved frames (i.e. every other frame was from the same plane for 2-plane imaging). The electric lens settling time of ~5 ms created distortions in the first few lines of each frame of the movie; these lines were therefore removed before subsequent analysis. Each multi-plane time-series was then split into separate time-series movies, one for each acquired plane. Each single-plane time-series was then independently motion corrected using whole frame cross-correlation, as described previously1,34.
Morphology analysis and identification of axons and dendrites
Because z-series were acquired during behavior, motion correction was required to correct for brain movements. Each 10 frame time-series acquired at each z-plane was motion corrected independently using whole frame cross-correlation34. A mean image (time-projection) was made from each motion corrected time-series at each z-plane. The mean images were then registered with respect to each other by cross-correlating34 the mean image at plane 2 with the mean image at plane 1, then plane 3 with 2, etc., until all images were registered.
Dendrite and axon branches were traced (in 19 of 28 place cells; brain motion during high-resolution z-series prevented accurate reconstruction in 9 cases) from motion corrected z-series using Simple Neurite Tracer in Fiji (ImageJ)35. Distances and branch numbers were calculated from the resulting wire segments using custom Matlab scripts. All dendritic and axonal distances from soma represent distance traveled along the neurite; these numbers are provided for each branch in the Figures along with the % distance from the soma to the end of the dendrite (dendritic tip) in the form of “μm/%”.
Dendrites belonging to the co-imaged soma were identified offline by tracing them to the soma in the z-series; additional verification was provided by their often co-occurring significant calcium transients (see below) with the soma. Axon segments were identified offline by their morphology and signal change. They were smaller in diameter than dendritic branches and also had a lower resting florescence level. Further, their calcium transients were longer in duration and larger in signal change compared to dendritic branches.
ROI selection and calcium transient analysis
For single cell imaging (sparse labeling) ROIs were selected by hand on the mean soma or dendrite images (mean time projection of all frames in the motion corrected time-series at each plane). ROIs were drawn to closely follow the outline of the structure of interest (soma, axon or dendrite).
For population imaging, ROIs were defined as previously described36 (mu=0.5, 150 principal components, 100 independent components, s.d. threshold =1.5, s.d. smoothing width=1.5, 100 pixels<area of ROI <400 pixels). As seen previously1, ROIs nearly always defined single cell regions.
From single cell and population time-series, ΔF/F versus time traces were generated for each ROI as previously described1. Briefly, slow changes in the fluorescence traces were removed by examining the distribution of fluorescence in a ~8 sec (for single cell/sparse labeling) or ~3.2 sec (for population imaging) interval around each sample in the trace and normalized by the 8th percentile value. These baseline corrected soma, axon or dendrite fluorescence traces were then subjected to the analysis of the ratio of positive to negative going transients of various amplitudes and durations described previously31. We used this analysis to identify significant transients with <0.1% false positive error rates; these identified significant transients were used in the subsequent analysis and are marked with an “*” in the figures. Note that brain movements can cause small fluorescence transients in the positive and negative going directions (equally) during behavior. Because GCaMP-6f indicates activity with positive going transients only, the negative going transients are assumed to be due to brain movements. The above cited analysis detects positive going transients of a duration and amplitude that almost never occurs in the negative going direction (<0.1% false positive rate). Thus, most of the small positive going transients not detected as significant by this analysis are likely brain motion induced, since events of the same duration and amplitude often occur in the negative going direction; however some of these small positive going transients may be due to neural activity (though the number is likely small, see for example our ability to record single spine events in Extended Data Fig. 2d,e).
The mean duration of somatic, axonal and dendritic calcium transients were calculated as the full duration of the significant transients: soma: 2.89 ± 0.59 sec, axon: 2.0 ± 1.2 sec, dendrites: 1.07 ± 0.65 sec. These durations were calculated from sparsely labeled cells only, where all 3 structures could be identified (not from populations labeling). Only transients occurring during consistent runs through the place field, in which a long running period covered >90% of the place field (see below), were included.
Previous studies have consistently found that somatic calcium transients are caused by AP firing where the number of underlying APs correlates with the change in fluorescence21,37–39. Thus, somatic ΔF/F fluorescence traces are often used as a surrogate measure of AP firing activity1,22. The following three related measurements of somatic and axonal calcium transients in the present study are consistent with conclusions of prior studies asserting that somatic calcium transients are caused by AP firing:
An axonal calcium transient co-occurred with the soma 100% of the time (130 transients; n = 4 place cells); axonal transients are tightly coupled to somatic firing40,41 and thus provide an independent indicator that AP firing causes our somatic calcium transients,
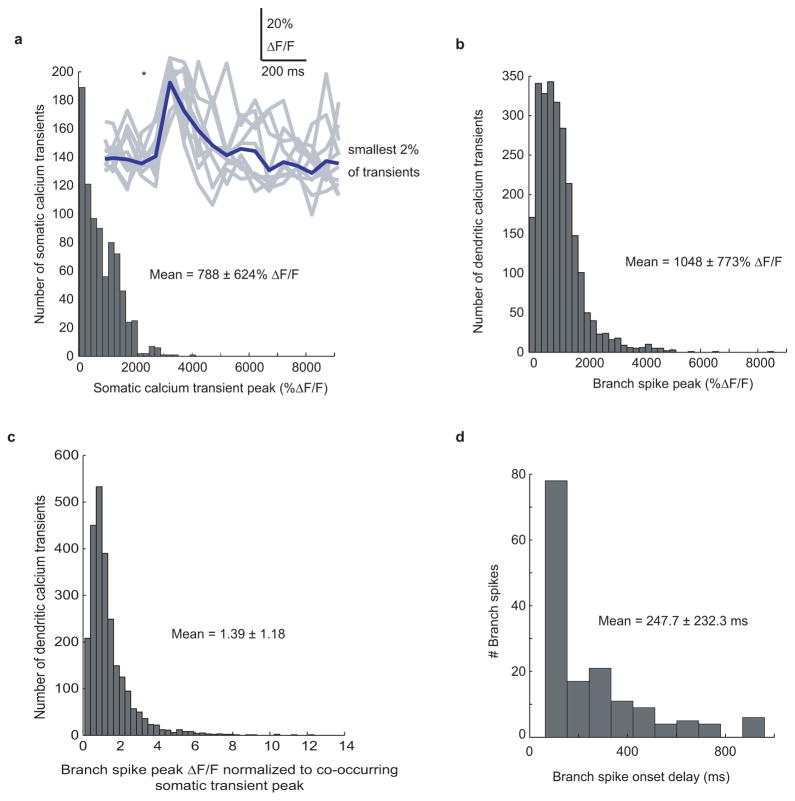
Averaging our smallest-amplitude somatic calcium transients produced a trace (Extended Data Fig. 1a) nearly identical in amplitude, shape and duration to what is expected from a single somatic AP based on previous combined cell-attached and imaging measurements21, and
Place fields defined by somatic calcium transients are highly similar to those defined by somatic AP firing in a comparable virtual track1,22.
Taken together, these 3 points indicate that somatic AP firing occurs throughout nearly the entire somatic calcium transient-defined place field. Further, somatic calcium transients varied in amplitude, consistent with a difference in the number of underlying APs, and varied in duration, consistent with the summation of multiple transients (Extended Data Fig. 1).
Dendritic calcium transients42,43 occur as a result of either non-regenerative or regenerative depolarizations that involve calcium influx through local NMDA and voltage gated calcium channels44. Excitatory input to a single spine leads to a non-regenerative post-synaptic depolarization typically detected as a spine head restricted calcium transient with little or no shaft component21,44–47. Dendritically generated spikes (such as Na+, NMDA and calcium spikes, collectively referred to here as dspikes) and bAPs can also lead to dendritic calcium influx, but by contrast, these events are regenerative depolarizations often detected as both shaft and spine invading calcium transients larger in both amplitude and spatial extent than transients associated with single spine input17,44,46,47. In CA1 pyramidal neurons of navigating mice (not necessarily place cells), we observed: 1). Calcium transients restricted to single spines, with no detectable shaft transient; more frequently we observed 2). Calcium transients invading all visible pixels of the recorded branch (both shaft and spines), larger in amplitude and spatial extent than single spine transients (Extended Data Fig. 2d,e). These transients were considered non-regenerative or regenerative depolarizations, respectively. The regenerative dendritic events were defined here as branch spikes – events caused by either dspikes or bAPs or both.
Defining place fields
Place fields were identified and defined as described previously1, with minor changes outlined below. Place fields were defined solely based on somatic (not dendritic) calcium transients. First, long running periods were defined in each direction in which mouse movement along the virtual track consisted of virtual velocity >~7 cm/sec and run length >40 cm (straight run without changing direction or hitting the end of the track). These long-run periods were first categorized based on the running direction (positive or negative direction) and then further subdivided into two categories based on the animal’s current task performance: Segments of time between two rewards in which long running periods of only one direction occurred were defined as high reward rate periods, all other long running periods were defined as low reward rate periods. Only high reward rate periods were analyzed and all time-series datasets included here had at least 20 (mean of 50) long running segments during high reward rate periods in each of the positive and negative directions. For each running direction for each cell, the mean somatic ΔF/F was calculated as a function of virtual track position for 80 position bins and this mean fluorescence versus position plot was then averaged over 3 adjacent points. Potential place fields were first identified as contiguous regions of this plot in which all of the points were greater than 25% of the difference between the peak somatic ΔF/F value (for all 80 bins) and the baseline value (mean of the lowest 20 out of 80 somatic ΔF/F values). These potential place field regions then had to satisfy the following criteria: 1. The field must be >13 cm in width, 2. The field must have one value of at least 10% mean ΔF/F, 3. The mean in field ΔF/F value must be >3 times the mean out of field ΔF/F value and 4. Significant calcium transients must be present >20% of the time the mouse spent in the place field. Potential place field regions that met these criteria were then defined as place fields if their P-value from boot strapping was <0.05, as described previously1 and their mean widths were <125 cm.
For calculation of BSP, somatic firing intensity, spatial precision and center of mass (see below) only consistent runs through the place field, in which a long running period covered >90% of the place field, were considered. Because place field spatial precision might be artificially increased in place fields occurring at the track ends due to edge effects, we only included place fields in which neither edge of the identified field was at a track end. Additionally, we determined that place field spatial precision (for the included fields) does not correlate with distance from track end (not shown).
Place field center of mass and spatial precision index
To calculate the somatic transient center of mass (COM) on each traversal (n) along the linear track when a somatic transient occurred in the defined place field, we first split location into 4.5 cm bins (i) and measured somatic ΔF/F in each bin. We then used the following equation to calculate the COM for each traversal n (COMn):
Where DFi is the the somatic ΔF/F in bin i and xi is the distance of bin i from the start of the track. We then calculated the peak ΔF/F weighted mean COM (COMw) from all traversals n (COMn for each traversal was weighted by the peak transient ΔF/F on that traversal (An)):
Spatial precision (SP) was then calculated as the inverse of the peak ΔF/F weighted COMn standard deviation as follows:
Branch spiking analysis
The images shown (at left) in Fig. 3a, b, c, Fig. 4aii, bii and Extended Data Fig. 8a were generated as follows: somatic and branch spiking events that occurred in the cell’s place field (if a cell had more than 1 place field, each field was treated separately) were converted to ones (a significant transient occurred) and zeros (no significant transient was detected).
Branch Spike Prevalence (BSP) was then calculated for each place field traversal with a somatic transient by dividing the sum of the number of branches with a detectable significant transient by the total number of recorded branches. The BSP distribution for each place field in each session could then be examined (Fig. 3a,b,c, Extended Data Fig. 7, 8 histograms) or used to calculate the average BSP for the field (the average of all BSP values for the session). Note that average BSP and resting fluorescence level for each place cell were not statistically significantly related (Extended Data Fig. 5g).
The branch spikes all co-occurred with somatic firing (except where stated otherwise; i.e. example in Figure 2aiv, and in Extended Data Fig. 2, 4b). All BSP numbers presented are from dendritic activity that occurred during somatic place field firing, except for specified values in Extended Data Fig. 8b (green dots).
To compare in-place field to out-of-place field BSP we examined 5 cells (Extended Data Fig. 8b green dots) that had place fields and also had at least 3 somatic calcium transients occurring randomly along the track (typically during running), but outside of the place field and the reward zones. Note that out of place field somatic and dendritic firing along the track (outside of reward zones) was extremely rare.
For each recorded dendritic branch, the onset of each branch spike with respect to the co-occurring somatic transient was measured as the time difference between the onset of the somatic and dendritic significant transients (Fig. 2b, Extended Data Fig. 1d). If multiple branch spikes occurred during the somatic transient, the onset of each branch spike relative to the soma onset was measured.
To calculate how widespread each of the 3 main types of somato-dendritic observations were (Figure 2ai–iii), we classified each event type using one dendritic imaging plane and then included all of the branches from a more distal imaging plane (Extended Data Fig. 5a, b) and calculated the percentage of time our classification was correct before and after the distal plane was included.
Somatic firing intensity
The somatic firing intensity is the mean somatic calcium transient integral, calculated by summing the integrals of each somatic calcium transient that occurred in the place field and dividing the sum by the total number of place field somatic calcium transients.
Branch Spike Prevalence analysis for stable and transitory place cells
Stable place cells were defined as cells with a mean place field center of mass (COMw) on day 1 and day 2 that occurred within 15 cm of each other. In rare cases when place fields shifted between 15 and 50 cm, they were excluded from the analysis. Shifts of >50 cm were considered distinct place fields and so day 1 fields were classified as transitory. Place fields were excluded if they had fewer than 5 place field transients. Day 1 and day 2 were consecutive days. Average Branch Spike Prevalence and mean somatic firing intensity were measured on day 1 for both stable and transitory place fields.
Population analysis for stable and transitory place cells (Extended Data Fig. 9)
Place cells were excluded if they had fewer than 5 place field transients, had a place field with one edge at a track end or if the field of view on day 2 did not include the cell. Day 1 and day 2 were consecutive days. Day 7 was seven days after day 1 and no imaging or training took place between day 2 and day 7.
Extended Data
Extended Data Figure 1. Somatic and dendritic place field Ca2+-transient amplitudes and onset times.
a–c, Histograms of somatic transient peak ΔF/F (a), branch spike peak ΔF/F (b) and ratio of branch spike peak ΔF/F to somatic transient peak ΔF/F (c). Inset in a shows the smallest significant amplitudes of somatic transients detected (gray) and their mean (blue; average triggered when gray transients were first >2 std above the baseline). These small transients are nearly identical in amplitude, shape and duration to what is expected from single somatic APs based on previous in vivo combined cell-attached and imaging measurements in the visual cortex using GCaMP6f (Chen, 2013). (d). Histogram showing the distribution of branch spike onset time relative to somatic firing onset. Note that branch spike onset leading somatic firing onset was not observed. Mean ± SD is shown for a–d.
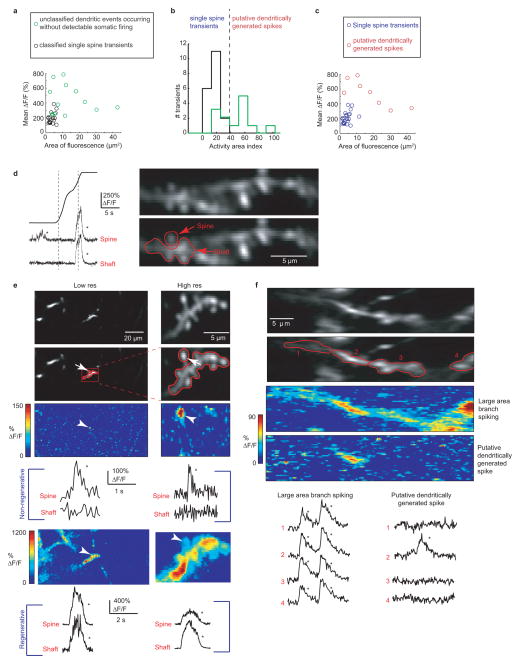
Extended Data Figure 2. Identifying putative dspikes and discriminating between regenerative and non-regenerative dendritic events.
a, Mean ΔF/F of significant calcium transients localized to a single branch (using the same imaging parameters to measure co-occurring somatic firing and branch spikes in Figures 1–4), plotted against the area of significant ΔF/F increase (>3 std). The mean ΔF/F and the area of significant fluorescence change was calculated for each transient as follows. ΔF/F movies were generated where each pixel value in each frame of the movie represents the change in fluorescence with respect to the baseline mean for that pixel. The frames during the transient of interest were averaged together and the number of pixels with ΔF/F >3 were counted, converted to μm2 and used as the area of significant fluorescence change. The mean ΔF/F value for the transient was then calculated as the mean value of the pixels with ΔF/F >3. Black circles represent known single spine calcium transients acquired using low resolution time-series acquisition (the same resolution used to identify branch spiking), but confirmed as spines using higher-resolution time-series acquisitions where calcium transients were restricted to the spine head (see (d,e))). Green circles represent calcium transients restricted to a single dendritic branch and occurring in the absence of a somatic firing. Because no high-resolution time-series were acquired from these structures, it was unknown whether they represent transients restricted to single spines or branch spiking. The panels and analysis presented in b and c indicate that a majority of these events are due to branch spiking and not single spine transients. b, As a combined metric of mean ΔF/F and area of fluorescence change, we normalized mean ΔF/F and area of fluorescence to their maximums and measured the distance from the origin (the normalized Euclidean distance of each point in (a)); we refer to this metric as the Activity Area Index (AAI). Histogram showing known spine transients all fall into the lowest AAI bins (black bars; AAI<40), and most unclassified events (putative dspikes) in (a) have higher AAIs (green bars). The events in the larger AAI bins (with greater mean ΔF/F covering a larger area; AAI>40; separated from the lower AAI bins by the dashed line) fit known characteristics of dspikes. c, Using the AAI threshold defined in b, most of the unclassified transients fall into a separate group (red) from the known single spine calcium transients (8 of the 13 unclassified transients had distinctly larger AAIs compared to spine transients, blue) and were therefore considered branch spikes (putative dspikes). d, Example calcium transients restricted to a single spine head (bottom left) and invading both spine head and shaft (bottom right) in a place cell. Mean somatic place field is indicated by the gray dashed line. e, Example of a stretch of dendrite imaged at low (left) and high (right) resolution in a navigating mouse. The red box and ROIs indicates the same structures that were imaged at both low and high resolution. The same spine head is indicated by arrows at different resolutions in all images. Calcium transients restricted to the same single spine head are shown at both low and high resolution by the color-coded % ΔF/F map and by the % ΔF/F traces in the middle (labeled Non-regenerative); note that the shaft ROI includes other non-active spines. Calcium transients invading the branch and all spines are shown at both low and high resolution by the color-coded % ΔF/F map and by the % ΔF/F traces at the bottom (labeled Regenerative) f, Image of a dendritic branch split into 4 ROIs. Calcium transients are seen in all parts of the branch during large area branch spiking (see both color-coded map and traces of % ΔF/F)). A putative dspike, during navigation, in the same branch causes a significant increase in fluorescence in only part of the branch (ROI 2), which includes the shaft.
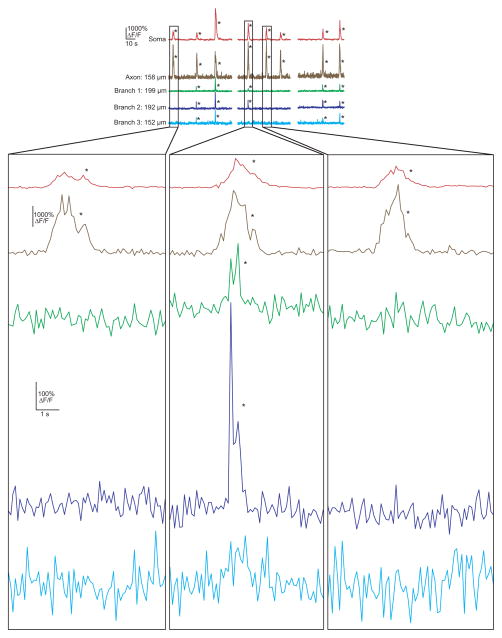
Extended Data Figure 3. Expanded views of traces showing the variability in detectable events in the soma, dendrites and axon.
Traces from Fig. 1b showing variable branch spike prevalence in the same cell. 3 events are shown amplified (for the amplified traces, the bottom y-axis scale bar refers to the green/blue/cyan dendritic traces, and the top scale bar refers to the red/brown soma/axon traces).
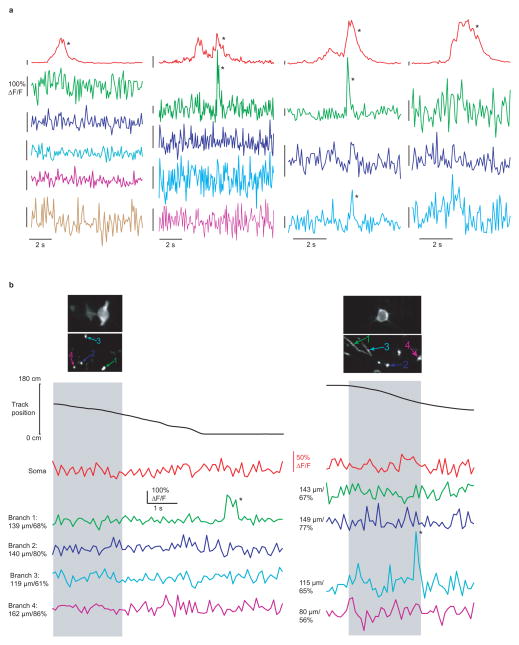
Extended Data Figure 4. Expanded views of traces showing variability of dendritic branch spiking during somatic place field firing.
a, Traces from Fig. 2b are shown here amplified (each trace has a y-axis scale bar representing 100% ΔF/F). b, 2 examples of branch spikes detected in single branches in the absence of detectable somatic firing and branch spiking in other dendrites. In each case the soma y-axis is amplified relative to the dendrite traces to show the absence of detectable somatic transients.
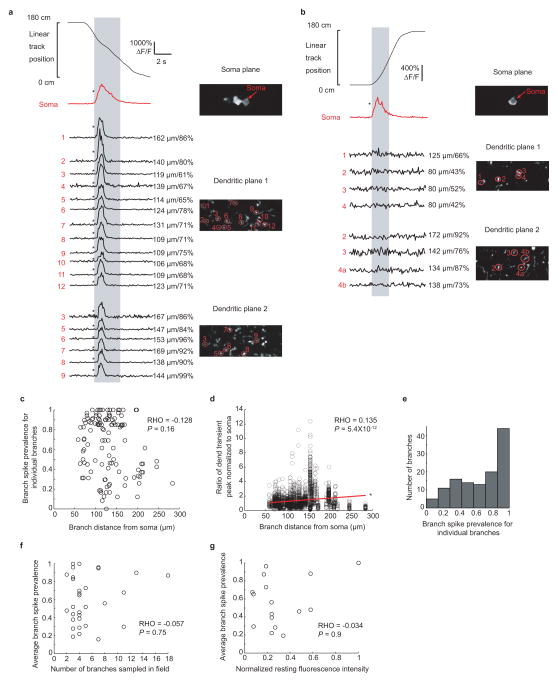
Extended Data Figure 5. Branch spiking in a single dendritic plane is representative of activity throughout a large portion of the dendritic arbor and average branch spike prevalence is independent of the number of sampled branches in the field, their distance from the soma and the resting fluorescence level of the soma.
a, An example of spiking throughout all imaged branches during 3 plane imaging. Co-acquired somatic and dendritic time-series were recorded using three planes; Dendritic plane 1 is approximately mid distance between the soma and dendrite tips, Dendritic plane 2 is near the branch tips. Numbered arrows indicate branches connected to the imaged soma with the same numbers in dendritic plane 1 and 2 indicating the same branch. An example run through the cell’s somatic place field (gray) and corresponding ΔF/F traces from the soma and numbered branches from the two dendritic planes is shown. Distance along dendrite between branch and soma, and % distance from soma to dendritic tip, are on the right of each trace. b, Same as a, except a different cell where branch spiking is absent throughout all imaged branches in both dendritic planes. c, Scatter plot showing the average Branch Spike Prevalence for individual branches during somatic firing as a function of branch distance from the soma (each point represents one branch). The average Branch Spike Prevalence for individual branches is not significantly related to the distance from the soma (Spearman’s rank correlation coefficient: P = 0.16; rho = −0.128). d, Branch spike peaks normalized to co-occurring somatic peaks during place field traversals from all place cells and branches plotted against branch distance from soma. Spearman’s rank correlation coefficient shows a significant correlation (P = 5.4 × 10⁻¹², rho = 0.135) and a linear fit shows a significant positive slope within 95% confidence bounds. e, Histogram showing the branch spike prevalence for individual dendritic branches taken from all cells. f, Average branch spike prevalence (for each place field) plotted against the number of branches sampled in the imaging field shows no significant correlation (Spearman’s rank correlation coefficient: P = 0.75; rho = −0.057). g, Average branch spike prevalence (for each place field) plotted against normalized resting fluorescence intensity of the soma. Relative resting fluorescence between cells was calculated by dividing the mean measured fluorescence of each soma (not during transients; excluding nucleus) by the squared laser power arriving at the soma (which was estimated based on the soma depth below the surface (Gobel, et al., 2007)). Spearman’s rank correlation coefficient shows no significant correlation (P = 0.9; rho = −0.034).
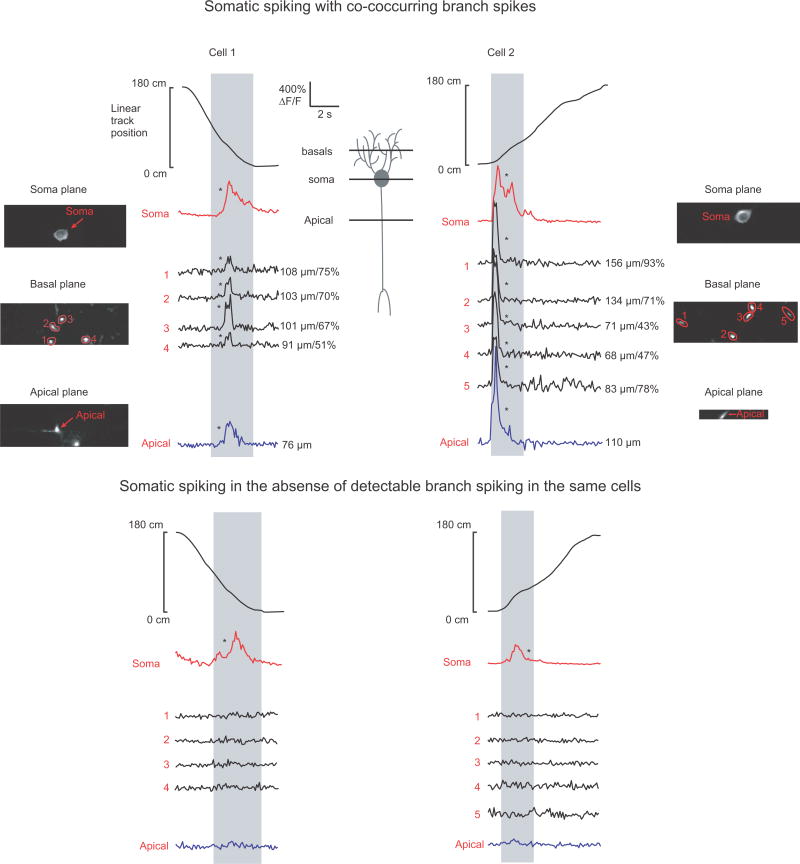
Extended Data Figure 6. Place field branch spikes in basal and proximal apical dendrites often co-occur.
Co-acquired somatic, basal dendritic and apical dendritic (depicted in cartoon in the center) time-series from two example place cells showing somatic spiking with co-occurring branch spikes (top) and somatic spiking in the absence of detectable branch spikes (bottom) in the basal and main apical dendrites (89.6 ± 19.5 % correlation between spiking in the basals and main apical; mean distance of apical site to soma = 109 ± 38 μm; n = 6 place fields) during place field traversals (gray). Note that our findings from the basal and proximal apical dendrites may not extend to the oblique dendrites or apical tuft.
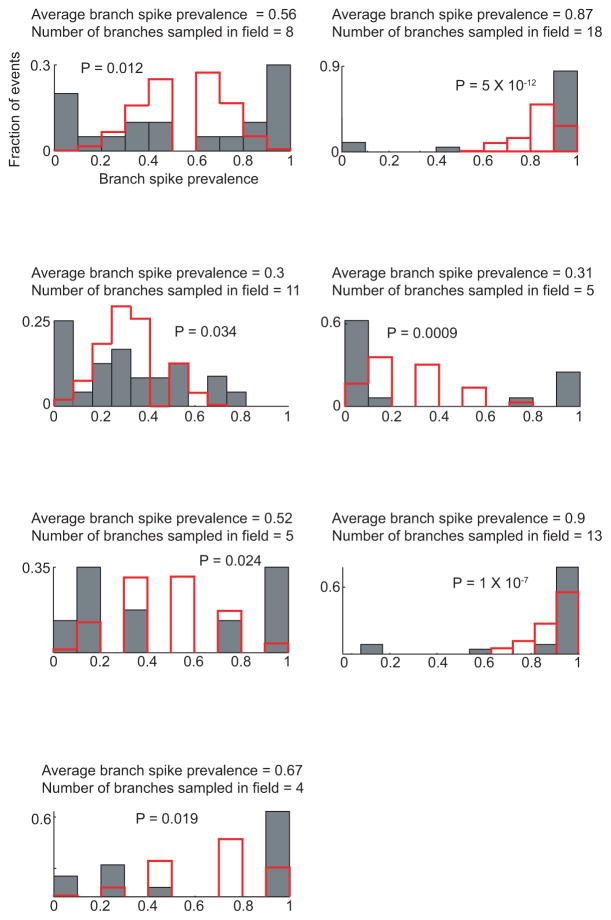
Extended Data Figure 7. The distribution of branch spikes prevalence differs from a model in which each branch fires independently with a specific probability during place field traversals.
7 histograms from 7 example place fields showing the distribution of branch spike prevalence in each field for real data (gray bars) and modeled data (red bars). The modeled data was generated for each place field example as follows. The probability (Pi) that each dendritic branch (i) in the imaging field would spike in the place field was defined as the branch spike prevalence for the individual branch (total number of traversals in which branch i spiked divided by the total number of traversals; from real data). For modeled/mock place field traversals, each branch fired with its random probability Pi and the branch spike prevalence (fraction of the total number of branches with spikes during the traversal) was calculated. The distribution of branch spike prevalence was generated for 1000 modeled/mock place field traversals (red bars). A two-sample Kolmogorov-Smirnov test was used to compare real and modeled distributions (P-values shown in each plot).
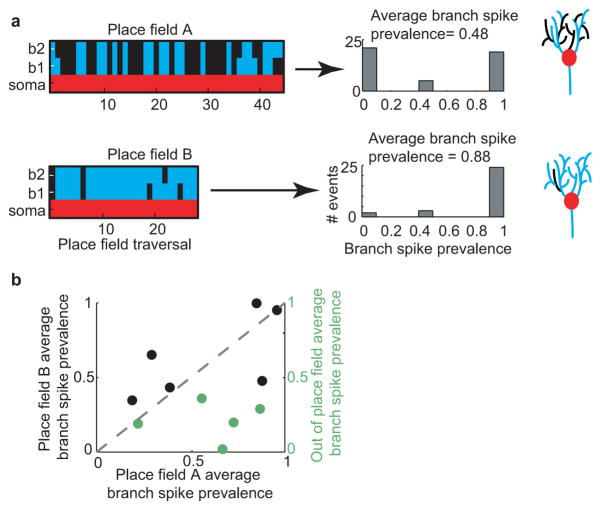
Extended Data Figure 8. Average branch spike prevalence can differ between different place fields of the same cell and also between in-place-field and out-of-place-field somatic firing.
a. Colored plots (left) show occurrence of detectable spiking in each branch (blue or black) during somatic place field firing (red) in different co-occurring place fields (A and B, in different running directions) of the same place cell. Middle, Histograms of branch spike prevalence on each traversal for the two place fields. Cartoons (far right) do not represent real data. Note that the running behavior differed in the two running directions causing differences in the number of traversals reaching behavior criteria. b. Plot comparing average branch spike prevalence of two distinct place fields in the same place cells (black) or of in-place-field versus out-of-place-field somatic firing in the same cells (green).
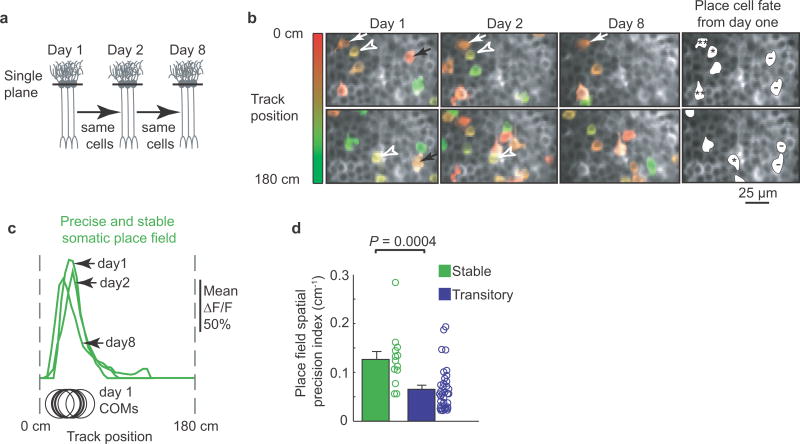
Extended Data Figure 9. Place field spatial precision is correlated to place field stability.
a, Schematic showing single plane imaging of the same population of cell somata over multiple days (1, 2 and 7). b, Population images with place cells color coded by their place field location. Top and bottom rows show place cells in the negative and positive track running directions, respectively. Examples of place cell field fate shown at right: transitory fields occurring on day 1 only (-,right; black arrows left), fields persisting for at least one day (* right, white open arrowheads) or seven days (**right; white arrows); no symbol indicates field did not meet the criteria for inclusion (see methods). c, Mean fields of the same cell measured over different days with COM locations from day 1 (bottom; black circles) indicating a precise place field. d, Spatial precision is significantly higher in stable versus transitory place fields (0.127 ± 0.016 cm−1 versus 0.065 ± 0.007 cm−1, respectively; t test: P = 0.0003). In d, individual data points are depicted by circles to the right of bars and error bars represent SEM.
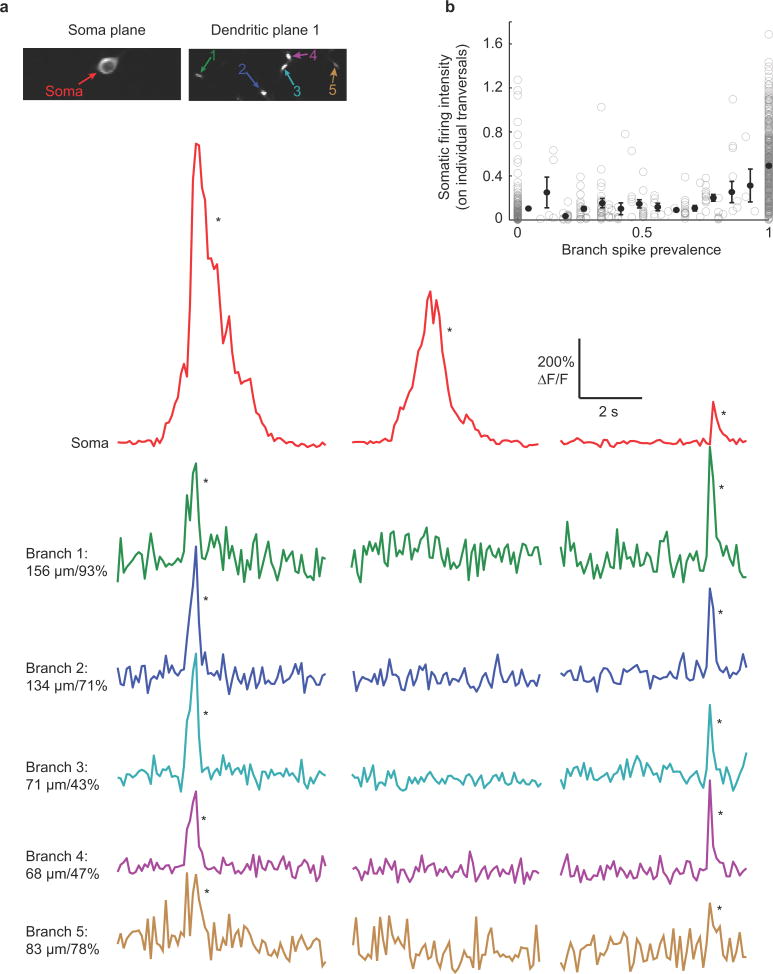
Extended Data Figure 10. Examples of dissociation between somatic firing and branch spiking in a place cell.
a. ΔF/F traces from the (co-acquired) soma and numbered dendritic branches of a place cell during the same imaging session demonstrate that somatic firing and branch spiking are often dissociated. b. Plot of somatic firing intensity versus BSP for all individual place field traversals from all cells (open circles) and binned (solid circles/line). Branch spiking did not strongly correlate with mean (binned) somatic firing intensity (Spearman’s rank correlation coefficient: P = 0.04; rho = 0.57).
Supplementary Material
Acknowledgments
We are grateful to B. Mensh for discussions on data conceptualization, interpretation and presentation. We thank C. Harvey, B. Mensh, N. Spruston, C. Woolley, W. Kath and L. Looger for comments on the manuscript, E. Han and P. Boueri for technical assistance, and V. Jayaraman, R. Kerr, D. Kim, L. Looger, K. Svoboda from the GENIE Project (Janelia Farm, Howard Hughes Medical Institute) for GCaMP6. This work was supported by: The Klingenstein Foundation, The Whitehall Foundation, The Chicago Biomedical Consortium with support from the Searle Funds at The Chicago Community Trust, Northwestern University, The NIH (1R01MH101297), and M.S. is an Ellison Medical Foundation Fellow of the Life Sciences Research Foundation.
Footnotes
Author contributions: M.S. performed the experiments, D.D. built the experimental apparatus, M.S. performed data analysis with strategy suggestions from D.D. Both authors conceived and designed the experiments, interpreted the data and wrote the paper.
Competing financial interests
The authors declare no competing financial interests.
References
- 1.Dombeck DA, Harvey CD, Tian L, Looger LL, Tank DW. Functional imaging of hippocampal place cells at cellular resolution during virtual navigation. Nat Neurosci. 2010;13:1433–1440. doi: 10.1038/nn.2648. [DOI] [PMC free article] [PubMed] [Google Scholar]
- 2.Kentros C, et al. Abolition of long-term stability of new hippocampal place cell maps by NMDA receptor blockade. Science. 1998;280:2121–2126. doi: 10.1126/science.280.5372.2121. [DOI] [PubMed] [Google Scholar]
- 3.Lee D, Lin BJ, Lee AK. Hippocampal place fields emerge upon single-cell manipulation of excitability during behavior. Science. 2012;337:849–853. doi: 10.1126/science.1221489. [DOI] [PubMed] [Google Scholar]
- 4.Ziv Y, et al. Long-term dynamics of CA1 hippocampal place codes. Nat Neurosci. 2013;16:264–266. doi: 10.1038/nn.3329. [DOI] [PMC free article] [PubMed] [Google Scholar]
- 5.Mizuseki K, Royer S, Diba K, Buzsaki G. Activity dynamics and behavioral correlates of CA3 and CA1 hippocampal pyramidal neurons. Hippocampus. 2012;22:1659–1680. doi: 10.1002/hipo.22002. [DOI] [PMC free article] [PubMed] [Google Scholar]
- 6.Kentros CG, Agnihotri NT, Streater S, Hawkins RD, Kandel ER. Increased attention to spatial context increases both place field stability and spatial memory. Neuron. 2004;42:283–295. doi: 10.1016/s0896-6273(04)00192-8. [DOI] [PubMed] [Google Scholar]
- 7.Rotenberg A, Mayford M, Hawkins RD, Kandel ER, Muller RU. Mice expressing activated CaMKII lack low frequency LTP and do not form stable place cells in the CA1 region of the hippocampus. Cell. 1996;87:1351–1361. doi: 10.1016/s0092-8674(00)81829-2. [DOI] [PubMed] [Google Scholar]
- 8.Burgess N, O’Keefe J. Neuronal computations underlying the firing of place cells and their role in navigation. Hippocampus. 1996;6:749–762. doi: 10.1002/(SICI)1098-1063(1996)6:6<749::AID-HIPO16>3.0.CO;2-0. [DOI] [PubMed] [Google Scholar]
- 9.Solstad T, Moser EI, Einevoll GT. From grid cells to place cells: a mathematical model. Hippocampus. 2006;16:1026–1031. doi: 10.1002/hipo.20244. [DOI] [PubMed] [Google Scholar]
- 10.Grienberger C, Chen X, Konnerth A. NMDA Receptor-Dependent Multidendrite Ca(2+) Spikes Required for Hippocampal Burst Firing In Vivo. Neuron. 2014;81:1274–1281. doi: 10.1016/j.neuron.2014.01.014. [DOI] [PubMed] [Google Scholar]
- 11.Hill DN, Varga Z, Jia H, Sakmann B, Konnerth A. Multibranch activity in basal and tuft dendrites during firing of layer 5 cortical neurons in vivo. Proc Natl Acad Sci U S A. 2013;110:13618–13623. doi: 10.1073/pnas.1312599110. [DOI] [PMC free article] [PubMed] [Google Scholar]
- 12.Zhou WL, Yan P, Wuskell JP, Loew LM, Antic SD. Dynamics of action potential backpropagation in basal dendrites of prefrontal cortical pyramidal neurons. Eur J Neurosci. 2008;27:923–936. doi: 10.1111/j.1460-9568.2008.06075.x. [DOI] [PMC free article] [PubMed] [Google Scholar]
- 13.Magee JC, Johnston D. A synaptically controlled, associative signal for Hebbian plasticity in hippocampal neurons. Science. 1997;275:209–213. doi: 10.1126/science.275.5297.209. [DOI] [PubMed] [Google Scholar]
- 14.Spruston N, Schiller Y, Stuart G, Sakmann B. Activity-dependent action potential invasion and calcium influx into hippocampal CA1 dendrites. Science. 1995;268:297–300. doi: 10.1126/science.7716524. [DOI] [PubMed] [Google Scholar]
- 15.Ariav G, Polsky A, Schiller J. Submillisecond precision of the input-output transformation function mediated by fast sodium dendritic spikes in basal dendrites of CA1 pyramidal neurons. J Neurosci. 2003;23:7750–7758. doi: 10.1523/JNEUROSCI.23-21-07750.2003. [DOI] [PMC free article] [PubMed] [Google Scholar]
- 16.Gasparini S, Migliore M, Magee JC. On the initiation and propagation of dendritic spikes in CA1 pyramidal neurons. J Neurosci. 2004;24:11046–11056. doi: 10.1523/JNEUROSCI.2520-04.2004. [DOI] [PMC free article] [PubMed] [Google Scholar]
- 17.Losonczy A, Magee JC. Integrative properties of radial oblique dendrites in hippocampal CA1 pyramidal neurons. Neuron. 2006;50:291–307. doi: 10.1016/j.neuron.2006.03.016. [DOI] [PubMed] [Google Scholar]
- 18.Golding NL, Staff NP, Spruston N. Dendritic spikes as a mechanism for cooperative long-term potentiation. Nature. 2002;418:326–331. doi: 10.1038/nature00854. [DOI] [PubMed] [Google Scholar]
- 19.Schiller J, Schiller Y, Clapham DE. NMDA receptors amplify calcium influx into dendritic spines during associative pre- and postsynaptic activation. Nat Neurosci. 1998;1:114–118. doi: 10.1038/363. [DOI] [PubMed] [Google Scholar]
- 20.Wu XE, Mel BW. Capacity-enhancing synaptic learning rules in a medial temporal lobe online learning model. Neuron. 2009;62:31–41. doi: 10.1016/j.neuron.2009.02.021. [DOI] [PMC free article] [PubMed] [Google Scholar]
- 21.Chen TW, et al. Ultrasensitive fluorescent proteins for imaging neuronal activity. Nature. 2013;499:295–300. doi: 10.1038/nature12354. [DOI] [PMC free article] [PubMed] [Google Scholar]
- 22.Harvey CD, Collman F, Dombeck DA, Tank DW. Intracellular dynamics of hippocampal place cells during virtual navigation. Nature. 2009;461:941–946. doi: 10.1038/nature08499. [DOI] [PMC free article] [PubMed] [Google Scholar]
- 23.Svoboda K, Denk W, Kleinfeld D, Tank DW. In vivo dendritic calcium dynamics in neocortical pyramidal neurons. Nature. 1997;385:161–165. doi: 10.1038/385161a0. [DOI] [PubMed] [Google Scholar]
- 24.Kamondi A, Acsady L, Buzsaki G. Dendritic spikes are enhanced by cooperative network activity in the intact hippocampus. J Neurosci. 1998;18:3919–3928. doi: 10.1523/JNEUROSCI.18-10-03919.1998. [DOI] [PMC free article] [PubMed] [Google Scholar]
- 25.Smith SL, Smith IT, Branco T, Hausser M. Dendritic spikes enhance stimulus selectivity in cortical neurons in vivo. Nature. 2013;503:115–120. doi: 10.1038/nature12600. [DOI] [PMC free article] [PubMed] [Google Scholar]
- 26.Palmer LM, et al. NMDA spikes enhance action potential generation during sensory input. Nat Neurosci. 2014;17:383–390. doi: 10.1038/nn.3646. [DOI] [PubMed] [Google Scholar]
- 27.Barry C, Burgess N. Learning in a geometric model of place cell firing. Hippocampus. 2007;17:786–800. doi: 10.1002/hipo.20324. [DOI] [PubMed] [Google Scholar]
- 28.McHugh TJ, Blum KI, Tsien JZ, Tonegawa S, Wilson MA. Impaired hippocampal representation of space in CA1-specific NMDAR1 knockout mice. Cell. 1996;87:1339–1349. doi: 10.1016/s0092-8674(00)81828-0. [DOI] [PubMed] [Google Scholar]
- 29.Miller KD. Synaptic economics: competition and cooperation in synaptic plasticity. Neuron. 1996;17:371–374. doi: 10.1016/s0896-6273(00)80169-5. [DOI] [PubMed] [Google Scholar]
- 30.Gordon U, Polsky A, Schiller J. Plasticity compartments in basal dendrites of neocortical pyramidal neurons. J Neurosci. 2006;26:12717–12726. doi: 10.1523/JNEUROSCI.3502-06.2006. [DOI] [PMC free article] [PubMed] [Google Scholar]
- 31.Dombeck DA, Khabbaz AN, Collman F, Adelman TL, Tank DW. Imaging large-scale neural activity with cellular resolution in awake, mobile mice. Neuron. 2007;56:43–57. doi: 10.1016/j.neuron.2007.08.003. [DOI] [PMC free article] [PubMed] [Google Scholar]
- 32.Pologruto TA, Sabatini BL, Svoboda K. ScanImage: flexible software for operating laser scanning microscopes. Biomed Eng Online. 2003;2:13. doi: 10.1186/1475-925X-2-13. [DOI] [PMC free article] [PubMed] [Google Scholar]
- 33.Grewe BF, Voigt FF, van ‘t Hoff M, Helmchen F. Fast two-layer two-photon imaging of neuronal cell populations using an electrically tunable lens. Biomed Opt Express. 2011;2:2035–2046. doi: 10.1364/BOE.2.002035. [DOI] [PMC free article] [PubMed] [Google Scholar]
- 34.Miri A, Daie K, Burdine RD, Aksay E, Tank DW. Regression-based identification of behavior-encoding neurons during large-scale optical imaging of neural activity at cellular resolution. J Neurophysiol. 2011;105:964–980. doi: 10.1152/jn.00702.2010. [DOI] [PMC free article] [PubMed] [Google Scholar]
- 35.Longair MH, Baker DA, Armstrong JD. Simple Neurite Tracer: open source software for reconstruction, visualization and analysis of neuronal processes. Bioinformatics. 2011;27:2453–2454. doi: 10.1093/bioinformatics/btr390. [DOI] [PubMed] [Google Scholar]
- 36.Mukamel EA, Nimmerjahn A, Schnitzer MJ. Automated analysis of cellular signals from large-scale calcium imaging data. Neuron. 2009;63:747–760. doi: 10.1016/j.neuron.2009.08.009. [DOI] [PMC free article] [PubMed] [Google Scholar]
- 37.Greenberg DS, Houweling AR, Kerr JN. Population imaging of ongoing neuronal activity in the visual cortex of awake rats. Nat Neurosci. 2008;11:749–751. doi: 10.1038/nn.2140. [DOI] [PubMed] [Google Scholar]
- 38.Kerr JN, Greenberg D, Helmchen F. Imaging input and output of neocortical networks in vivo. Proc Natl Acad Sci U S A. 2005;102:14063–14068. doi: 10.1073/pnas.0506029102. [DOI] [PMC free article] [PubMed] [Google Scholar]
- 39.Tian L, et al. Imaging neural activity in worms, flies and mice with improved GCaMP calcium indicators. Nat Methods. 2009;6:875–881. doi: 10.1038/nmeth.1398. [DOI] [PMC free article] [PubMed] [Google Scholar]
- 40.Cox CL, Denk W, Tank DW, Svoboda K. Action potentials reliably invade axonal arbors of rat neocortical neurons. Proc Natl Acad Sci U S A. 2000;97:9724–9728. doi: 10.1073/pnas.170278697. [DOI] [PMC free article] [PubMed] [Google Scholar]
- 41.Petreanu L, et al. Activity in motor-sensory projections reveals distributed coding in somatosensation. Nature. 2012;489:299–303. doi: 10.1038/nature11321. [DOI] [PMC free article] [PubMed] [Google Scholar]
- 42.Helmchen F, Svoboda K, Denk W, Tank DW. In vivo dendritic calcium dynamics in deep-layer cortical pyramidal neurons. Nat Neurosci. 1999;2:989–996. doi: 10.1038/14788. [DOI] [PubMed] [Google Scholar]
- 43.Mittmann W, et al. Two-photon calcium imaging of evoked activity from L5 somatosensory neurons in vivo. Nat Neurosci. 2011;14:1089–1093. doi: 10.1038/nn.2879. [DOI] [PubMed] [Google Scholar]
- 44.Higley MJ, Sabatini BL. Calcium signaling in dendrites and spines: practical and functional considerations. Neuron. 2008;59:902–913. doi: 10.1016/j.neuron.2008.08.020. [DOI] [PubMed] [Google Scholar]
- 45.Chen X, Leischner U, Rochefort NL, Nelken I, Konnerth A. Functional mapping of single spines in cortical neurons in vivo. Nature. 2011;475:501–505. doi: 10.1038/nature10193. [DOI] [PubMed] [Google Scholar]
- 46.Sabatini BL, Oertner TG, Svoboda K. The life cycle of Ca(2+) ions in dendritic spines. Neuron. 2002;33:439–452. doi: 10.1016/s0896-6273(02)00573-1. [DOI] [PubMed] [Google Scholar]
- 47.Yuste R, Denk W. Dendritic spines as basic functional units of neuronal integration. Nature. 1995;375:682–684. doi: 10.1038/375682a0. [DOI] [PubMed] [Google Scholar]
Associated Data
This section collects any data citations, data availability statements, or supplementary materials included in this article.


