

Abstract
Purkinje cells contain sarcoplasmic reticulum (SR) directly under the surface membrane, are devoid of t-tubuli, and are packed with myofibrils surrounded by central SR. Several studies have reported that electrical excitation induces abiphasic Ca2+ transient in Purkinje fiber bundles. We determined the nature of the biphasic Ca2+ transient in aggregates of Purkinje cells. Aggregates (n=12) were dispersed from the subendocardial Purkinje fiber network of normal canine left ventricle, loaded with Fluo-3/AM, and studied in normal Tyrode's solution (24°C). Membrane action potentials were recorded with fine-tipped microelectrodes, and spatial and temporal changes in [Ca2+]i were obtained from fluorescent images with an epifluorescent microscope (×20; Nikon). Electrical stimulation elicited an action potential as well as a sudden increase in fluorescence (L0) compared with resting levels. This was followed by a further increase in fluorescence (L1) along the edges of the cells. Fluorescence then progressed toward the Purkinje cell core (velocity of propagation 180 to 313 μm/s). In 62% of the aggregates, initial fluorescent changes of L0 were followed by focally arising Ca2+ waves (L2), which propagated at 158± 14 μm/s (n= 13). Spontaneous Ca2+ waves (L2*) propagated like L2 (164±10 μm/s) occurred between stimuli and caused slow membrane depolarization; 28% of L2* elicited action potentials. Both spontaneous Ca2+ wave propagation and resulting membrane depolarization were thapsigargin sensitive. Early afterdepolarizations were not accompanied by Ca2+ waves. Action potentials in Purkinje aggregates induced a rapid rise of Ca2+ through ICaL and release from a subsarcolemmal compartment (L0). Ca2+ release during L0 either induced further Ca2+ release, which propagated toward the cell core (L1), or initiated Ca2+ release from small regions and caused L2 Ca2+ waves, which propagated throughout the aggregate. Spontaneous Ca2+ waves (L2*) induce action potentials.
Keywords: Purkinje fibers, action potentials, Ca2+, electrophysiology, automaticity
Electrical excitation induces a biphasic Ca2+ transient (L1 and L2, as in Wier and Isenberg1) in free running Purkinje fiber strands. Although it is assumed that some of the features of excitation-contraction (EC) coupling in ventricular myocytes are similar to those of Purkinje cells from normal hearts, little is known about the details of this process. Purkinje myocytes lack t-tubules, have 2 types of sarcoplasmic reticulum (SR) (junctional and corbular, or nonjunctional),2,3 and contain 25% by volume of myofibrils surrounded by the corbular SR. Although the role of corbular SR has gained importance recently in our understanding of the mechanism of EC coupling in the slender atrial myocyte,4–7 we still know little about EC coupling in Purkinje cells. Therefore, we studied the mechanism that underlies the biphasic Ca2+ transient reported for Purkinje fiber strands by determining changes in Fluo-3 fluorescence in tightly coupled aggregates of Purkinje myocytes dispersed from normal hearts.
Materials and Methods
Aggregates of Purkinje cells (2 to 6 cells each aggregate, n=12, width 35 to 56 μm, length 157 to 314 μm) were enzymatically dispersed from the subendocardial Purkinje network of the normal canine left ventricle according to previously described techniques2 and placed into a specially designed chamber for epifluorescent/microelectrode recordings. Cells were continuously superfused with normal Tyrode's solution (4 mmol/L Ko, 2 mmol/L Cao). We previously established that this model is suitable for electrical studies.2,8–11
Aggregate/Cell Selection for Fluorescent Measurements
Cells were selected for study on the basis of previously determined criteria2,10; that is, we used only Purkinje cells that were rod shaped with typical junctional ends,2 clear striations, and surface membranes that were free of blebs. For some experiments, we selected aggregates of Fluo-3/AM–loaded Purkinje myocytes that exhibited nondriven rhythmic activity in Tyrode's solution at 23°C to 24°C. Aggregates of cells of inhomogeneous thickness or with branches out of the field of view were not imaged. After obtaining an electrical recording from a myocyte in the aggregate using standard microelectrode techniques,2 we recorded fluorescence images during electrical activity. Action potentials were evoked with extracellular field stimulation12; in this way, we could determine the spatiotemporal changes in Fluo-3 fluorescence concomitant with transmembrane voltage changes.
Fluorescent Measures: Data Acquisition
The single-wavelength Ca2+-sensitive dye Fluo-3 was used for these experiments. This dye exhibits greater fluorescence intensity than the dual-excitation dye Fura-2. In addition, because Fluo-3 is excited at longer wavelengths, the light does not result in UV damage to the cells during prolonged experiments. Finally, although the use of a single-wavelength dye has the potential to produce motion artifacts, it provides the temporal resolution that was essential for the present study. For imaging experiments, cells were allowed to settle onto the coverslip at the bottom of the superfusion chamber and then were loaded with 4 μmol/L Fluo-3/AM for 20 minutes without superfusion. Aggregates were then continuously superfused with normal Tyrode's solution for ≥10 minutes before measurements were made.
To achieve the maximal temporal resolution without the loss of spatial quality associated with video recordings, images were streamed directly to a Panasonic optical disk recorder at video frame rate and analyzed offline (Photon Technology International). For imaging, light from a xenon lamp was passed through monochromators to provide excitation (485 nm) into the fluorescent port of an inverted Zeiss microscope equipped with a ×20 objective. The fluorescent light (at 525 nm) was passed through a 520-nm barrier filter located in the emission path into a CCD camera coupled to an intensifier plate (Higain Videoscope Camera, Technology International).
Data Analysis
Changes of intensity in regions of interest (ROIs) on the image were measured for selected frames of the experiment. Data were displayed with the use of Origin, Adobe Photoshop, or Sigmaplot. Parameters of movement of Ca2+ waves were determined from light intensity profiles of the processed fluorescence images. Upward deflections indicate fluorescence changes corresponding to a local increase in intracellular Ca2+ (Ca2+i). For analysis, several ROIs were set along the long or short axis of the aggregate, and the average (median) intensity levels of the given set of pixels were calculated with PTI software. Wave velocity was calculated from positions of Ca2+ transients over time from the steepest midportion of the transient. In some aggregates, Ca2+ waves propagated in a transverse direction. These data are not included in the present analysis.
Results
Effects of Electrical Stimulation on Ca2+i in Aggregates of Normal Purkinje Myocytes
Electrical stimulation elicited an action potential as well as an acute increase in fluorescence (L0) (Figure 1A, frames 132, 133, and 134) over resting levels. In 4 aggregates, 14 paced beats were analyzed, and the average intensity change of L0 was 23 ±1.2 U, representing a ≈63% increase over resting fluorescence. A 63% increase in Fluo-3 fluorescence corresponds to an increase in free Ca2+ from 100 to ≈200 nmol/L, as derived from the equation [Ca2+] =KR/[K+/([Ca2+]rest+1)−R].13 This initial L0 was part of the rising phase of a further increase in fluorescence (L1) (Figure 1B), which traveled from the long edges of the aggregate (Figure 1A, frames 135 through 139) toward the core of the aggregate.
Figure 1.
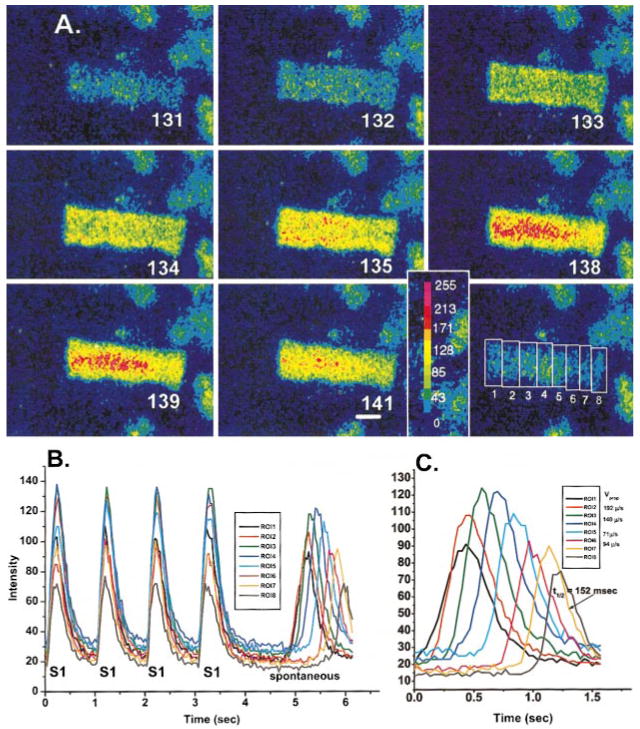
A, Selected image frames from a sequence of frames of a Purkinje cell aggregate during extracellular stimulation (S1) at 1-second cycle length. Change in intensity of fluorescent signal is depicted by color change as shown in color bar (bottom right). Numbers indicate individual frame numbers. Bottom right, position of the various ROIs measured and plotted in B. Calibration bar=27 μm. B, Change in intensity of fluorescence at various ROIs during 4 S1 and after a pause and during a period of nonstimulation. Note the occurrence of a spontaneous Ca2+ wave (see text for more detail). Frames illustrated in A are taken from the first S1. C, Spontaneous Ca2+ wave of B on an expanded time scale. Inset, Measured Vprop of the Ca2+ wave between various ROI pairs. T1/2 refers to measured time to half-relaxation of Ca2+ transient at ROI 7. Note the striking uniformity of propagation of the Ca2+ wave in this aggregate. For movie forms of figures, a Web site is available at www.cvr.ucalgary.ca/slideshow.
In 62% of paced aggregates, all sites within an aggregate showed an acute increase in fluorescence on stimulation (L0 in isolation) with no related L1 increase in fluorescence traveling toward the core (Figure 2, frame 228). In this example, L0 was followed within ≤40 ms by a focally arising Ca2+ wave (L2) that propagated (Figures 2A and 2B, frames 232 to 248), reaching maximal amplitude at 609 ms (Figure 2C). For all aggregates, the peak of L2 waves reached a maximum within 397±50 ms of the start of L0, and velocity of propagation (Vprop) was 158±14 μm/s (n=13). Note that repetitive stimulation enhances the amplitude of the L0 component relatively little in some ROIs (eg, Figure 2B, black tracings, ROIs 3 to 6, with an average 18% increase over the 3 stimuli) compared with that in other ROIs (eg, ROIs 7 to 9, 40% increase), suggesting that L0 depends little on a mechanism that stores Ca2+. In the case illustrated, in 1 area (ROI 7; Figure 2C), these increases appear to set off a traveling Ca2+ wave (ROI 7 to 8), as shown in Figure 2A. This wave travels longitudinally down along the aggregate. When 2 Ca2+ waves originate in different regions of the same aggregate (each set off by L0), they each propagate and collide without summation (Figure 2A, frame 239). Time to half-relaxation (t1/2) of L0 in “isolation” (402±5 ms, n=6) is greater than t1/2 of either L1 (165±14 ms, n=10) or L2 (176±21 ms, n=5), but note that t1/2 values for Ca2+ transients of L1 and L2 are similar.
Figure 2.
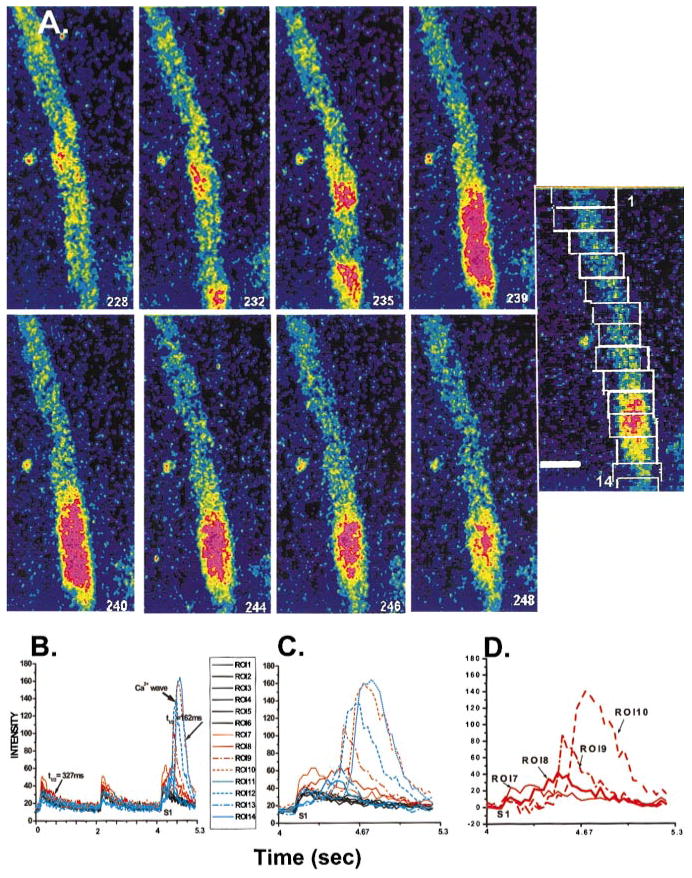
A, Selected image frames of a Purkinje cell aggregate during the last of a train of stimuli (S1) seen in B. Note that during L0 in isolation (see text), small focal areas of Ca2+ increase at 2 separate foci within aggregate (frame 232). Each focus gives rise to a Ca2+ wave that propagates along the aggregate but in opposite directions. By frame 239, the 2 Ca2+ waves have merged (collided) but did not summate. Reuptake of Ca2+ at the site of the collision occurs over the next several frames. The image to the right indicates the position of 1 to 14 ROIs (top box is ROI 1). Borders of ROIs have been retouched for clarity. Calibration bar=52.5 μm. B, Change in intensity of fluorescence at 14 ROIs indicated in A. Images are from tracings of S1 indicated. T1/2 values indicated are time to half-relaxation of Ca2+i transient that is predominately L0 (327 ms) and L2* (162 ms). C, Changes in intensity of fluorescence at all ROIs during S1 indicated in B. Note that L0 in isolation is most visible in ROIs 1 to 6. Note also that Ca2+i changes occurring at ROI 7 precede the Ca2+ wave event depicted in A. D, ROIs 7 to 10 difference transients (obtained by subtracting average L0 Ca2+i change from original tracings) clearly show that focal Ca2+i change at ROI 7 occurs within 61 ms after the onset of L0 and precedes (initiates) the Ca2+i change at ROI 8, leading to the Ca2+ wave shown in B (as seen in ROIs 9 and 10).
Vprop of L1 was determined in the manner depicted in Figure 3A. For these plots, intensity values normalized to ROI area (Figure 3B) are presented in graph format for frames that correspond to each S1 depicted in Figure 1B. Note the lag in the activation of the Ca2+ transient of the central ROI, suggesting that Ca2+ of the outer region propagates to the cell core. For these paced beats, Vprop determined from midpoint to midpoint of Ca2+ transients ranged from 241 to 313 μm/s, whereas Vprop determined from the peaks of the outer ROI to the peak of the central ROI transient ranged from 245 to 346 μm/s.
Figure 3.
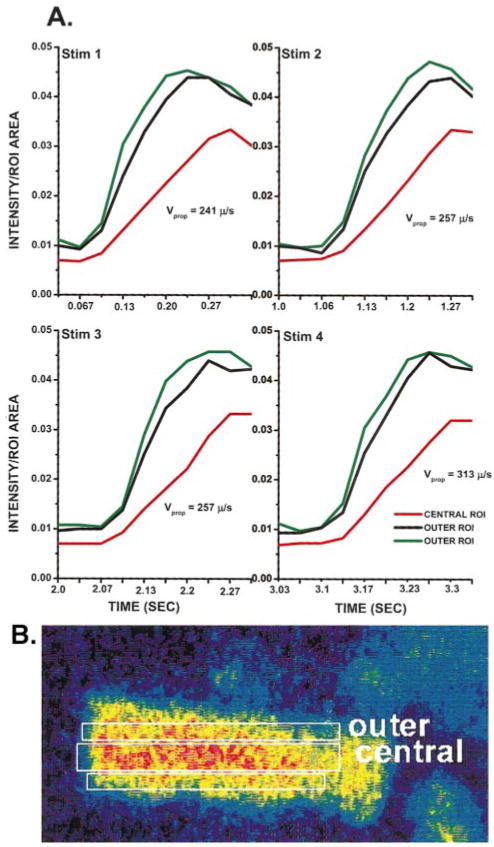
Vprop in transverse direction (from cell outer edge to central cell area) of Ca2+ wave of Figure 1 was determined with an ROI configuration on the aggregate as shown in B. A, Time course of the ROI transients obtained for each of the extracellular stimuli (stim) shown in Figure 1B. Note that Ca2+i transients of outer ROIs (green and black) rise before central ROIs (red). Vprop calculated from midpoint of transients of outer to central ROIs is indicated for each stimulus.
Spontaneous Ca2+ Waves May Initiate Action Potentials in Purkinje Cell Aggregates
In a subset of aggregates, focally arising Ca2+ waves (L2*) occurred in the absence of electrical stimulation (no L0) (Figures 1B and 1C). These spontaneous Ca2+ waves appeared to originate at cell borders (edges) (Figure 4A, frame 14) and propagated longitudinally (Vprop=164±10 μm/s, n=18). Five of 18 of these Ca2+ waves (28%) elicited an acute synchronous event, L0 (Figure 4A, frame 28), which then caused L1 to propagate transversely in front of the longitudinal L2*. This suggests that propagating Ca2+ waves that are spontaneous cause sufficient depolarization of the membrane to cause an action potential (Figures 4C and 4D), which in turn induces the new combination of L0 and L1 just like other action potentials. Note also in Figure 4 (frames 26 to 28) that there is no further rise in Ca2+ after the action potential at sites at which Ca2+ is already elevated. This is similar to our earlier observation that 2 spontaneous Ca2+ waves collide without summation (Figure 2) and subsequently fail to further propagate. Figure 4 also illustrates that L1 and L2* may have the same cellular mechanisms for Ca2+ release. This is emphasized by the fact that when L1 is generated, there is no further propagation of L2* in the longitudinal direction. Finally, note that L0 in the region surrounding the spontaneous wave shows a clear increase in Ca2+. Therefore, either the propagating wave did not yet reach the edge, or it did reach the edge but did not leave the SR in that region refractory. The former is unlikely because that the wave starts in exactly the same region that generates a robust L0 120 ms later.
Figure 4.
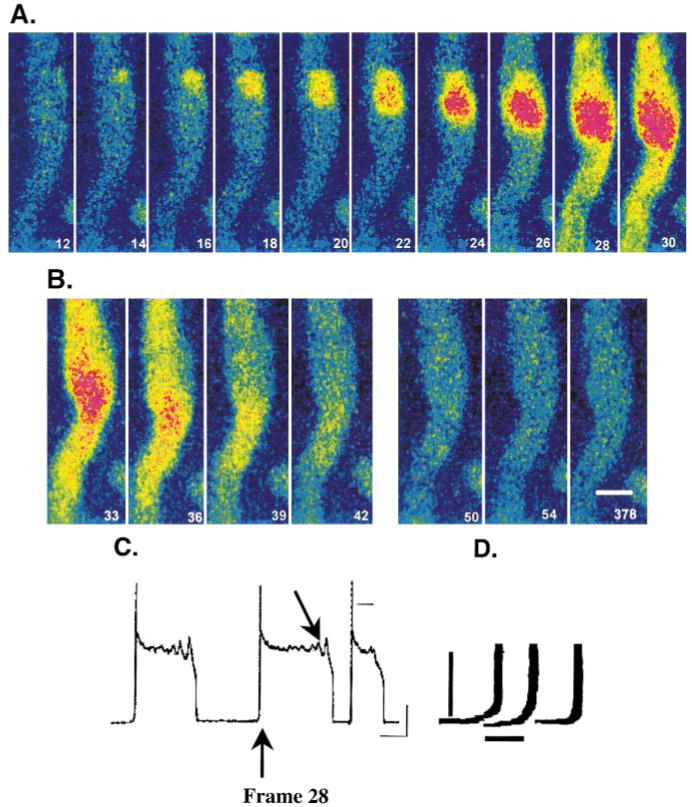
A, Selected image frames of a Purkinje aggregate where small focal change in Ca2+ (frame 14) initiates a synchronized rise of Ca2+i (frame 28). An action potential also resulted at this time (C). As before, the frame number is arbitrary but in sequence. B, Selected image frames (frames 33 to 42) of the same aggregate immediately after the initiation of the action potential showing no Ca2+ wave. Also, selected image frames obtained later during the repolarization phase of the action potential where early afterdepolarizations were present (C) clearly show that propagating Ca2+ waves were absent. Calibration bar=18 μm. C, Transmembrane recordings made with fine-tipped microelectrode of aggregate before, during, and after images depicted in A and B. Note the upstroke of a nondriven action potential occurs during frame 28, and early afterdepolarizations occur during time course of frames 50, 54, and 378 (arrow). Resting potential of this nonstimulated aggregate was −82 mV (4 mmol/L Ko, 2 mmol/L Cao, 24°C). Calibration bars=5 seconds and 20 mV, respectively. Zero potential is indicated by small black line. D, Magnification of upstrokes of the 3 spontaneously occurring action potentials recorded from this aggregate and shown in C. The middle upstroke corresponds to action potential elicited at frame 28 (arrow) by Ca2+ wave of A. Voltage recordings have been retouched for presentation purposes. Calibration bars=1 second and 10 mV.
In this aggregate, membrane repolarization was delayed such that early afterdepolarizations were evident (Figure 4C). However, careful monitoring of images throughout this period clearly showed that these early afterdepolarizations were not accompanied by Ca2+ waves (Figure 4B, frames 50, 54, and 378).
Purkinje Ca2+ Waves and Membrane Depolarization Are Thapsigargin Sensitive
If membrane depolarization of the Purkinje aggregate is secondary to the propagation of a Ca2+ wave elicited by propagation of Ca2+ release from the SR, then an agent known to decrease SR Ca2+ stores should affect wave propagation and concomitant membrane depolarization.
Therefore, while recording subthreshold membrane depolarization and simultaneously imaging an aggregate, we superfused the preparation with 5 μmol/L thapsigargin (Figure 5). Thapsigargin is known to decrease SR Ca2+ stores through inhibition of the Ca2+ reuptake mechanism.14 Under control conditions (drug free), transmembrane potential (≈1 to 3 mV in amplitude) oscillated at an irregular cycle length (2000±326 ms) (Figure 5C). The spatial and temporal changes in Ca2+i that occurred during membrane depolarization (Figure 5C, filled circles) are depicted in Figure 5A. The Vprop of Ca2+ waves during control and with thapsigargin plus 2 minutes averaged 180 μm/s, which is similar to the spontaneous L2* waves described earlier. After 5 minutes of thapsigargin, the cycle length of membrane depolarization increased to 3580±27 ms (Figure 5C), yet the amplitudes of depolarizations remained similar. The constant Vprop of the Ca2+ wave seen in the control setting was no longer evident. By 6 minutes of thapsigargin, membrane depolarization and spontaneous Ca2+ transients were nearly zero. By 7 minutes, depolarization had ceased, and the aggregate was Ca2+i quiescent.
Figure 5.
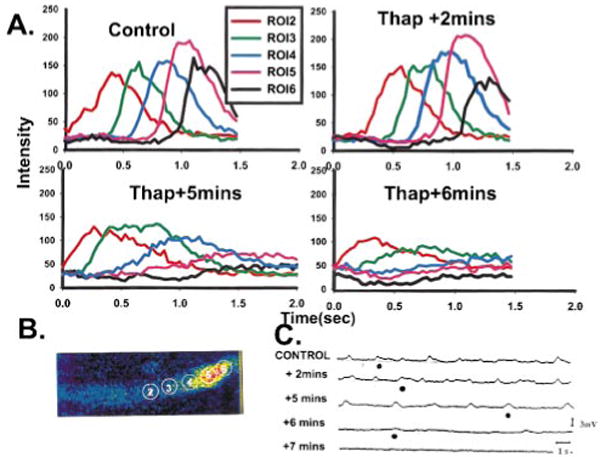
Effects of thapsigargin on changes in membrane potential and fluorescence at 5 ROIs during a propagating Ca2+ wave in a Purkinje aggregate. A, With thapsigargin, there is a reduction in the amplitude of Ca2+i transients as well as decremental conduction of Ca2+ waves (images not shown). B, Selected image of aggregate during control, drug-free period showing a Ca2+ wave and placement of the 5 ROIs depicted in A. C, Transmembrane potential recordings of this aggregate in the absence and presence of thapsigargin. Small depolarizations in membrane potential evident in control were inhibited with thapsigargin. ●, Occurrence of the Ca2+ wave illustrated in A and the time at which data were analyzed for plots of A.
Discussion
The imaging of Ca2+i transients in tightly coupled aggregates of Purkinje cells from normal canine hearts demonstrated that (1) spatiotemporal aspects of EC coupling in Purkinje cells differ from those of working ventricular myocytes, (2) Ca2+ waves propagate through a Purkinje cell aggregate via Ca2+-induced Ca2+ release (CICR), (3) Ca2+ waves that occur in Purkinje cell aggregates can elicit electrical activity, and (4) Ca2+ waves do not accompany early afterdepolarizations in Purkinje cells.
Experimental Considerations
We directly streamed images at 33 Hz to the optical recorder during these experiments so we could increase the likelihood of recording the initiation and perpetuation of Ca2+ waves. Thus, the video frame rate limits the time resolution of the images. This error in sampling changes in Ca2+ in an aggregate may affect observed Ca2+ transients and Ca2+ waves, but we believe that it has not significantly limited our observations on the timing and spread of the Ca2+ transients. For instance, although the actual timing of the start of the Ca2+ wave may not occur at the exact time shown (eg, frame 14 in Figure 4A), our observations still support the conclusion that the Ca2+ wave propagates and causes an electrical impulse. Furthermore, under our study conditions, the Vprop of Ca2+ waves is little affected by the sampling rate because this process itself appears to be slow.
In Figure 3, we show an important lag in the rate of rise of the central Ca2+ transient versus the Ca2+ transient of the outer region. We believe that it is unlikely that our sampling rate caused this lag. With a low sampling rate, we will be incorrectly representing fast events (>10 Hz). If fast events are present during the onset of the Ca2+ transient, they would have been reflected as a large variability in our signal from event to event. Clearly, we did not see this variability (Figure 3). The difference between “central” and peripheral regions evidently is a slow event (6 frames); therefore, the difference is not caused by sampling at 33 Hz.
Ca2+i During EC Coupling: Variations
A local control theory of EC coupling15 is based on experimental functional evidence and the well known ultrastructure of the normal ventricular cell. This theory states that Ca2+i entry is spatially homogeneous and that because SR Ca2+ release sites are coupled tightly to sarcolemmal membrane throughout the cell, including the t-tubuli, subsequent CICR is uniform.
In other cell types, such as the normal atrial myocyte, subcellular gradients of Ca2+ release have been reported.5,6,16,17 In right atrial appendage myocytes from diseased human hearts, dome-shaped Ca2+i transients have been described,4 and the 2 components of the Ca2+i transient could be dissociated from each other with various techniques. Furthermore, immunostaining experiments revealed that ryanodine receptors were located not only near the sarcolemmal but also deeper inside the cell (general cell diameter 10 to 15 μm, high surface-to-volume ratio). Thus, to date, most studies have concluded that during EC coupling in atrial myocytes, Ca2+ entry triggers Ca2+ release from stores located near the surface membrane. These Ca2+ ions subsequently initiate release from the stores in central regions of the cell.5,6,18 What remains unknown is the mechanism by which the Ca2+ ions move from the peripheral subsarcolemmal area to the cell center. There are at least 2 possibilities: Ca2+ diffusion and CICR in combination with diffusion.
Like atrial myocytes, Purkinje cells do not have t-tubuli,2,3 but they have cell diameters in the range of 25 to 30 μm. Although EC coupling and Ca2+i transients have been studied in various multicellular Purkinje fiber preparations,1,19–21 few data exist that define the spatiotemporal changes of Ca2+ in Purkinje cells. One preliminary report22 suggested that Ca2+ transients in Purkinje cells are initiated at the periphery, and then via either simple diffusion or subsequent triggered release, Ca2+ travels to the center of the cell. In this report, we provide evidence that on electrical stimulation, there is a uniform Ca2+ rise along the membrane of the Purkinje cell aggregate (Figure 1) and that Ca2+ does in fact propagate to the central region (Figure 3). On the basis of the following, we conclude that Ca2+ has propagated to the core. We believe it unlikely that large Ca2+i changes that are measured during L1 are due to an artifactual change in fluorescence due to a “thickening” of the specimen or a volume effect. Based on the numerical aperture of the objective used for these recordings (0.75), we estimate the thickness of the area of interest involved in our measurements to be <25% of the thickness of the aggregate. Therefore, the large Ca2+i changes that are observed must be due to true changes of Ca2+ in the core. Furthermore, the change in Ca2+ in the core cannot be due to diffusion alone because it has been shown that Vprop would be substantially slower (<40 μm/s23) than the value we measured (Figure 3), and transients would be expected to decline toward the center. Thus, we predict that Ca2+ has propagated to the core of the Purkinje cell via CICR in combination with diffusion. Notably, these findings were obtained in cells exposed to normal Tyrode's solution (4 mmol/L Ko, 2 mmol/L Cao), with reasonable resting potentials and not under conditions of high SR Ca2+ overload.
Furthermore, with image analysis, we have shown that after a small Ca2+ rise (after the upstroke of an action potential), spontaneous, large Ca2+ transients can occur and propagate throughout the aggregate (Figure 2). Most likely, this propagation occurred via CICR via corbular SR. Unlike some studies of Ca2+ waves in atrial cells,7 our observations were made with nondialyzed Purkinje aggregates bathed with normal Tyrode's solution.
We also report here that a spontaneous Ca2+ wave would often initiate membrane depolarization, which in some cases was accompanied by nondriven electrical activity of the well polarized Purkinje cell aggregate (Figure 4). Although several have reported diastolic oscillations in muscle force, potential, or aequorin luminescence with toxic levels of glycosides or high Cao in multicellular Purkinje fiber preparations, it is commonly thought that intracellular Ca2+i plays little role, if any, in the normal rhythmic activity or automaticity of the Purkinje fiber.24 Clearly, in data presented earlier, we show that Ca2+ waves associated with membrane depolarization can elicit action potentials. Furthermore, Ca2+ waves and these depolarizations are sensitive to an agent that reduces SR Ca2+ stores (Figure 5). The relationship between “pacemaker” currents and spontaneous Ca2+ release in the regulation of automaticity is the subject of further study.
A final finding is that early afterdepolarizations induced by action potential duration prolongation of the cooled aggregate are not accompanied by distinct Ca2+ waves that travel throughout the tightly coupled aggregate. This is consistent with previously published data.25,26
Relationship to Previous Studies of Spatially Averaged Ca2+ Transients in Purkinje Fibers
We have shown spatial and temporal measurements of Ca2+ in Purkinje aggregates. Based on our findings of the multiple components (L0, L1, and L2), we predict the following for a spatial averaged Ca2+ transient in a Purkinje cell aggregate. Essential to this prediction is the assumption that the probability of Ca2+ release from intracellular stores depends on the Ca2+ load of the cells. It is evident that we cannot yet comment on the relation between Ca2+ load of the cells and the probabilities of release from the various intracellular compartments.
L0 consists predominantly of a rise in Ca2+ as a result of Ca2+ influx into the cell via ICaL (although a small component of subsarcolemmal Ca2+ release from the SR may be involved) (Figure 6). Hence, one would expect L0 to occur after the onset of every action potential in the presence of external calcium. Ca2+ changes due to L0 may be hard to detect when using aequorin because aequorin luminescence responds with a 2.5 power function to Ca2+. This may mask L0 because it consists of a small rise in the cytosolic Ca2+. This initial rise in Ca2+ would be followed by a larger rise in fluorescence (L1). The peak would consist of L1, which in the averaged transient would be broader than an unitary L1 wave because it propagates toward the cell core (Figure 3). Alternatively, at the same Ca2+ load, L0 might be followed by focally initiated Ca2+ transients (L2; Figure 2) that can propagate along the aggregate. This L2 would give rise to a small spatially averaged transient as long as it covers a small fraction of the aggregate (see Figure 2D records of ROIs 7 to 9), reaching a maximum only ≈400 ms after the start of L0. Hence, it would be visible on the declining phase of the averaged L1. Because the L2 transient propagates over a longer distance, its peak would be broader than that of L1. A uniform L1 and a propagating L2 would not occur simultaneously because L1 would be followed by a refractory period, precluding L2. Hence, if 100 stimulated events in a lightly Ca2+-loaded aggregate were averaged (eg, in Weir and Isenberg1), the averaged transient of aequorin would indeed have 2 peaks (L1 and L2, as defined in Weir and Isenberg1). The relative amplitude of the averaged L1 and L2 transients in Weir and Isenberg1 would depend on the specific probabilities of the generation of L1 and L2 after each of the individual stimuli. We predict that the latter would depend on the Ca2+ load of the aggregate. The exact time course of the Ca2+ transient would depend on the experimental conditions (eg, temperature, stimulus rate, and Ca2+o).
Figure 6.
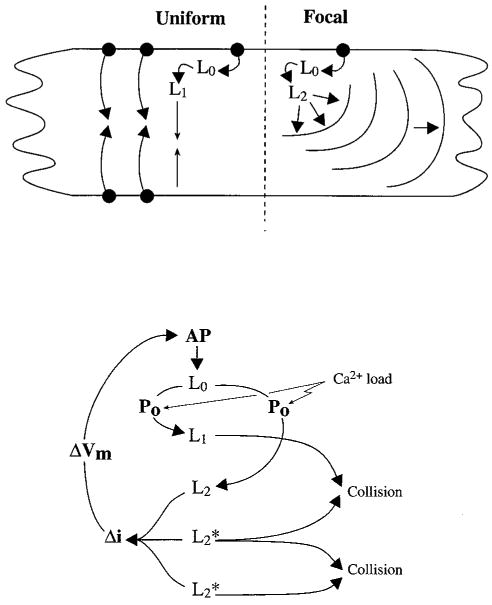
Schematics illustrating the various components of Ca2+ movement in a Purkinje cell/aggregate during uniform action potential–evoked Ca2+ release and Ca2+ waves. Top, Action potential (black dot) Ca2+ entry and release (L0) can give rise to L1, which propagates to the cell core. In some aggregates, focal Ca2+ release that usually appears at a cell border can give rise to a propagating Ca2+ wave (L2). Bottom, Relationship between cell excitability and the various Ca2+ compartments of a Purkinje aggregate. AP indicates action potential; Po probability of wave generation; i, ionic current, and Vm, transmembrane voltage.
In the interval between depolarizations, spontaneous Ca2+ waves (L2*) would occur with a low probability in aggregates only with a large Ca2+ load. They would therefore give rise to a small transient on a spatial and time average of fluorescence. Baseline transients could be absent in a lightly loaded preparation (see Weir and Isenberg1 and Figure 1) or could be more prominent, with a higher Ca2+ load.27 Thus, our L0, L1, L2, and L2* do not correspond to those in Weir and Isenberg.1
Implications of Ca2+i Compartments on Purkinje Cell Electrophysiology
The different Ca2+i compartments in normal Purkinje cells set the stage for multiple levels of Ca2+ control of normal Purkinje cell electrophysiology. The rapid rise of Ca2+i (L0) probably occurs near the surface membrane and therefore could by itself affect ionic currents immediately (Figure 6). For example, these Ca2+i changes could produce an immediate Ca2+i-dependent inactivation of the L-type Ca2+ channel, Ca2+ efflux via Na+/Ca2+ exchanger proteins, or Ca2+i-dependent activation of a Cl− conductance. In the latter regard, single rabbit Purkinje cells, although showing only 1 component Ca2+i transient,28 have a transient outward current that is activated and graded by the Ca2+i transient. However, when compared with the time course of changes in bulk Ca2+i, the Ca2+i-dependent outward current peaks earlier than the averaged transient and decays rapidly even while Ca2+i is maintained.29 These authors suggest that a subsarcolemmal Ca2+ gradient in Purkinje cells could explain the kinetic discrepancies between Ca2+i transient and the Ca2+i-dependent outward Cl− currents.
In the present study, L1 reflects Ca2+i propagation between corbular SR (Figure 6) and would be expected to affect membrane (or exchanger) channels that show Ca2+ dependence. One such channel is the slow component of the delayed rectifier IK, IKs. In the present study, L2 reflects Ca2+ propagation via corbular SR focally triggered by an action potential. L2 changes in Ca2+i would affect Ca2+i-dependent ion channels during the early phase of repolarization and may be the whole-cell Ca2+i counterpart to Islow as defined by Papp et al29 for rabbit Purkinje cells. In the latter study, Islow and accompanying Ca2+i were observed only during caffeine-induced Ca2+ release or when resting and peak Ca2+ levels were elevated. In the present study, we saw L2 Ca2+i transients in Purkinje aggregates with no caffeine.
L2* in the present study represents spontaneously occurring Ca2+ waves of normal Purkinje cells. These Ca2+i transients give rise to changes in membrane voltage and thus can affect excitability and sometimes elicit nondriven electrical activity (automatic beats) (Figure 6). Vprop of L2* decreased with thapsigargin, suggesting CICR as a mechanism of propagation of Purkinje cell aggregate waves. This then would predict the presence of ryanodine receptors on canine Purkinje corbular SR, as has been described for sheep Purkinje cells.30 Ca2+ waves in the Purkinje cell aggregate have a Vprop similar to that of Ca2+ waves in other cell types or normal cardiac muscle (see ter Keurs et al31); show collision; do not summate, as has been described by others; and clearly propagate from cell to cell within the aggregate.
Acknowledgments
This work supported by National Heart, Lung, and Blood Institute, Institutes of Health, grant HL-58860; the Medical Research Council; the Alberta Heritage Foundation for Medical Research; and a NATO Collaborative Research Grant. The authors wish to thank Dr Richard Robinson for his continued support and encouragement throughout the length of this study. In addition, we wish to thank John Nystrom and Christine McIvor for their very helpful tasks and expertise during the execution of the study.
Footnotes
Reprints: Information about reprints can be found online at http://www.lww.com/reprints
Contributor Information
Penelope A. Boyden, Department of Pharmacology, Columbia University, New York, NY
Jielin Pu, Department of Pharmacology, Columbia University, New York, NY.
Judith Pinto, Department of Pharmacology, Columbia University, New York, NY.
Hendrik E.D.J. ter Keurs, Department of Medicine, Physiology and Biophysics, University of Calgary, Calgary, Alberta, Canada
References
- 1.Wier WG, Isenberg G. Intracellular Ca transients in voltage clamped cardiac Purkinje fibers. Pflugers Arch. 1982;392:284–290. doi: 10.1007/BF00584312. [DOI] [PubMed] [Google Scholar]
- 2.Boyden PA, Albala A, Dresdner K. Electrophysiology and ultrastructure of canine subendocardial Purkinje cells isolated from control and 24 hour infarcted hearts. Circ Res. 1989;65:955–970. doi: 10.1161/01.res.65.4.955. [DOI] [PubMed] [Google Scholar]
- 3.Sommer JR, Johnson EA. Cardiac muscle: a comparative study of Purkinje fibers and ventricular fibers. J Cell Biol. 1968;36:497–526. doi: 10.1083/jcb.36.3.497. [DOI] [PMC free article] [PubMed] [Google Scholar]
- 4.Hatem SN, Benardeau A, Rucker-Martin C, Marty I, de Chamisso P, Villaz M, Mercadier JJ. Different compartments of sarcoplasmic reticulum participate in the excitation-contraction coupling process in human atrial myocytes. Circ Res. 1997;80:345–353. doi: 10.1161/01.res.80.3.345. [DOI] [PubMed] [Google Scholar]
- 5.Huser J, Lipsius SL, Blatter LA. Calcium gradients during excitation-contraction coupling in cat atrial myocytes. J Physiol. 1996;494(3):641–651. doi: 10.1113/jphysiol.1996.sp021521. [DOI] [PMC free article] [PubMed] [Google Scholar]
- 6.Lipp P, Pott L, Callewaert G, Carmeliet EE. Calcium transients caused by calcium entry are influenced by the sarcoplasmic reticulum in guinea-pig atrial myocytes. J Physiol. 1992;454:321–338. doi: 10.1113/jphysiol.1992.sp019266. [DOI] [PMC free article] [PubMed] [Google Scholar]
- 7.Lipp P, Huser J, Pott L, Niggli E. Subcellular properties of triggered Ca2+ waves in isolated citrate loaded guinea pig atrial myocytes characterized by ratiometric confocal microscopy. J Physiol. 1996;497:599–610. doi: 10.1113/jphysiol.1996.sp021793. [DOI] [PMC free article] [PubMed] [Google Scholar]
- 8.Tseng GN, Boyden PA. Multiple types of Ca currents in single canine Purkinje myocytes. Circ Res. 1989;65:1735–1750. doi: 10.1161/01.res.65.6.1735. [DOI] [PubMed] [Google Scholar]
- 9.Boyden PA, Pinto JMB. Reduced calcium currents in subendocardial Purkinje myocytes that survive in the 24 and 48 hour infarcted heart. Circulation. 1994;89:2747–2759. doi: 10.1161/01.cir.89.6.2747. [DOI] [PubMed] [Google Scholar]
- 10.Jeck C, Pinto JMB, Boyden PA. Transient outward currents in subendocardial Purkinje myocytes surviving in the 24 and 48 hr infarcted heart. Circulation. 1995;92:465–473. doi: 10.1161/01.cir.92.3.465. [DOI] [PubMed] [Google Scholar]
- 11.Robinson RB, Boyden PA, Hoffman BF, Hewett KW. Electrical restitution process in dispersed canine cardiac Purkinje and ventricular cells. Am J Physiol. 1987;253:H1018–H1025. doi: 10.1152/ajpheart.1987.253.5.H1018. [DOI] [PubMed] [Google Scholar]
- 12.Licata A, Aggarwal R, Robinson RB, Boyden PA. Frequency dependent effects on Cai transients, cell shortening in myocytes that survive in the infarcted heart. Cardiovasc Res. 1997;33:341–350. doi: 10.1016/s0008-6363(96)00246-5. [DOI] [PubMed] [Google Scholar]
- 13.Cheng H, Lederer WJ, Cannell MB. Calcium sparks: elementary events underlying excitation-contraction coupling in heart muscle. Science. 1993;262:740–744. doi: 10.1126/science.8235594. [DOI] [PubMed] [Google Scholar]
- 14.Yu M, Lin J, Khadeer M, Yeh Y, Inesi G, Hussain A. Effects of various amino acid 256 mutations on sarcoplasmic reticulum endoplasmic reticulum Ca2+ ATPase function and their role in cellular adaptive responses to thapsigargin. Arch Biochem Biophys. 1999;362:225–232. doi: 10.1006/abbi.1998.1049. [DOI] [PubMed] [Google Scholar]
- 15.Stern MD. Theory of excitation contraction coupling in cardiac muscle. Biophys J. 1992;63:497–517. doi: 10.1016/S0006-3495(92)81615-6. [DOI] [PMC free article] [PubMed] [Google Scholar]
- 16.Trafford AW, Lipp P, O'Neill SC, Niggli E, Eisner DA. Propagating calcium waves initiated by local caffeine application in rat ventricular myocytes. J Physiol. 1995;489:319–326. doi: 10.1113/jphysiol.1995.sp021053. [DOI] [PMC free article] [PubMed] [Google Scholar]
- 17.Lipp P, Pott L, Callewaert G, Carmeliet E. Simultaneous recordings of Indo-1 fluorescence and Na/Ca exchange current reveals two components of Ca2+ release from sarcoplasmic reticulum of cardiac atrial myocytes. FEBS Lett. 1992;275:181–184. doi: 10.1016/0014-5793(90)81467-3. [DOI] [PubMed] [Google Scholar]
- 18.Berlin JR. Spatiotemporal changes of Ca2+ during electrically evoked contractions in atrial and ventricular cells. Am J Physiol. 1999;269:H1165–H1170. doi: 10.1152/ajpheart.1995.269.3.H1165. [DOI] [PubMed] [Google Scholar]
- 19.Marban E, Wier WG. Ryanodine as a tool to determine the contributions of calcium entry and calcium release to the calcium transient and contraction in Purkinje fibers. Circ Res. 1985;56:133–138. doi: 10.1161/01.res.56.1.133. [DOI] [PubMed] [Google Scholar]
- 20.Hess P, Wier WG. Excitation-contraction coupling in cardiac Purkinje fibers: effects of caffeine on the intracellular [Ca++] transient, membrane currents, and contraction. J Gen Physiol. 1984;83:417–433. doi: 10.1085/jgp.83.3.417. [DOI] [PMC free article] [PubMed] [Google Scholar]
- 21.Wier WG, Hess P. Excitation-contraction coupling in cardiac Purkinje fibers: effects of cardiotonic steroids on the intracellular [Ca++] transient, membrane potential, and contraction. J Gen Physiol. 1984;83:395–415. doi: 10.1085/jgp.83.3.395. [DOI] [PMC free article] [PubMed] [Google Scholar]
- 22.Spitzer KW, Cordeiro JM, Ershler PR, Giles W, Bridge JHB. Confocal microscopy reveals that calcium transients in Purkinje myocytes are initiated at the cell periphery. Circulation. 1997;96(suppl I):I-239. Abstract. [Google Scholar]
- 23.Backx PH, de Tombe PP, van Deen JHK, Mulder BJM, ter Keurs HEDJ. A model of propagating calcium-induced calcium release mediated by calcium diffusion. J Gen Physiol. 1989;93:963–977. doi: 10.1085/jgp.93.5.963. [DOI] [PMC free article] [PubMed] [Google Scholar]
- 24.Cranefield PF, Aronson RS. Cardiac Arrhythmias: The Role of Triggered Activity. 1. Mount Kisco, NY: Futura Publishing Co Inc; 1988. [Google Scholar]
- 25.Volders PGA, Sipido KR, Vos MA, Kulcsar A, Verduyn SC, Wellens HJJ. Cellular basis of biventricular hypertrophy and arrhythmogenesis in dogs with chronic complete atrioventricular block and acquired torsade de pointes. Circulation. 1998;98:1136–1147. doi: 10.1161/01.cir.98.11.1136. [DOI] [PubMed] [Google Scholar]
- 26.Miura M, Ishide N, Oda H, Sakurai M, Shinozaki T, Takishima T. Spatial features of calcium transients during early and delayed afterdepolarizations. Am J Physiol. 1993;265:H439–H444. doi: 10.1152/ajpheart.1993.265.2.H439. [DOI] [PubMed] [Google Scholar]
- 27.Kass RS, Tsien RW, Weingart R. Ionic basis of transient inward current induced by strophanthidin in cardiac Purkinje fibres. J Physiol. 1978;281:209–226. doi: 10.1113/jphysiol.1978.sp012417. [DOI] [PMC free article] [PubMed] [Google Scholar]
- 28.Sipido KR, Callewaert G, Carmeliet E. [Ca2+]i transients and [Ca2+]i-dependent chloride current in single Purkinje cells from rabbit heart. J Physiol. 1993;468:641–667. doi: 10.1113/jphysiol.1993.sp019793. [DOI] [PMC free article] [PubMed] [Google Scholar]
- 29.Papp Z, Sipido KR, Callewaert G, Carmeliet EE. Two components of Cai activated Cl current during large Cai transients in single rabbit heart Purkinje cells. J Physiol. 1995;483:319–330. doi: 10.1113/jphysiol.1995.sp020588. [DOI] [PMC free article] [PubMed] [Google Scholar]
- 30.Jorgensen AO, Shen ACY, Arnold W, McPherson P, Campbell KP. The Ca2+ release channel/ryanodine receptor is localized in junctional and corbular sarcoplasmic reticulum in cardiac muscle. J Cell Biol. 1993;120:969–980. doi: 10.1083/jcb.120.4.969. [DOI] [PMC free article] [PubMed] [Google Scholar]
- 31.ter Keurs HEDJ, Zhang YM, Miura M. Damage-induced arrhythmias: reversal of excitation-contraction coupling. Cardiovasc Res. 1998;40:444–455. doi: 10.1016/s0008-6363(98)00263-6. [DOI] [PubMed] [Google Scholar]