

Abstract
Sodium benzoate is a widely used preservative found in many foods and soft drinks. It is metabolized within mitochondria to produce hippurate, which is then cleared by the kidneys. We previously reported that ingestion of sodium benzoate at the generally regarded as safe (GRAS) dose leads to a robust excursion in the plasma hippurate level [1]. Since previous reports demonstrated adverse effects of benzoate and hippurate on glucose homeostasis in cells and in animal models, we hypothesized that benzoate might represent a widespread and underappreciated diabetogenic dietary exposure in humans. Here, we evaluated whether acute exposure to GRAS levels of sodium benzoate alters insulin and glucose homeostasis through a randomized, controlled, cross-over study of 14 overweight subjects. Serial blood samples were collected following an oral glucose challenge, in the presence or absence of sodium benzoate. Outcome measurements included glucose, insulin, glucagon, as well as temporal mass spectrometry-based metabolic profiles. We did not find a statistically significant effect of an acute oral exposure to sodium benzoate on glucose homeostasis. Of the 146 metabolites targeted, four changed significantly in response to benzoate, including the expected rise in benzoate and hippurate. In addition, anthranilic acid, a tryptophan metabolite, exhibited a robust rise, while acetylglycine dropped. Although our study shows that GRAS doses of benzoate do not have an acute, adverse effect on glucose homeostasis, future studies will be necessary to explore the metabolic impact of chronic benzoate exposure.
Keywords: Benzoate, Diabetes, Hippurate, Preservative, Tryptophan
1.2: Introduction
Sodium benzoate and potassium benzoate are commonly used food preservatives that are listed among the “generally regarded as safe” (GRAS) compounds by the United States Food and Drug Administration, and can be present in foods at a concentration up to 0.1%. Though present in a variety of foods, population studies indicate that soft drinks are the major dietary source of benzoate [2]. Dietary benzoate is conjugated to glycine to form hippurate in the liver and kidneys by a two-step reaction occurring in the mitochondrial matrix (Figure 1) [3], so ingestion of this preservative causes a rise in both serum benzoate and hippurate levels [4]. Benzoate metabolism within mitochondria results in the consumption of ATP and glycine, as well as transient sequestration of coenzyme A (CoA). This compound can therefore have significant metabolic effects, as was demonstrated by early studies showing a drop in serum glycine with a high oral dose of sodium benzoate [5, 6]. In fact, indirect consumption of waste nitrogen through disposal of glycine is the rationale behind using intravenous sodium benzoate to treat hyperammonemia in patients with urea cycle disorders [7], and to reduce glycine levels in patients with non-ketotic hyperglycinemia. The clinically used dose of sodium benzoate can also be associated with other metabolic disturbances, such as a carnitine deficiency due in part to increased excretion of benzoylcarnitine [8, 9], and even higher doses have been associated with hepatic ATP depletion in animal studies [10]. Of course, the intravenous dose of sodium benzoate used in these conditions is 250 mg/kg/day, a much higher exposure than the 6.3 mg/kg that would be encountered by a 75 kg person consuming a 16-ounce soft drink.
Figure 1. Benzoate metabolism in the mitochondria.

Benzoate conversion to hippurate occurs within the mitochondrial matrix in two steps. Benzoate enters the mitochondria and is converted to benzoyl CoA (reaction 1) by an ATP-dependent acid:CoA ligase. Benzoyl CoA is subsequently converted to hippurate (reaction 2) by glycine N-acyltransferase, and then exits the mitochondria.
Our group’s interest in the metabolic consequences of sodium benzoate ingestion began with a study in which we used mass-spectrometry-based metabolite profiling of plasma to characterize the response to an oral glucose tolerance test (OGTT) [1]. The OGTT beverage contains 75 grams of glucose, additives for taste and color, as well as the GRAS concentration of sodium benzoate as a preservative. The most significantly changed metabolite in that study was hippurate, originating from the sodium benzoate [1]. The significant rise in hippurate raised the question of what the broader metabolic impact of sodium benzoate is, and whether the sodium benzoate contained in the OGTT beverage influences the response to a glucose challenge. Given that the OGTT is used to diagnose diabetes mellitus, such an interaction would have important clinical implications. Even more concerning is the fact that if sodium benzoate significantly influences the response to a glucose challenge, frequent consumption of soft drinks and other foods containing benzoate could increase the risk of developing type 2 diabetes mellitus.
It is notable that several reports from animal and cell culture models have suggested that sodium benzoate and hippurate might have a significant impact on glucose homeostasis. For example, intravenous infusion of benzoic acid in sheep resulted in a rise of serum glucose, insulin, and glucagon without concurrent glucose administration [11], suggesting a combined secretagogic action on insulin and glucagon, as well as a potential influence on insulin sensitivity. Studies in patients with renal insufficiency demonstrated that hippurate impairs basal and insulin-stimulated glucose uptake into cells in culture [12, 13]. The authors suggest that hippurate, which is renally-cleared, may accumulate in the setting of renal insufficiency and could therefore explain the altered glucose homeostasis observed in these patients. Finally, the package insert of the clinical formulation of intravenous sodium benzoate (which also contains sodium phenylacetate and dextrose) indicates that hyperglycemia was seen in seven percent of patients treated with intravenous high-dose benzoate [14].
Taken together, these data led us to formulate the novel hypothesis that sodium benzoate, at the GRAS dose, and its metabolite hippurate might impact insulin and glucagon secretion, as well as peripheral insulin action. However, no studies performed to date address the in vivo impact of a commonly encountered oral dose of sodium benzoate on glucose homeostasis in human subjects. The present study was designed to test the hypothesis that the GRAS dose of sodium benzoate has a significant impact on the response to a glucose challenge, and therefore might represent a potentially diabetogenic chronic environmental exposure. We report here the results of a randomized, cross-over trial conducted to assess the impact of acute oral administration of the GRAS dose of sodium benzoate, on its own and in combination with glucose, on glucose homeostasis and the plasma metabolite profile.
1.3: Results
In order to assess the metabolic impact of sodium benzoate, we recruited 14 overweight but otherwise healthy individuals into a randomized, controlled cross-over clinical trial. As summarized in Figure 2, the individuals came in for two study visits at which they were given a water beverage followed by a 75-gram glucose solution. On one study day both beverages contained 0.1% sodium benzoate, and on the other study day they contained no sodium benzoate.
Figure 2. Overview of study design.

Two test beverages with or without 0.1% sodium benzoate were given on each of two test days at times 0 and 180 minutes. The second beverage always contained 75 grams of glucose. Serial blood sampling was performed as indicated by the black arrows.
The characteristics of the recruited subjects are shown in Table 1. One subject had a greater than 2.5% change in weight between the study visits and one subject had both a greater than 8 week interval between study visits and a BMI slightly above the desired range of 25–30 kg/m2. Given that these were not considered significant deviations from the study design and protocol, these individuals were included in the overall analysis.
Table 1.
| Average | (Range) | |
|---|---|---|
| N | 14 | |
| Age (years) | 29.9 | |
| Gender | ||
| Male | 10 | |
| Female | 4 | |
|
| ||
| BMI (kg/m2) | 28.4 | (24.9–31.2) |
| Weight (kg) | 85 | (69–107) |
| Soda Consumption (oz/day) | 6.2 | (0.0–24.0) |
| Fasting Glucose (mg/dL) | 84.4 | (75.0–96.0) |
| Fasting Insulin (mIU/L) | 5.0 | (1.7–7.1) |
Based on subject weights, the administered dose of 480 mg sodium benzoate corresponded to a per kg dose of 5.65 mg/kg/dose (range 4.5–7 mg/kg/dose), substantially lower than the doses used clinically for treatment of hyperammonemia and non-ketotic hyperglycinemia. The process measures for the study are displayed in Figure 3, demonstrating a substantial rise in the mean value of benzoate and hippurate following ingestion of each of the two sodium benzoate-containing beverages. Benzoate and hippurate peak at 30 minutes, and fall dramatically by 120 minutes, indicating rapid metabolism and clearance. Interestingly, although hippurate showed a rise in all subjects, benzoate itself was not detectable in two out of the fourteen subjects following the water with benzoate beverage, suggesting that it had been completely metabolized by 30 minutes. The rise in both benzoate and hippurate was unexpectedly blunted for the second, glucose-containing beverage. In fact, benzoate was not detected in eight out of the fourteen subjects following consumption of the glucose beverage with benzoate. We also noted that the plasma concentration of benzoate and hippurate fell less between the 30 and 120-minute time points for the glucose-containing beverage in comparison to the non-glucose beverage. Furthermore, using the nutritional data collected for each subject, we found a strong correlation between soda consumption and hippurate area under the curve over the entire 5 hours of the benzoate study day (AUC5h) (Figure E1), but not with baseline hippurate.
Figure 3. Benzoate, hippurate, glucose, and insulin time courses.

The lines show mean measurements at each time point for the trial day for beverages without benzoate (black lines) or with benzoate (red). Error bars show the 95% confidence interval around the mean measurement at each time point. Insert panels show the mean AUC2hr for each panel with error bars indicating the 95% confidence interval for that mean.
The results for the key glycemic end points in this study are shown in Figure 3 and Figure E2. Glucose and insulin remained flat following ingestion of the non-glucose beverages, but rose sharply, as expected, in response to the glucose beverages. The area under the curve over the 2 hours following each individual beverage (AUC2hr) for the non-glucose beverages as well as the AUC5hr measurements were not significantly different between the benzoate and non-benzoate beverages for either insulin or glucose. For the glucose-containing beverages, the AUC2hr for both insulin and glucose tended to be slightly higher in the presence of benzoate, but the difference was small and not statistically significant. In addition, no individual time points for insulin and glucose were significantly different in the presence or absence of benzoate (all p > 0.05). The glucagon values, shown in Figure E2, proved to be quite variable and did not show a meaningful change for AUC2hr, AUC5hr, or individual time points. We evaluated whether soda consumption, AUC5hr hippurate, or AUC5hr benzoate served as significant predictors of the difference between any of the key glycemic end points (glucose, insulin or glucagon) between the benzoate and non-benzoate study days, but found no significant relationship (all p > 0.1).
The results of the metabolite profiling analysis are shown in Figure 4, where we present the difference, relative to the baseline measurement, for each metabolite at 30 minutes (Δ30) and 120 minutes (Δ120) for each of the four beverages, plotted against the p-value assessing whether the difference is non-zero. Hippurate is captured in the metabolite profiling data set, and there is, as expected, a strong increase seen at 30 and 120 minutes following ingestion of benzoate, in either the presence or absence of glucose. Strong effects are also seen in the data from both of the glucose beverages, and can be compared to the prior published studies [1, 15]. For example, the Δ120 data for both glucose beverages show a rise in lactate, and a fall in glycerol, beta-hydroxybutyrate, and the amino acids leucine and isoleucine. As has been noted in our previous study [1], this pattern of metabolite changes provides a readout of the axes of insulin action, including activation of glycolysis, and suppression of lipolysis, ketogenesis, and proteolysis. The presence or absence of benzoate does not significantly impact the changes in these metabolites caused by glucose ingestion, suggesting that benzoate has no acute effect on insulin action. When analyzing all four beverages together, we find that the only metabolites with a significant interaction between glucose and benzoate are hippurate and benzoate. This interaction can be observed in the time courses for benzoate and hippurate shown in Figure 3, where the presence of glucose lowered the magnitude of the rise of both benzoate and hippurate at 30 minutes (pbenzoate = 0.0003, phippurate = 1.27E-10 for Glucose:Benzoate interaction).
Figure 4. Metabolite profiling results.

Volcano plots testing whether the concentration of each metabolite has changed from baseline either 30 minutes or 120 minutes after drinking each beverage. The x axis shows the mean difference in log-transformed metabolite measurements at each time point (Log[A.U.Time 30 or 120] − Log[A.U.Time 0]), with A.U. corresponding to arbitrary units for metabolite peak area. The y-axis shows the log-transformed p-value for the test that this difference is not equal to zero. Labeled points in all plots are those with estimated significance of p < 0.001, with the exception of the glucose plots, for which only a few of the many significant points were labeled.
When examining the 30-minute water beverage with benzoate relative to water alone, we saw a significant rise in anthranilic acid (2-aminobenzoic acid) and a fall in acetylglycine (Figure 5). The effect was specific to benzoate in the full model accounting for glucose, benzoate, and their interaction (β benzoate for acetylglycine = −0.24, p = 1e-5; β benzoate for anthranilic acid = 0.27, p = 8E-5). Of note, we also observed a fall in glycine at this time point (Figure 5), but the effect did not reach metabolome-wide significance.
Figure 5. Anthranilic acid, acetylglycine, and glycine 30 minutes following benzoate ingestion.
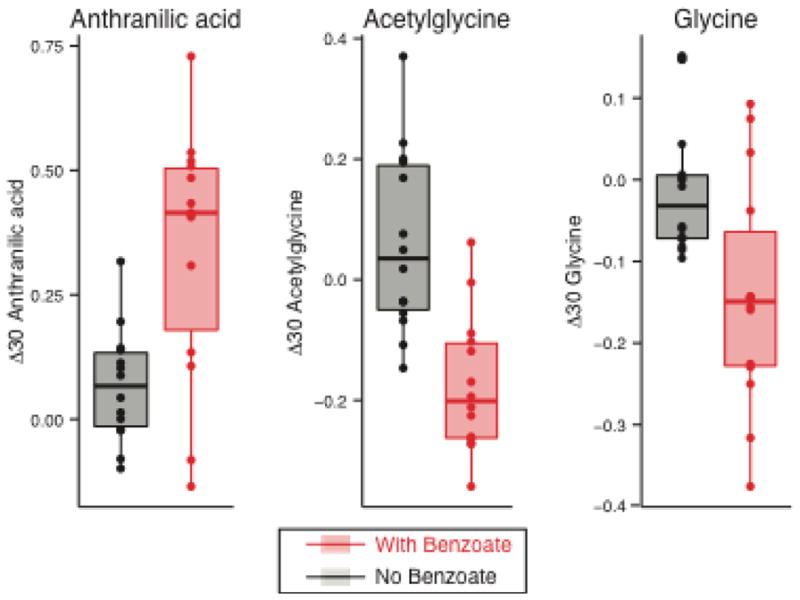
Boxplot showing the 30 minute excursion (Log[A.U. Time 30] − Log[A.U. Time 0]) of anthranilic acid, acetylglycine, and glycine following ingestion of either the beverage with just water (black) or with water and benzoate (red). Boxes extend from the 1st to 3rd quartiles of each distribution, and the horizontal line shows the median value. Data points for all 14 subjects are shown as points.
1.4: Discussion
In the present study we have performed a broad metabolic assessment of acute oral exposure to the GRAS dose of sodium benzoate, a ubiquitous food preservative in modern society. Although the glucose and insulin areas under the curve for the glucose-containing beverages were slightly higher in the presence of benzoate, these differences were small and not statistically significant. We did, however, find that sodium benzoate exposure significantly influences four circulating metabolites, benzoate itself, hippurate, acetylglycine and anthranilic acid, and causes a downward trend in glycine. Given that the glucose plus benzoate test beverage mimics the clinically-used OGTT beverage, our study does not support the raised concern that sodium benzoate confounds the results of the OGTT, though a definitive conclusion cannot be reached given the small sample size and limited statistical power of our study.
Although we did not detect statistically significant differences in glucose or insulin levels secondary to sodium benzoate exposure, our study has limitations. We evaluated the impact of a single GRAS dose of benzoate, and larger and chronic doses could have a greater impact. The maximal plasma hippurate concentration achieved (based on our limited measurements) in this study, ~446 micromolar, is in the range used in cell culture studies demonstrating an inhibitory effect of hippurate on glucose uptake, with a half maximal effect observed at 432 micromolar [13]. However, in the sheep study, in which intravenous benzoic acid increased insulin, glucagon, and glucose, the ED50 for increases in insulin and glucagon following intravenous exposure was ~16 times our orally administered single dose [11]. As such, higher doses of oral benzoate, as could be encountered by an individual consuming multiple benzoate-containing foods and beverages at one sitting, may be required to see a significant impact on glucose homeostasis. Future studies will be necessary to explore the metabolic impact of such higher dose and longer-term exposures.
Our study offers unanticipated insights into the metabolism of sodium benzoate. First, we found that the peak levels of plasma benzoate and hippurate were significantly attenuated during the second glucose-containing beverage relative to the first. The fact that the excursion of both metabolites was blunted suggests that this observation is not likely due to altered metabolism of benzoate itself, but rather points towards a potential change in absorption. The two benzoate-containing beverages were given in series, so reduced absorption could represent a carry-over effect, with down-regulation of benzoate uptake in the intestine after the first exposure. Furthermore, the second beverage contained glucose whereas the first did not, and it is possible that the glucose itself somehow reduces absorption of benzoate. In addition, we observed that the fall in the concentration of plasma benzoate and hippurate was slower following the second beverage, which suggests the possibility that clearance of these metabolites is slowed following the second exposure (or that the co-administration of glucose alters clearance). One important caveat, and a limitation of our data, is that we only have measurements at 30 and 120 minutes post beverage ingestion for benzoate and hippurate. As such, it is possible that the peaks for both metabolites were delayed following the second beverage, and were simply not captured with our limited time points. The second observation related to benzoate metabolism is that there is a strong correlation between the level of soda consumption and hippurate exposure (AUC5hr). These data suggest the intriguing possibility that increased consumption of soda, and thereby sodium benzoate, might induce the rate of benzoate metabolism or reduce the rate of hippurate clearance. The pharmacokinetics of oral sodium benzoate exposure with and without glucose have not, to our knowledge, been previously described, and may bear importance when sodium benzoate is administered orally for hyperammonemia or non-ketotic hyperglycinemia. Specifically, these data suggest the possibility that co-administration of benzoate with glucose could diminish the effectiveness of the drug.
The current study has revealed that ingestion of sodium benzoate leads to a robust, transient rise in the levels of anthranilic acid and acetylglycine. Anthranilic acid, which is involved in tryptophan metabolism in both humans and bacteria, could reflect an influence on tryptophan metabolism in either the subjects themselves, or their gut microbial species, or both. It is also notable that anthranilic acid and benzoate differ by a single amine group, such that the anthranilic acid may come directly from the ingested benzoate itself, either through metabolism by the subjects or their microbiota, though there is no annotated enzyme we could identify that catalyzes this reaction. Anthranilic acid accumulates in the setting of renal failure, and one cell culture study suggested that it might promote renal failure through adverse effects on mesangial cells [16]. In a separate study, treatment of cultured neurons and glial cells with anthranilic acid altered NAD+ levels and caused cytotoxicity [17]. Our metabolite profiling also revealed a drop in acetylglycine, which, like hippurate, is a product of glycine N-acyltransferase and is generated through conjugation of acetyl-CoA and glycine. The fall in acetylglycine may therefore reflect competition for glycine N-acyltransferase and/or depletion of the glycine pool by ingested benzoate. The latter possibility is supported by the concurrent downward trend we observed in plasma glycine levels. At present, the long-term consequences of repeated perturbations in anthranilic acid or acetylglycine remain to be determined.
1.5: Materials and Methods
Study Overview
This randomized, controlled cross-over trial (www.clinicaltrials.gov; NCT01179945) was conducted at Boston Children’s Hospital, Boston, MA, and was approved by the institutional review board. The pre-specified primary endpoint for the study was blood glucose AUC2hr. Fourteen overweight, but otherwise healthy, volunteers were recruited by online advertisements from the general public in the Boston metropolitan area between August 2010 and June 2011. Subjects were eligible if their age was between 18 and 35 years, and their BMI, measured at the first study visit, was between 25 and 30 kg/m2. Subjects were excluded if they had known diabetes mellitus or a fasting blood glucose greater than or equal to 126 mg/dl, had any major medical illness, exercised more than 60 minutes on more than 4 days a week, were taking medications or supplements that influence glucose metabolism, had large fluctuations in body weight (>5% over the past 6 months), were actively following a weight loss program, consumed more than 24 ounces of soda per day (defined as sugar- or artificially-sweetened beverages), or had a known allergy or intolerance to sodium benzoate. Women were excluded if they had irregular menstrual cycles, were pregnant or breastfeeding. All subjects provided informed written consent at the first study visit. In a cross-over design, each subject received two benzoate containing beverages on one test day and two non-benzoate containing beverages on the other test day (Figure 2). Subjects were randomly assigned by the research pharmacist to receive either the benzoate containing or non-benzoate containing beverages first. The randomization schedule was prepared in advance by the Boston Children’s Hospital Clinical Research Program in randomly permuted blocks of 4. The test beverages were constituted by the research pharmacist and supplied in 500 ml pharmacy bottles. The benzoate containing and non-benzoate containing beverages were identical in appearance, taste, and packaging. All study subjects, research personnel and outcome assessors were unaware of the intervention sequence.
Interventions
Subjects presented to the Boston Children’s Hospital Clinical Translational Study Unit (CTSU) on 2 separate test days that were at least 1 week apart to avoid carryover effects, and no more than 8 weeks apart to limit intra-subject variability. Females were scheduled on matching days during the early follicular phase of the menstrual cycle. Subjects were asked to consume their customary diet and amount of soft drinks, and to engage in their habitual level of exercise for two days prior to each study visit. In addition, subjects were required to abstain from alcohol the evening before, and to fast overnight (~ 10 hours) prior to each visit. During each study visit, two beverages were administered sequentially at time 0 minutes and 180 minutes, respectively. Consumption of test solutions was timed and restricted to no more than 5 minutes. The first beverage (given at 0 minutes) contained 480ml water with no glucose added; the second beverage (given at 180 minutes) contained 480 ml water with 75 grams glucose added. On one of the test-days, 480 mg sodium benzoate powder (spectrum chemical; New Brunswick, NJ) was added to each beverage to a final concentration of 0.1%, corresponding to the maximal GRAS dose for use as a food preservative.
Biochemical Measurements
Serial blood draws from an IV catheter were performed before and 15, 30, 45, 60, 90, and 120 minutes after the start of consumption of each beverage. Laboratory samples were immediately submitted for analyses of plasma glucose (Cobas Integra, Roche Diagnostics, Indianapolis, IN). Samples were centrifuged and stored at −80 C for batched analyses of glucagon (RIA, glucagon double antibody, Diagnostics Products Corporation, Los Angeles, CA), insulin (Access Chemluminescent Immunoassay, Beckman Coulter, Fullerton, CA), and metabolic profiling. Metabolite profiling was carried out as previously described [18]. Absolute quantification of plasma benzoate and hippurate was determined using external calibration curves prepared via serial dilution of sodium benzoate-d5 and N-benzoyl-d5-glycine (C/D/N Isotopes, Pointe-Claire QC) in pooled human plasma (BioreclamationIVT, Westbury NY). Standard curves consisting of eight concentration points for benzoate-d5 and eleven points for N-benzoyl-d5-glycine were analyzed in triplicate.
Data Analysis
Analyses were performed using SAS software (version 9.2; SAS Institute Inc) and R [19]. AUCs for glucose, insulin, and glucagon were calculated for each experimental day over 5 hours (AUC5h), and after drinking each beverage over 2 hours (AUC2h), using the trapezoidal method. Due to difficulties with blood draws, blood samples could not be collected 90 min after the glucose challenge in one subject, 90 and 120 minutes after the water challenge in another subject and at baseline before glucose challenge in another one. These 4 missing time-points (1% of all time-points) were imputed by linear interpolation prior to analysis. Complete datasets were obtained from all other subjects. For the metabolite profiling, analysis was limited to metabolites that were detected in at least 50 percent of the samples, which represented 135 of the 146 measured metabolites. All metabolite values were log transformed prior to analysis to better fit the assumption of normally distributed error. Baseline values were defined as 0 minutes and 180 minutes (the time immediately before beverage ingestion) for each beverage, and this baseline was subtracted from the two measurements 30 and 120 minutes after beverage ingestion to calculate the relative change at each time point, Δ30 and Δ120, respectively.
A two-tailed paired t-test was used to assess any differences in the key glycemic end points, the AUC values of glucose and insulin, using a cut-off p-value of 0.05. Linear regression was used to determine if the insulin and glucose AUC differences between beverages with and without benzoate were significantly correlated with either AUC5h benzoate or hippurate. To find any effects of beverage ingredients on the profiled metabolite levels, the excursions from baseline both 30 and 120 minutes after ingestion of the four beverage types were analyzed with a mixed-effect model that included the factors benzoate, glucose and their interaction as fixed effects, and the individual as a random effect to account for the repeated measurements in the crossover design. For these analyzes, a cut-off p-value was set to 0.001 to account for multiple hypothesis testing.
Prospective power calculations for this pilot study were based on a factorial analysis of variance with a type I error rate (critical p value) of 0.05. Assuming an intra-subject correlation of 0.6, the sample size of 14 subjects provided 80% power to detect a difference of 16% (0.31 standard deviations) in glucose area under the curve for each intervention, and a 33% (0.61 standard deviations) difference for interactions between glucose and benzoate. Retrospective power calculation using the actual value of standard deviation of the difference revealed 80% power to detect an even smaller effect size of 10% after the water, and 20% after the glucose challenge. The power to detect a real difference of the magnitude we detected and prove it was non-zero were 7% and 11%, respectively.
Supplementary Material
Highlights.
Sodium benzoate is a widely used food preservative
The metabolic impact of an acute oral exposure to sodium benzoate was evaluated
Acute sodium benzoate did not significantly impact glucose, insulin, or glucagon
Significant changes in anthranilic acid and acetylgycine were observed
Long term impact of chronic benzoate exposure remains to determined
Acknowledgments
This work was supported by grants from the Harvard Catalyst | The Harvard Clinical and Translational Science Center (National Center for Research Resources and the National Center for Advancing Translational Sciences, National Institutes of Health Award UL1 TR001102, UL1 RR025758), financial contributions from Harvard University and its affiliated academic health care centers, as well as the Translational Research Program at Boston Children’s Hospital (Grant # 70096). The content is solely the responsibility of the authors and does not necessarily represent the official views of Harvard Catalyst, Harvard University and its affiliated academic health care centers, the National Center for Research Resources, or the National Institutes of Health. DSL is supported by a mid-career mentoring award (grant # K24DK082730) from the National Institute of Diabetes and Digestive and Kidney Diseases, and the New Balance Foundation. VKM is an Investigator of the Howard Hughes Medical Institute and is also supported by a grant from the National Institutes of Health (R01DK081457). We thank Dr. Henry Feldman for assistance with statistics, Dr. Rocco Anzaldi for food and beverage formulation, and Dr. Anupam Patigri for assistance with figure art.
Footnotes
1.7: Author Contributions
SBV, VKM conceived the study hypothesis. SBV, BSL, DSL, VKM designed the study. BSL and SBV carried out the experiments. CBC, KAP, and AAD performed metabolite profiling. SBV, BSL, and NFD analyzed the data. SBV, BSL, NFD, DSL, VKM prepared the manuscript.
1.8: Conflict of Interest
The authors declare no conflicts of interest relevant to this manuscript.
Publisher's Disclaimer: This is a PDF file of an unedited manuscript that has been accepted for publication. As a service to our customers we are providing this early version of the manuscript. The manuscript will undergo copyediting, typesetting, and review of the resulting proof before it is published in its final citable form. Please note that during the production process errors may be discovered which could affect the content, and all legal disclaimers that apply to the journal pertain.
Contributor Information
Belinda Lennerz, Email: Belinda.lennerz@childrens.harvard.edu, Boston Children’s Hospital, 300 Longwood Avenue, Boston, MA 02115, USA.
Scott B. Vafai, Email: vafai@molbio.mgh.harvard.edu, Massachusetts General Hospital, Boston, MA 02114.
Nigel F. Delaney, Email: nigel.delaney@post.harvard.edu, Massachusetts General Hospital, Boston, MA 02114
Clary B. Clish, Email: clary@broadinstitute.org, Broad Institute of Harvard and MIT, Cambridge, MA 02141, USA
Amy A. Deik, Email: adeik@broadinstitute.org, Broad Institute of Harvard and MIT, Cambridge, MA 02141, USA
Kerry A. Pierce, Email: kpierce@broadinstitute.org, Broad Institute of Harvard and MIT, Cambridge, MA 02141, USA
David S. Ludwig, Email: David.ludwig@childrens.harvard.edu, Boston Children’s Hospital, 300 Longwood Avenue, Boston, MA 02115, USA
Vamsi K. Mootha, Email: vamsi@hms.harvard.edu, Massachusetts General Hospital, Boston, MA 02114
1.9: References
- 1.Shaham O, et al. Metabolic profiling of the human response to a glucose challenge reveals distinct axes of insulin sensitivity. Mol Syst Biol. 2008;4:214. doi: 10.1038/msb.2008.50. [DOI] [PMC free article] [PubMed] [Google Scholar]
- 2.Tfouni SA, Toledo MC. Estimates of the mean per capita daily intake of benzoic and sorbic acids in Brazil. Food Addit Contam. 2002;19(7):647–54. doi: 10.1080/02652030210125119. [DOI] [PubMed] [Google Scholar]
- 3.Badenhorst CP, et al. A new perspective on the importance of glycine conjugation in the metabolism of aromatic acids. Drug Metab Rev. 2014 doi: 10.3109/03602532.2014.908903. [DOI] [PubMed] [Google Scholar]
- 4.Kubota K, Ishizaki T. Dose-dependent pharmacokinetics of benzoic acid following oral administration of sodium benzoate to humans. Eur J Clin Pharmacol. 1991;41(4):363–8. doi: 10.1007/BF00314969. [DOI] [PubMed] [Google Scholar]
- 5.de Vries A, Alexander B, Quamo Y. Studies on Amino Acid Metabolism. Iii. Plasma Glycine Concentration and Hippuric Acid Formation Following the Ingestion of Benzoate. J Clin Invest. 1948;27(5):665–8. doi: 10.1172/JCI102014. [DOI] [PMC free article] [PubMed] [Google Scholar]
- 6.Christensen HN, et al. Glycine and alanine concentrations of body fluids; experimental modification. J Biol Chem. 1947;168(1):191–6. [PubMed] [Google Scholar]
- 7.Batshaw ML, et al. Treatment of inborn errors of urea synthesis: activation of alternative pathways of waste nitrogen synthesis and excretion. N Engl J Med. 1982;306(23):1387–92. doi: 10.1056/NEJM198206103062303. [DOI] [PubMed] [Google Scholar]
- 8.Mori T, et al. A case of carbamylphosphate synthetase-I deficiency associated with secondary carnitine deficiency--L-carnitine treatment of CPS-I deficiency. Eur J Pediatr. 1990;149(4):272–4. doi: 10.1007/BF02106292. [DOI] [PubMed] [Google Scholar]
- 9.Sakuma T. Alteration of urinary carnitine profile induced by benzoate administration. Arch Dis Child. 1991;66(7):873–5. doi: 10.1136/adc.66.7.873. [DOI] [PMC free article] [PubMed] [Google Scholar]
- 10.Palekar AG, Kalbag SS. Amino acids in the rat liver and plasma and some metabolites in the liver after sodium benzoate treatment. Biochem Med Metab Biol. 1991;46(1):52–8. doi: 10.1016/0885-4505(91)90050-u. [DOI] [PubMed] [Google Scholar]
- 11.Mineo H, et al. Effects of benzoic acid and its analogues on insulin and glucagon secretion in sheep. Eur J Pharmacol. 1995;280(2):149–54. doi: 10.1016/0014-2999(95)00192-n. [DOI] [PubMed] [Google Scholar]
- 12.Spustova V, Dzurik R. Effect of hippurate on glucose utilization in rat kidney cortex slices. Ren Physiol Biochem. 1991;14(1–2):42–7. [PubMed] [Google Scholar]
- 13.Spustova V, Dzurik R, Gerykova M. Hippurate participation in the inhibition of glucose utilization in renal failure. Czech Med. 1987;10(2):79–89. [PubMed] [Google Scholar]
- 14.Ammonul(R) [package insert] Ucyclyd Pharma, Inc; Scottsdale, AZ: 2011. [Google Scholar]
- 15.Ho JE, et al. Metabolite profiles during oral glucose challenge. Diabetes. 2013;62(8):2689–98. doi: 10.2337/db12-0754. [DOI] [PMC free article] [PubMed] [Google Scholar]
- 16.Yoshimura H, et al. Effects of kynurenine metabolites on mesangial cell proliferation and gene expression. Exp Mol Pathol. 2009;87(1):70–5. doi: 10.1016/j.yexmp.2009.02.002. [DOI] [PubMed] [Google Scholar]
- 17.Braidy N, et al. Effects of Kynurenine Pathway Metabolites on Intracellular NAD Synthesis and Cell Death in Human Primary Astrocytes and Neurons. Int J Tryptophan Res. 2009;2:61–9. doi: 10.4137/ijtr.s2318. [DOI] [PMC free article] [PubMed] [Google Scholar]
- 18.Townsend MK, et al. Reproducibility of metabolomic profiles among men and women in 2 large cohort studies. Clin Chem. 2013;59(11):1657–67. doi: 10.1373/clinchem.2012.199133. [DOI] [PMC free article] [PubMed] [Google Scholar]
- 19.R Core Team. R: A language and environment for statistical computing. R Foundation for Statistical Computing; Vienna, Austria: 2013. [Google Scholar]
Associated Data
This section collects any data citations, data availability statements, or supplementary materials included in this article.