

Abstract
Rationale and Objectives
The longitudinal relationship between regional air trapping and emphysema remains unexplored. We have sought to demonstrate the utility of parametric response mapping (PRM), a computed tomography (CT) based biomarker, for monitoring regional disease progression in COPD patients, linking expiratory and inspiratory-based CT metrics over time.
Materials and Methods
Inspiratory and expiratory lung CT scans were acquired from 89 COPD subjects with varying GOLD status at 30 day (n=13) or one year (n=76) from baseline as part of the SPIROMICS clinical trial. PRMs of CT data were used to quantify the relative volumes of normal parenchyma (PRMNormal), emphysema (PRMEmph), and functional small airways disease (PRMfSAD). PRM measurement variability was assessed using the 30-day interval data. Changes in PRM metrics over a one-year period were correlated to pulmonary function (FEV1). A theoretical model that simulates PRM changes from COPD was compared to experimental findings.
Results
PRM metrics varied by ~6.5% of total lung volume for PRMNormal and PRMfSAD and 1% for PRMEmph when testing 30-day repeatability. Over a one-year interval, only PRMEmph in severe COPD subjects produced significant change (19% to 21%). However, 11 of 76 subjects showed changes in PRMfSAD greater than variations observed from analysis of 30 day data. Mathematical model simulations agreed with experimental PRM results, suggesting fSAD is a transitional phase from normal parenchyma to emphysema.
Conclusions
PRM of lung CT scans in COPD patients provides an opportunity to more precisely characterize underlying disease phenotypes, with the potential to monitor disease status and therapy response.
INTRODUCTION
Chronic obstructive pulmonary disease (COPD) is a complex syndrome with multiple underlying phenotypes. As the third leading cause of mortality in the United States, research in COPD has intensified with the focus towards accurately phenotyping this complex disease (1, 2). Physiologic assessment and patient-reported parameters such as dyspnea and health status continue to be the standard of care for diagnosis, but have limited prognostic value as only global assessment of COPD is obtained (3). Although there have been considerable strides in understanding the underlying biology, limited progress has been made in improving our ability to routinely define and longitudinally monitor the varying components of COPD. As such, there is a need to develop and evaluate patient-specific biomarker surrogates of clinical status and outcome in COPD patients.
A biomarker must be technically measureable, unattainable by other methods, and useful for the effective management of patients (4, 5). For COPD patients, the most widely used measure that fits this definition continues to be forced expiratory volume in one second (FEV1). Improvements have been made through the inclusion of FEV1 in multidimensional assessments (e.g. BODE: Body-Mass Index, Obstruction, Dyspnea, Exercise) (6, 7), which have improved prognostication over FEV1 alone. Nevertheless, these measures have limited capability in identifying the underlying biological components that make up the varying COPD phenotypes. Although biological components of COPD are subject to molecular and genetic heterogeneity (8) they do provide unique imageable characteristics including regional distribution of emphysema (9–12), air trapping (13–15), airway remodeling (16, 17), regional alterations in texture (18–20), lung mechanics (21, 22), and more recently measures of perfusion heterogeneity and altered pulmonary vascular dimensions (23–26).
Computed tomography (CT) with high spatial resolution and superb air-soft tissue contrast continues to be used for the clinical management of COPD patients, primarily for qualitative examination. Nevertheless, extensive research has been devoted to evaluating quantitative CT to define structural abnormalities and disease severity (27). Although these approaches provide additional insights into the COPD phenotypes, differentiation of parenchymal tissue into emphysematous (i.e. tissue destruction) and non-emphysematous (i.e. inflammatory) airflow obstruction remained elusive because both metrics rely on a density threshold, and on expiratory scans emphysema-like lung and air trapping signals can overlap. With the introduction of a post-processing technique called parametric response mapping (PRM) (28), we have demonstrated a methodology allowing for the linkage of inspiratory and expiratory CT lung scans to provide a classification of individual voxels of lung parenchyma as normal, non-emphysematous airflow obstruction that we refer to as functional small airways disease (fSAD), and emphysema.
In this study we now seek to use the PRM methodology to explore the temporal relationships between these three parenchymal categories over short time periods of either 30 days or one year with the expectation regional changes over 30 days provides a measure of noise in the measurement (including biological fluctuations between normal and inflamed parenchyma). For these purposes, we have employed CT data from a well-defined cohort of COPD subjects accrued as part of a clinical trial (i.e. SPIROMICS) to demonstrate PRM for detecting longitudinal progression in COPD patients. In addition, recent evidence has identified inflammatory small airways disease as an intermediary of normal parenchyma to emphysema (29). As such, we investigated the role of fSAD as an intermediate step in COPD progression through “voxel-based tracking” and a mathematical model that simulates PRM trends observed in our empirical data.
METHODS
Study Population
Eighty-nine subjects, with CT and clinical examinations performed at two time points, were accrued at our institution as part of the SPIROMICS study (30). Only those subjects between 40 and 80 years old at baseline with a smoking history of ≥20 pack-years (strata 2, 3 and 4 corresponding to GOLD 0, 1/2 and 3/4, respectively) (Global Initiative for Chronic Obstructive Lung Disease (GOLD)) (31) were included in this study. Exclusion criteria were intolerance of bronchodilators used in study assessments, body mass index>40 kg/m2 at baseline, presence of non-COPD obstructive lung disease, diagnosis of unstable cardiovascular disease, lung surgery or metal in the chest that might affect the chest CT interpretation. Seventy-six of these subjects were examined at a one year interval and stratified based on baseline COPD severity as defined by GOLD guidelines (Table 1) (31). The remaining 13 subjects, with variable lung obstruction, were part of the Repeatability and Replicate Sub-study of SPIROMICS and had serial CT examinations acquired with an interval of 30 days. Post-bronchodilator forced expiratory volume at 1-second (FEV1) was determined from spirometry at each time point. These clinical studies were conducted under an Institutional Review Board approved protocol and all subjects involved provided written informed consent.
Table 1.
Subject Characteristics
| Parameter | Stratum 2 | Stratum 3 | Stratum 4 |
|---|---|---|---|
| Number | 15 | 41 | 20 |
| Gender (M/F) | 9/6 | 19/22 | 9/11 |
| Age (years) | 62(10) | 65(8) | 64(7) |
| Height (cm) | 174(10) | 168(10) | 166(11) |
| Weight (kg) | 86(20) | 83(17) | 74(15) |
| BMI (kg/cm2) | 28(5) | 29(5) | 27(3) |
| Pack-years | 42(18) | 51(18) | 52(16) |
Values are mean(std).
Computed Tomography Acquisition and Analysis
Whole-lung volumetric multidetector CT was acquired for all 89 subjects on a GE Discovery CT750 scanner at inspiration (i.e. total lung capacity (TLC)) and full expiration (i.e. residual volume (RV)) using the SPIROMICS imaging protocol of 120 kVP with the current adjusted to meet CT dose index volume targets for expiration and inspiration using three settings, large (BMI>30), medium (BMI 20–30), and small (BMI<20) with vendor-specific reconstruction kernels (Standard, B, B35, FC03) (30). CT data reconstructed using the “standard” kernel was analyzed in this study. Quantitative CT data were presented in Hounsfield units (HU), where stability of CT measurement for each scanner was monitored monthly by use of the COPDGene phantom (32). For reference, ideal air and water attenuation values should be −1000 and 0 HU, respectively.
Parametric Response Map (PRM)
PRM was performed automatically using Imbio’s Lung Density Analysis (LDA™) software application (Imbio, LLC, Minneapolis, MN) for all CT data. Of the 89 subjects, CT data from 8 subjects (1 stratum 2; 3 stratum 3; 4 stratum 4) were unable to be analyzed using LDA due to segmentation errors. In accordance with LDA, PRM was performed on this data using Apollo (VIDA Diagnostics, Inc., Coralville, IA) for lung segmentation and in-house algorithms for registration and voxel classification. Details on the PRM analysis have been previously reported (28). Relative lung volumes of normal parenchyma (PRMNormal, green voxels), fSAD (PRMfSAD, yellow voxels) and emphysema (PRMEmph, red voxels) were calculated by normalizing the sum of all like-classed voxels by the total lung volume.
Computational Model
We derived a linear 3-compartment model that simulates PRM changes resulting from COPD progression. Assuming conservation of volume, absence of short-term exacerbations and/or treatments and fSAD as an intermediate step from normal to emphysematous parenchyma, our model can be represented by the following linear process:
| (Eqn. 1) |
We further assumed that emphysema is a permanent disease state (kEmph→;fSAD = 0). The full model derivation and final solution is presented in the supplement.
Data and Statistical Analysis
All statistical computations were performed with a statistical software package (IBM SPSS Statistics, v. 21). Results were considered statistically significant at the two-sided 5% comparison-wise significance level (P>0.05). Unless stated otherwise, all data was presented as mean and SEM.
One-Year Interval Data
Differences in baseline subject characteristics (age, height, weight, body mass index (BMI) and smoking pack-years) between strata were determined using an ANOVA controlled for multiple comparisons (Bonferroni posthoc test). Kruskal-Wallis test and Wilcoxon Signed Rank test were used to assess differences in PRM values between stratum at each time point, and time points for each stratum, respectively. The same analysis was performed for FEV1. Correlations in PRM and FEV1, for each stratum and pooled, were determined using a Spearman’s rho Test. Next, we stratified the subject population based on changes in FEV1 (ΔFEV1) and evaluated their PRM differences using a Mann-Whitney U test for each stratum. Finally, we tested the effectiveness of PRM metrics as a predictor of changes in FEV1. This analysis was only performed on those PRM metrics found to generate significant differences between ΔFEV1 groups within strata. Using a discriminant analysis with cross-validation, a statistical model of PRM was generated that classified a strata population into 2 predicted groups of ΔFEV1. An optimal cutoff for PRM was determined using a Receiver Operator Characteristic (ROC) analysis where the PRM metric served as an independent variable and the new predicted dichotomized variable ΔFEV1 as the outcome.
30-Day Interval Data
Repeatability analysis of our PRM metrics was performed using the 30-day interval data. Here we assumed negligible changes in lung parenchyma due to emphysematous processes in COPD. Absolute thresholds indicating likely change in the individual PRM metrics were determined by calculating 95% confidence intervals on the repeated measures. Serial differences in inspiration and expiration CT volumes were evaluated using a paired Student’s t-test.
RESULTS
Baseline characteristics from the one-year interval subjects are provided in Table 1. No significant differences in characteristics were observed between strata. PRM values were found to be significantly correlated to FEV1 at both interval time points (data not shown), consistent with previous results obtained from the COPDGene cohort (28). For each strata, only PRM values from stratum 3 had significant correlations with FEV1 at both time points (p<0.01). When evaluating PRM differences between time points in each strata, only PRMEmph from stratum 4 was found to vary significantly (19±3% to 21±3% (p=0.01)).
Next, we evaluated PRM in our population separated based on increasing or decreasing FEV1 (ΔFEV1) over a one-year period in each strata (Table 2). Two cases, both stratum 3, are presented in Figure 1. The first case illustrates rapid progression of fSAD over the one-year period (28% to 42%, yellow voxels; Figure 1A) with a near equal drop in PRMNormal (67% to 52%, green voxels) and FEV1 drop from 2.31L to 1.73L. In the second case (Figure 1B) the converse has occurred with PRMfSAD decreasing from 36% to 22% and an increase in PRMNormal from 60% to 76% (FEV1 change from 1.36L to 1.94L). Subject characteristics and most baseline PRM measures were not found to be significantly different between ΔFEV1 groups per strata (Figure 2A–C). Only baseline values of PRMfSAD in stratum 2 were found to be significantly different (p=0.05; Figure 2). PRMfSAD was three times higher in subjects with improved lung function (group ΔFEV1≥0, ΔFEV1=0.10±0.01L, n=6) than subjects with declined lung function (group ΔFEV1<0, ΔFEV1=−0.15±0.02L, n=9). Follow-up PRMfSAD between groups (12.3±2.2% for ΔFEV1≥0 and 4.1±1.0% for ΔFEV1<0, p=0.003) were similar to those observed for baseline values. Nevertheless PRMfSAD may serve as a baseline predictor of more severe pulmonary complications for stratum 2 subjects. Our discriminant model correctly classified 73.3% of cross-validated grouped cases in stratum 2. Model sensitivity and specificity was 0.727 and 0.750, respectively, with an optimal cutoff for baseline PRMfSAD of 9% total lung volume.
Table 2.
FEV1 at baseline and one year follow-up by group
| Strata | Δ FEV1 (n) | FEV1 | ||
|---|---|---|---|---|
| BL | FU | Δ | ||
| 2 |
 (6) (6) |
2.75(1.07) | 2.87(1.03) | .08(.08) |
 (9) (9) |
3.23(.86) | 3.02(.82) | −.33(.62) | |
| 3 |
(18) |
1.93(.70) | 2.03(.69) | .13(.15) |
|
(23) |
2.06(.54) | 1.75(.74) | −.21(.12) | |
| 4 |
(8) |
0.85(.25) | 0.94(.26) | .09(.05) |
|
(12) |
0.93(.28) | 0.84(.30) | −.09(.05) | |
Values in mean(std) liters.
FEV1 increase and
FEV decrease at one year. BL baseline FU follow-up Δ change from baseline to follow-up.
Figure 1.
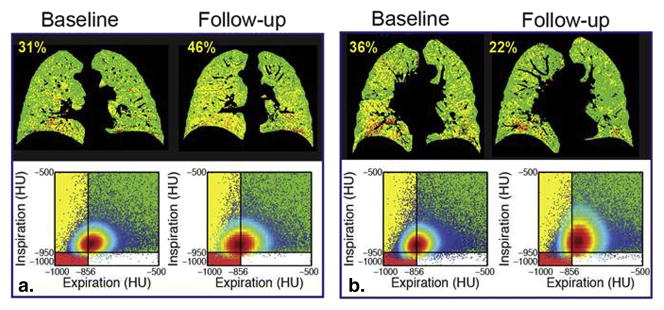
Temporal changes in fSAD as determined by PRM. Representative coronal PRM slice (top) with corresponding Cartesian plot of voxels with paired HU values (bottom) at baseline and 1-year follow-up from cases with (A) increasing and (B) decreasing PRMfSAD. These cases are indicated by (A) * and (B) † in Figure 2. PRMfSAD values are provided in yellow text top-left of PRM image.
Figure 2.
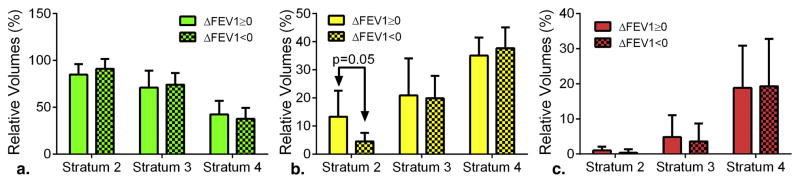
PRM as a predictive measure of advancing airflow obstruction. Bar plots of (A) PRMNormal, (B) PRMfSAD and (C) PRMEmph are presented for the one-year interval subject population stratified by increasing (ΔFEV1≥0) and decreasing (ΔFEV1<0) FEV1 and GOLD status. Data is presented as mean ± SEM.
Using the 30-day interval CT data for test-retest analysis, we determined thresholds that indicate disease-provoked changes in PRM metrics. No significant variation in inspiration and expiratory CT lung volumes were observed over this interval (data not shown). The 95% confidence intervals for changes in PRMNormal, PRMfSAD, and PRMEmph were found to be 6%, 7% and 1%, respectively. From the one-year interval cohort, we determined the prevalence of subjects who generated values of |ΔPRM|>threshold per stratum (Table 3). In stratum 2, one subject was found to have a significant change in PRM values. The prevalence for change increased substantially for stratum 3 subjects (41%) with PRMfSAD and PRMNormal producing equal contributions of subjects with significant increasing and decreasing values, respectively. In contrast, stratum 4 subjects had a large predominance of increasing PRMEmph with 83% of all ΔPRMEmph associated with progressive emphysema over the one-year period.
Table 3.
Prevalence of Change in PRM Metrics
| Strata | PRMNormal | PRMfSAD | PRMEmph | PRM | |||
|---|---|---|---|---|---|---|---|
|
|
|
|
|
|
|
or
|
|
| 2 | 1 (7%) | 0 | 0 | 1 (7%) | 0 | 0 | 1 of 15(7%) |
| 3 | 4 (10%) | 8 (20%) | 4 (10%) | 4 (10%) | 5 (12%) | 3 (7%) | 17 of 41 (41%) |
| 4 | 2 (10%) | 1 (5%) | 0 | 2 (10%) | 10 (50%) | 2 (10%) | 3 of 20 (65%) |
|
| |||||||
| Total | 31 of 76 (41%) | ||||||
Note: Indicated for each PRM metric and group is the population with positive (
) and negative (
) change values beyond the change 95% interval threshold identified using testretest cohort and also the % within the stratum.
We have previously reported a strong non-linear relationship between PRMfSAD and PRMEmph that suggests fSAD as a transitional phase from normal parenchyma to emphysema (23). Many subjects with significant changes in PRMfSAD (yellow arrows in Figure 3; * and † indicate cases from Figure 1A and 1B, respectively) had PRMEmph<10%. Those with PRMEmph>30% were either found to have progressive emphysema with declining PRMfSAD (red arrows in Figure 3; ‡ indicates the case in Figure 4) or stable (i.e. unchanged). Subjects with PRMEmph values between 10 and 30% had highly variable combinations of PRMfSAD and PRMEmph, sometimes resulting in significant changes in both measures (orange arrows in Figure 3). Subjects with non-significant ΔPRM are represented by dots positioned at the mean baseline and follow-up PRM values. The gray region in Figure 3 denotes arbitrary bounds generated from our model simulations. The lower bound of the gray region was generated from equal rate constants (i.e. kNormal →fSAD = kfSAD→Normal = kfSAD→Emph =1). Reducing kfSAD→ Emph and kfSAD→ Emph by 1/3 simulated the upper bound observed in the experimental data.
Figure 3.

Capture of COPD progression by PRM. Scatter plot of subject PRMfSAD and PRMEmph values over a one-year interval. Arrows indicate subjects with significant changes in PRMfSAD (yellow), PRMEmph (red) or both (orange). Black dots are the mean baseline and follow-up PRM values for subjects with changes in PRM smaller than predetermined thresholds from 30-day interval CT data. Cases with decreasing emphysema are represented as dots (N=5; Table 2). The gray region indicates simulation bounds generated from the compartment model with rate constants [kNormal→fSAD, kfSAD→Normal, kfSAD→Emph] equal to [1, 1, 1] and [1, 0.33, 0.33] for the lower and upper bound, respectively. Emphysema was assumed irreversible for all simulations (i.e. kEmph→fSAD=0) and all rate constants were normalized to kNormal→fSAD. *, † and ‡ indicate the three cases represented in Figures 1A, 1B and 4, respectively.
Figure 4.

PRM illustration of small airway disease as a precursor of emphysema. Presented are representative PRM slices at baseline (A: PRMNormal=54, PRMfSAD=33 and PRMEmph=10) and follow-up (B: PRMNormal=53, PRMfSAD=29 and PRMEmph=14). The source of emphysema at follow-up is shown in (C) where follow-up PRMEmph voxels indicated in (D) are colored by their baseline PRM classification. This case is indicated by ‡ in Figure 2.
Finally, we performed “voxel-based tracking” that enabled PRM to spatially identify the origin of emphysematous tissue for a single case. The one-year interval PRM data presented in Figure 4 (‡ in Figure 3) is from a GOLD 2 subject where FEV1 dropped from 2.34 L to 2.12 L. The CT examinations were spatially aligned to a single geometric space, such that each voxel consisted of two PRM images (Figure 4A–B). By mapping the voxels classified as PRMEmph at follow-up (Figure 4D) to the baseline PRM, we were able to determine the voxels’ original classification one year earlier (Figure 4C). We found that although 36% of all follow-up emphysema voxels were emphysema in origin, 48% of these voxels were PRMfSAD and 12% were normal parenchyma 1 year earlier (Figure 4C).
DISCUSSION
With the recognition that treatment of COPD must seek early intervention to minimize development of emphysema, there is growing interest in the early detection and accurate monitoring of the reversible inflammatory component of COPD, i.e. small airways disease (SAD). Here we demonstrated how PRM, an original voxel-based imaging technique applied to paired inspiratory and expiratory CT lung scans, can temporally quantify and spatially display COPD phenotypes. Data provided from the SPIROMICS clinical trial provided us with the ability to evaluate the capability of PRM for following temporal disease-specific changes in the lungs of COPD subjects. Observations include the reversibility of fSAD in subjects with minimal emphysema, the transition of normal parenchyma to emphysema via fSAD (28, 29), the excellent sensitivity of PRM for monitoring COPD progression which might not be detectable by pulmonary function tests, and confirmation of an early increase in PRMfSAD followed by a loss in PRMfSAD as PRMEmph increases suggesting that early detection and intervention may be important for the prevention of disease progression.
This study suggests that PRM has the potential for providing unique insight into the temporal evolution of COPD phenotypes. Negligible emphysema, primarily in stratum 3 subjects, was associated with a wide distribution of PRMfSAD values (10 to 50% of lung volume). We identified 8 of 41 stratum 3 subjects with significant changes in PRMfSAD at equal occurrences of increasing and decreasing values (Figure 3 yellow/orange arrows and Table 3). As emphysema increased mean PRMfSAD values dropped towards an asymptotic value of ~20% with individual PRMfSAD values deviating less over the one-year period. This trend was captured in our model simulations, which illustrated COPD progression through fSAD-dominant to emphysema-dominant disease states. It is important to note that the mathematical model provides an average trajectory a COPD patient might follow. Our simulation suggests that transition from normal parenchyma to fSAD is a rapid process with fSAD to emphysema a much slower process, both evidenced in the SPIROMICS data. Although the putative inflammatory process (i.e. fSAD) was highly volatile as shown by large changes in PRMfSAD, the drop in PRMfSAD with elevated levels of PRMEmph suggests a transition to a more chronic disease state. In fact, stratum 4 subjects with severe emphysema still showed dynamic changes in PRMfSAD and PRMEmph (Figure 3) while relative volumes of normal parenchyma (PRMNormal) remained around 17% (~83% of total lung volume is diseased as determined by PRM). These PRM values were consistent with McDonough’s findings showing a reduction of 72 to 89% in the number of terminal bronchioles in GOLD 4 subjects (29). Although PRM provides an indirect measure of small airways disease, our findings support the current literature that SAD is not just a COPD phenotype but, if left unchecked, may lead to a more chronic inflammatory disease resulting in tissue destruction (i.e. emphysema) (29).
Although we have identified thresholds that can be used to indicate disease-related changes in the PRM measures, other non COPD-related factors may result in significant PRM variations. One of the most well documented alterations in pulmonary function is a consequence of the normal aging process (33, 34). Nevertheless, it is reasonable to assume that only subtle age-related changes in HU values would occur over a one-year period (35). The factor contributing most to PRM variation is experimental noise. Additional 30-day interval data would be required to fully ascertain the impact of scanner types and the subsequent variability in HU values (i.e. instrument noise) on PRM thresholds. In general, the best clinical practice for the use of CT in diagnosing COPD is to use a well-calibrated, high-resolution CT and to apply consistent acquisition and reconstruction parameters (32), accomplished in this instance by using a single institutional cohort of the SPIROMICS data. PRM may provide erroneous results from multiple-time-point paired CT examinations that do not take precautionary measures to avoid acquisition or reconstruction inconsistencies. Although the limitations and validation of the PRM technique will require more study using a larger cohort and additional time points, fSAD and emphysema have been shown here to have distinct trends with an innate relationship that can be monitored longitudinally.
New biomarkers are essential for early diagnosis, patient-tailored therapy and ultimately improved patient outcomes in COPD (3, 36). As an emerging CT biomarker of COPD subtype, PRM is poised to improve individualized patient care through disease subtyping and treatment monitoring as well as providing for improved screening and serving as an outcome measure for clinical trials.
Supplementary Material
Modeling of COPD Progression by PRM. Scatter plot of the relative lung volumes of PRMfSAD and PRMEmph (A) with arrows indicating subjects with significant changes in PRMfSAD (yellow), PRMEmph (red) or both (orange). Black dots are the mean baseline and follow-up PRM values. Cases with decreasing emphysema were presented by dots (N=5; Table 2). The gray region indicates bounds of the compartment model simulations with rate constants [1, 1, 1] for the lower bound, [1, 0.66, 0.66] for the middle line, and [1, 0.33, 0.33] for the upper bound ([kG→Y, kY→G, kY→R], respectively). Emphysema was assumed irreversible for all simulations (i.e. kR→Y=0) and all rate constants were normalized to kG→Y. A range of solutions to G(t), Y(t), and R(t) are shown in (B) corresponding to the gray lines in (A) plotted on an arbitrary time axis. Varying rates of transition can result in varying relative volumes of PRMNormal, PRMfSAD, and PRMEmph tissues. Note that using this model, slower rates of transition to emphysema result in more than 50% of the lungs being classified as PRMfSAD.
Acknowledgments
Sources of Support: The Subpopulations and Intermediate Outcomes in COPD Study (SPIROMICS) is funded by contract from the National Heart, Lung, and Blood Institute (NHLBI) (HHSN268200900013C, HHSN268200900014C, HHSN268200900015C, HHSN268200900016C, HHSN268200900017C, HHSN268200900018C, HHSN2682009000019C, HHSN268200900020C). This work was also supported by the US National Institutes of Health research grants R01HL122438, P50CA93990, P01CA085878 and R44HL118837. J.L.B. is a recipient of support from the US National Institutes of Health training grant T32EB005172.
We would like to acknowledge the SPIROMICS investigators for providing the CT scans and data used in this study.
APPENDIX
Computational Model
We previously observed a PRM trend of increasing PRMfSAD at early GOLD status, variable mixes of PRMfSAD and PRMEmph at GOLD 2 & 3, and PRMEmph predominance with a consistent contribution of PRMfSAD at GOLD 4 (supplemental Figure 3 in (28)). To further explicate these PRM trends over time we derived a linear 3-compartment system with conservation of volume to simulate the trends observed. COPD is hypothesized to progress from normal lung through fSAD to emphysema by the following linear process:
| (Eqn. 1) |
From this model, disease progression was simulated from the proposed system of linear ordinary differential equations:
| (Eqn. 2) |
with initial conditions,
where G, Y and R represent PRMNormal, PRMfSAD, and PRMEmpf, respectively.
The analytical solution for this system of differential equations and initial conditions are:
| (Eqn. 3) |
where
Assuming that emphysema is a permanent disease state (kR→Y= 0) further simplifies the solution to:
| (Eqn. 4) |
These equations model the global physical process of COPD progression in the absence of short-term exacerbations and/or treatments.
Footnotes
Author Contribution: J.L.B. optimized image registration, conducted data and statistical analyses and wrote the manuscript, B.A.H. derived the mathematical model and performed simulations, M.B., R.C. aided in image registration and performed PRM on image data, M.K.H. obtained images and PFT data, T.D.J. assisted with the statistical analysis, E.A.K., F.J.M., B.A.H. and B.D.R. contributed to the design of the study and manuscript preparation, and C.J.G. supervised the project, assisted with model simulations, data and statistical analysis and manuscript preparation. E.A.H. designed the CT protocol, supervised scan acquisition, performed QC and participated in manuscript preparation.
Publisher's Disclaimer: This is a PDF file of an unedited manuscript that has been accepted for publication. As a service to our customers we are providing this early version of the manuscript. The manuscript will undergo copyediting, typesetting, and review of the resulting proof before it is published in its final citable form. Please note that during the production process errors may be discovered which could affect the content, and all legal disclaimers that apply to the journal pertain.
References
- 1.Mannino DM, Buist AS. Global burden of COPD: risk factors, prevalence, and future trends. Lancet. 2007;370(9589):765–73. doi: 10.1016/S0140-6736(07)61380-4. [DOI] [PubMed] [Google Scholar]
- 2.Bousquet J, Dahl R, Khaltaev N. Global Alliance against Chronic Respiratory Diseases. Eur Respir J. 2007;29(2):233–9. doi: 10.1183/09031936.00138606. [DOI] [PubMed] [Google Scholar]
- 3.Vestbo J, Hurd SS, Agusti AG, et al. Global strategy for the diagnosis, management, and prevention of chronic obstructive pulmonary disease: GOLD executive summary. Am J Respir Crit Care Med. 2013;187(4):347–65. doi: 10.1164/rccm.201204-0596PP. [DOI] [PubMed] [Google Scholar]
- 4.Agusti A, Sobradillo P, Celli B. Addressing the complexity of chronic obstructive pulmonary disease: from phenotypes and biomarkers to scale-free networks, systems biology, and P4 medicine. American journal of respiratory and critical care medicine. 2011;183(9):1129–37. doi: 10.1164/rccm.201009-1414PP. [DOI] [PubMed] [Google Scholar]
- 5.Morrow DA, de Lemos JA. Benchmarks for the assessment of novel cardiovascular biomarkers. Circulation. 2007;115(8):949–52. doi: 10.1161/CIRCULATIONAHA.106.683110. [DOI] [PubMed] [Google Scholar]
- 6.Celli BR, Cote CG, Marin JM, et al. The body-mass index, airflow obstruction, dyspnea, and exercise capacity index in chronic obstructive pulmonary disease. N Engl J Med. 2004;350(10):1005–12. doi: 10.1056/NEJMoa021322. [DOI] [PubMed] [Google Scholar]
- 7.Puhan MA, Garcia-Aymerich J, Frey M, et al. Expansion of the prognostic assessment of patients with chronic obstructive pulmonary disease: the updated BODE index and the ADO index. Lancet. 2009;374(9691):704–11. doi: 10.1016/S0140-6736(09)61301-5. [DOI] [PubMed] [Google Scholar]
- 8.Barnes PJ. Immunology of asthma and chronic obstructive pulmonary disease. Nat Rev Immunol. 2008;8(3):183–92. doi: 10.1038/nri2254. [DOI] [PubMed] [Google Scholar]
- 9.Bergin C, Muller N, Nichols DM, et al. The diagnosis of emphysema. A computed tomographic-pathologic correlation. Am Rev Respir Dis. 1986;133(4):541–6. doi: 10.1164/arrd.1986.133.4.541. [DOI] [PubMed] [Google Scholar]
- 10.Mishima M, Hirai T, Itoh H, et al. Complexity of terminal airspace geometry assessed by lung computed tomography in normal subjects and patients with chronic obstructive pulmonary disease. Proceedings of the National Academy of Sciences of the United States of America. 1999;96(16):8829–34. doi: 10.1073/pnas.96.16.8829. [DOI] [PMC free article] [PubMed] [Google Scholar]
- 11.Hoesein FAM, van Rikxoort E, van Ginneken B, et al. Computed tomography-quantified emphysema distribution is associated with lung function decline. European Respiratory Journal. 2012;40(4):844–50. doi: 10.1183/09031936.00186311. [DOI] [PubMed] [Google Scholar]
- 12.Yilmaz C, Dane DM, Patel NC, Hsia CC. Quantifying heterogeneity in emphysema from high-resolution computed tomography: a lung tissue research consortium study. Acad Radiol. 2013;20(2):181–93. doi: 10.1016/j.acra.2012.09.013. [DOI] [PMC free article] [PubMed] [Google Scholar]
- 13.Newman KB, Lynch DA, Newman LS, Ellegood D, Newell JD., Jr Quantitative computed tomography detects air trapping due to asthma. Chest. 1994;106(1):105–9. doi: 10.1378/chest.106.1.105. [DOI] [PubMed] [Google Scholar]
- 14.Matsuoka S, Kurihara Y, Yagihashi K, Hoshino M, Watanabe N, Nakajima Y. Quantitative assessment of air trapping in chronic obstructive pulmonary disease using inspiratory and expiratory volumetric MDCT. AJR Am J Roentgenol. 2008;190(3):762–9. doi: 10.2214/AJR.07.2820. [DOI] [PubMed] [Google Scholar]
- 15.Busacker A, Newell JD, Keefe T, et al. A multivariate analysis of risk factors for the air-trapping asthmatic phenotype as measured by quantitative CT analysis. CHEST Journal. 2009;135(1):48–56. doi: 10.1378/chest.08-0049. [DOI] [PMC free article] [PubMed] [Google Scholar]
- 16.Nakano Y, Muro S, Sakai H, et al. Computed tomographic measurements of airway dimensions and emphysema in smokers. Correlation with lung function. Am J Respir Crit Care Med. 2000;162(3 Pt 1):1102–8. doi: 10.1164/ajrccm.162.3.9907120. [DOI] [PubMed] [Google Scholar]
- 17.Hackx M, Bankier AA, Gevenois PA. Chronic Obstructive Pulmonary Disease: CT Quantification of Airways Disease. Radiology. 2012;265(1):34–48. doi: 10.1148/radiol.12111270. [DOI] [PubMed] [Google Scholar]
- 18.Xu Y, Sonka M, McLennan G, Guo J, Hoffman EA. MDCT-based 3-D texture classification of emphysema and early smoking related lung pathologies. Medical Imaging, IEEE Transactions on. 2006;25(4):464–75. doi: 10.1109/TMI.2006.870889. [DOI] [PubMed] [Google Scholar]
- 19.Ginsburg SB, Lynch DA, Bowler RP, Schroeder JD. Automated texture-based quantification of centrilobular nodularity and centrilobular emphysema in chest CT images. Acad Radiol. 2012;19(10):1241–51. doi: 10.1016/j.acra.2012.04.020. [DOI] [PMC free article] [PubMed] [Google Scholar]
- 20.Castaldi PJ, San Jose Estepar R, Mendoza CS, et al. Distinct quantitative computed tomography emphysema patterns are associated with physiology and function in smokers. Am J Respir Crit Care Med. 2013;188(9):1083–90. doi: 10.1164/rccm.201305-0873OC. [DOI] [PMC free article] [PubMed] [Google Scholar]
- 21.Reinhardt JM, Ding K, Cao K, Christensen GE, Hoffman EA, Bodas SV. Registration-based estimates of local lung tissue expansion compared to xenon CT measures of specific ventilation. Med Image Anal. 2008;12(6):752–63. doi: 10.1016/j.media.2008.03.007. [DOI] [PMC free article] [PubMed] [Google Scholar]
- 22.Murphy K, Pluim JP, van Rikxoort EM, et al. Toward automatic regional analysis of pulmonary function using inspiration and expiration thoracic CT. Medical physics. 2012;39(3):1650–62. doi: 10.1118/1.3687891. [DOI] [PubMed] [Google Scholar]
- 23.Alford SK, van Beek EJ, McLennan G, Hoffman EA. Heterogeneity of pulmonary perfusion as a mechanistic image-based phenotype in emphysema susceptible smokers. Proceedings of the National Academy of Sciences. 2010;107(16):7485–90. doi: 10.1073/pnas.0913880107. [DOI] [PMC free article] [PubMed] [Google Scholar]
- 24.Matsuoka S, Washko GR, Dransfield MT, et al. Quantitative CT Measurement of Cross-sectional Area of Small Pulmonary Vessel in COPD: Correlations with Emphysema and Airflow Limitation. Acad Radiol. 2010;17(1):93–9. doi: 10.1016/j.acra.2009.07.022. [DOI] [PMC free article] [PubMed] [Google Scholar]
- 25.Wells JM, Washko GR, Han MK, et al. Pulmonary arterial enlargement and acute exacerbations of COPD. New England Journal of Medicine. 2012;367(10):913–21. doi: 10.1056/NEJMoa1203830. [DOI] [PMC free article] [PubMed] [Google Scholar]
- 26.Estepar RS, Kinney GL, Black-Shinn JL, et al. Computed tomographic measures of pulmonary vascular morphology in smokers and their clinical implications. Am J Respir Crit Care Med. 2013;188(2):231–9. doi: 10.1164/rccm.201301-0162OC. [DOI] [PMC free article] [PubMed] [Google Scholar]
- 27.Lynch DA, Al-Qaisi MA. Quantitative computed tomography in chronic obstructive pulmonary disease. J Thorac Imaging. 2013;28(5):284–90. doi: 10.1097/RTI.0b013e318298733c. [DOI] [PMC free article] [PubMed] [Google Scholar]
- 28.Galbán CJ, Han MK, Boes JL, et al. Computed tomography-based biomarker provides unique signature for diagnosis of COPD phenotypes and disease progression. Nat Med. 2012;18(11):1711–5. doi: 10.1038/nm.2971. [DOI] [PMC free article] [PubMed] [Google Scholar]
- 29.McDonough JE, Yuan R, Suzuki M, et al. Small-airway obstruction and emphysema in chronic obstructive pulmonary disease. N Engl J Med. 2011;365(17):1567–75. doi: 10.1056/NEJMoa1106955. [DOI] [PMC free article] [PubMed] [Google Scholar]
- 30.Couper D, LaVange LM, Han M, et al. Design of the Subpopulations and Intermediate Outcomes in COPD Study (SPIROMICS) Thorax. 2013 doi: 10.1136/thoraxjnl-2013-203897. thoraxjnl-2013-203897. [DOI] [PMC free article] [PubMed] [Google Scholar]
- 31.Rabe KF, Hurd S, Anzueto A, et al. Global strategy for the diagnosis, management, and prevention of chronic obstructive pulmonary disease: GOLD executive summary. American journal of respiratory and critical care medicine. 2007;176(6):532–55. doi: 10.1164/rccm.200703-456SO. [DOI] [PubMed] [Google Scholar]
- 32.Sieren JP, Newell JD, Judy PF, et al. Reference standard and statistical model for intersite and temporal comparisons of CT attenuation in a multicenter quantitative lung study. Medical physics. 2012;39(9):5757–67. doi: 10.1118/1.4747342. [DOI] [PMC free article] [PubMed] [Google Scholar]
- 33.Janssens JP. Aging of the respiratory system: impact on pulmonary function tests and adaptation to exertion. Clin Chest Med. 2005;26(3):469–84. vi–vii. doi: 10.1016/j.ccm.2005.05.004. [DOI] [PubMed] [Google Scholar]
- 34.Turner JM, Mead J, Wohl ME. Elasticity of human lungs in relation to age. J Appl Physiol. 1968;25(6):664–71. doi: 10.1152/jappl.1968.25.6.664. [DOI] [PubMed] [Google Scholar]
- 35.Hoffman EA, Ahmed FS, Baumhauer H, et al. Variation in the Percent of Emphysema-like Lung in a Healthy, Nonsmoking Multiethnic Sample. The MESA Lung Study. Annals of the American Thoracic Society. 2014;11(6):898–907. doi: 10.1513/AnnalsATS.201310-364OC. [DOI] [PMC free article] [PubMed] [Google Scholar]
- 36.Barnes PJ. New anti-inflammatory targets for chronic obstructive pulmonary disease. Nat Rev Drug Discov. 2013;12(7):543–59. doi: 10.1038/nrd4025. [DOI] [PubMed] [Google Scholar]
Associated Data
This section collects any data citations, data availability statements, or supplementary materials included in this article.
Supplementary Materials
Modeling of COPD Progression by PRM. Scatter plot of the relative lung volumes of PRMfSAD and PRMEmph (A) with arrows indicating subjects with significant changes in PRMfSAD (yellow), PRMEmph (red) or both (orange). Black dots are the mean baseline and follow-up PRM values. Cases with decreasing emphysema were presented by dots (N=5; Table 2). The gray region indicates bounds of the compartment model simulations with rate constants [1, 1, 1] for the lower bound, [1, 0.66, 0.66] for the middle line, and [1, 0.33, 0.33] for the upper bound ([kG→Y, kY→G, kY→R], respectively). Emphysema was assumed irreversible for all simulations (i.e. kR→Y=0) and all rate constants were normalized to kG→Y. A range of solutions to G(t), Y(t), and R(t) are shown in (B) corresponding to the gray lines in (A) plotted on an arbitrary time axis. Varying rates of transition can result in varying relative volumes of PRMNormal, PRMfSAD, and PRMEmph tissues. Note that using this model, slower rates of transition to emphysema result in more than 50% of the lungs being classified as PRMfSAD.