Abstract
Standard approaches to evaluate scar formation within histological sections rely on qualitative evaluations and scoring, which limits our understanding of the remodeling process. We have recently developed an image analysis technique for the rapid quantification of fiber alignment at each pixel location. The goal of this study was to evaluate its application for quantitatively mapping scar formation in histological sections of cutaneous burns. To this end, we utilized directional statistics to define maps of fiber density and directional variance from Masson’s Trichrome stained sections for quantifying changes in collagen organization during scar remodeling. Significant increases in collagen fiber density are detectable soon after burn injury in a rat model. Decreased fiber directional variance in the scar was also detectable between 3 weeks and 6 months after injury, indicating increasing fiber alignment. This automated analysis of fiber organization can provide objective surrogate endpoints for evaluating cutaneous wound repair and regeneration.
Keywords: Collagen, fiber alignment, burns, scar remodeling, image analysis
Background
Evaluating collagen fiber organization in the dermis is critical to diagnosing disease, assessing the status of healing wounds, and characterizing tissue regeneration (1–5). However, to evaluate this organization, standard approaches rely on qualitative descriptions or subjective scoring systems, which prevent comparisons among studies and limit our understanding of the underlying remodeling processes. Image analysis approaches, such as those that rely on two-dimensional Fourier transforms (6, 7), have been developed to define a global fiber orientation distribution within an image, but these techniques lack the ability to localize regions of high fiber alignment, such as that found in a hypertrophic scar. Thus, establishing quantitative markers to objectively identify anomalies in collagen matrix formation remains a challenge in the laboratory and clinic.
Questions addressed
The goal of this study was to determine whether it is possible to quantify collagen fiber alignment and density from standard histological sections through automated image analysis approaches. To address this question, we have utilized a recently developed technique for the rapid quantification of fiber alignment at each pixel within images (8), and have integrated directional statistics with traditional image processing methods to create quantitative fiber organization maps for objectively characterizing scar remodeling following cutaneous burn injury.
Experimental Design
To evaluate the wound healing response following burn injury, 6-week old female Sprague-Dawley rats (Charles River Laboratories, Wilmington, MA) were utilized. All animal procedures were performed in accordance with the guidelines of the National Institutes of Health (NIH) and approved by the Massachusetts General Hospital IACUC. Animals were anesthetized, and full-thickness third-degree burns (1 cm2) were created on the dorsum by pressing a brass block preheated to approximately 95°C to the skin for 10 seconds as previously described (9). Tissue was harvested at 3 days, 1 week, 3 weeks, 2 months, and 6 months after burn injury (n=4/time point), as well as from uninjured control animals at 2 months. Tissue was processed, sectioned, and stained with Masson’s trichrome by the Rodent Histopathology Core at Harvard Medical School, and color images of each tissue section were acquired using Hamamatsu’s NanoZoomer Digital Pathology System (20x objective, NA 0.75). Images were analyzed by an experienced dermatopathologist (MCM).
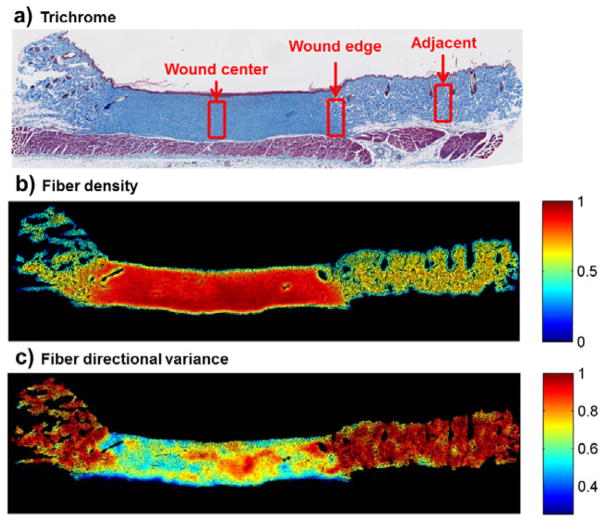
Each trichrome tissue section image of approximately 18 megapixels (1.81μm/pixel resolution) was analyzed using custom-written code in Matlab (Mathworks, Natick, MA). Collagen fibers that were stained blue were most clearly identified by a decrease in the transmission intensity in the red channel, and collagen-positive pixels were defined where the ratio of blue to red intensities exceeded 2 (Steps ii and iii in Fig. S1). To minimize computational time, all images were automatically rotated and cropped to include only the collagen region of the dermis. Fiber orientation was computed with 2.5° accuracy at each pixel using the red channel of each image through a previously published algorithm that utilizes a weighted alignment vector summation technique within an 11×11 pixel window (8). To measure the relative local strength of fiber alignment, directional variance was computed at each pixel from all fiber orientations within a 50 pixel radius (Steps iv–xi in Fig. S1). Similarly, to visualize the local fiber density surrounding each pixel, the relative fraction of collagen-positive pixels within a 50 pixel radius was calculated through spatial convolution with a disk kernel (Step vii). Parametric analysis using images from uninjured control and week 8 burn sections (Fig. S2) guided the selection of the radius over which local fiber properties were calculated and the red:blue color threshold to define collagen-positive pixels. Although additional increases in disk radius yielded modest improvements in scar discrimination (Fig. S2), a 50 pixel radius was selected to retain the ability to identify local heterogeneity in tissue characteristics. Subregions of 300×700μm corresponding to the wound center, wound edge, and uninjured adjacent tissue were predefined through blinded evaluation of the Trichrome images (Fig. 1), and the average fiber density and directional variance within these discrete locations were computed. ANOVAs with post-hoc Tukey HSD tests were used to assess differences among injury time points within each of these locations.
Figure 1. Fiber density and directional variance from a representative sample 6 months after burn injury.
(a) Wound regions were manually selected within a 0.3 × 0.7 mm window delineating the wound center, wound edge, and an adjacent uninjured region. (b) Automated colorimetric analysis of each pixel enabled the identification of collagen-containing pixels, and collagen fiber density (processing step vii in Figure S1) measurements were significantly higher within the scar. (c) Pixel-wise fiber directional analysis enabled quantification of the local strength of collagen fiber alignment, and fiber directional variance (step xi in Figure S1) was significantly lower within the scar.
Results
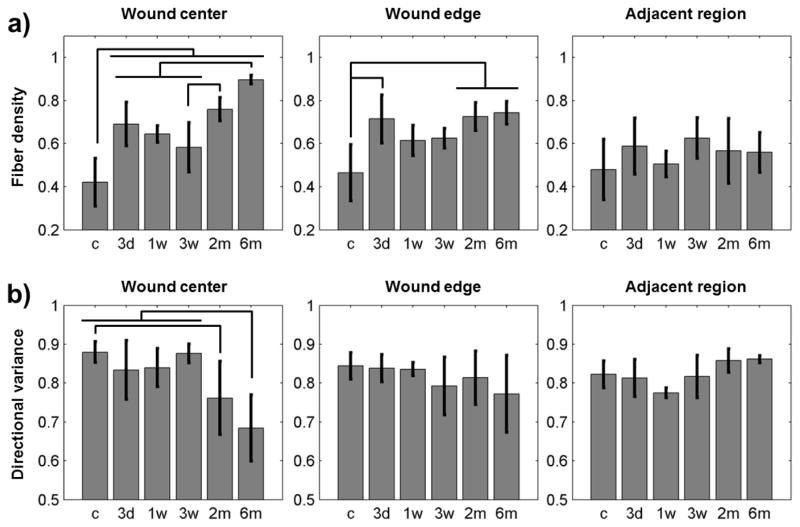
Following third-degree burn injury, an eschar was evident at 3 days and 1 week. In the time points that followed, a scar formed with no regeneration of sebaceous glands or hair follicles and collagen fibers increasingly aligned parallel to the skin surface. Both fiber density and directional variance were able to clearly delineate the scar region 6 months after burn injury (Fig. 1). A significant increase in fiber density and decrease in fiber directional variance were detected at the site of burn injury from 3 weeks through 6 months, indicating sensitivity to scar formation (Fig. 2, Fig. S3). The center of the wound contained a significantly greater fiber density at all post-burn time points (p≤0.0455) compared to uninjured control tissue. After eschar detachment, fiber density was also greater (p≤0.0315) at 2 and 6 months relative to the 3 week time point (Fig. 2a). The variance of fiber directions in the center of the wound was significantly lower at 2 and 6 months compared to control tissue (p≤0.0488), indicating an increase in fiber alignment (Fig. 2b). Directional variance at 6 months was also lower than all post-injury time points up to 3 weeks (p≤0.0277). The wound edge demonstrated similar, but attenuated, increases in fiber density over time, with no significant differences in directional variance (Fig. 2). Adjacent uninjured tissue regions did not significantly change relative to control with either metric (Fig. 2).
Figure 2. Quantification of fiber density and directional variance within different wound regions.
(a) Fiber density in the center of the burn wound was significantly elevated relative to control tissue, and significant increases in density were identified from 3 weeks through 6 months. Changes in fiber density with respect to time were attenuated at the wound edge, but significantly higher density was detected at 3 days, 2 months, and 6 months relative to control. No differences in fiber density were detected in the regions adjacent to the wound. (b) Directional variance began to decrease after 3 weeks, with significant differences relative to control detected at 2 and 6 months. No significant differences in fiber alignment were detected at the wound edge or adjacent tissue.
Conclusion
Automated pixel-wise analysis of fiber orientation within histology images enabled the quantification of increasing collagen fiber alignment and density during cutaneous scar formation after eschar detachment. This analysis technique offers a straightforward approach to track tissue remodeling and may provide objective surrogate endpoints for evaluating the collagen organization of human scar tissues in preclinical and clinical research.
Supplementary Material
Acknowledgments
This study was supported by NIH grant F32AR061933 to KPQ, American Cancer Society grant RSG-09-174-01-CCE to IG, NIH grant R01EB007542 to IG, and Shriners Grant #85120-BOS to AG and MY.
Footnotes
Author Contributions
KPQ developed the image analysis algorithms and analyzed the data. AG, GFB, SK, and MV designed the animal study and executed the experiments. MCM performed pathological analysis. WGA, BB, MLY, and IG provided resources and guidance. All authors assisted in writing the manuscript.
Conflict of interests
The authors report no relevant conflict of interest.
References
- 1.Kissin EY, Merkel PA, Lafyatis R. Myofibroblasts and hyalinized collagen as markers of skin disease in systemic sclerosis. Arthritis Rheum. 2006;54:3655–3660. doi: 10.1002/art.22186. [DOI] [PubMed] [Google Scholar]
- 2.Agah A, Kyriakides TR, Lawler J, et al. The lack of thrombospondin-1 (TSP1) dictates the course of wound healing in double-TSP1/TSP2-null mice. The American journal of pathology. 2002;161:831–839. doi: 10.1016/S0002-9440(10)64243-5. [DOI] [PMC free article] [PubMed] [Google Scholar]
- 3.Blackburn WR, Cosman B. Histologic basis of keloid and hypertrophic scar differentiation. Clinicopathologic correlation Archives of pathology. 1966;82:65–71. [PubMed] [Google Scholar]
- 4.Bradshaw AD, Puolakkainen P, Dasgupta J, et al. SPARC-null mice display abnormalities in the dermis characterized by decreased collagen fibril diameter and reduced tensile strength. J Invest Dermatol. 2003;120:949–955. doi: 10.1046/j.1523-1747.2003.12241.x. [DOI] [PubMed] [Google Scholar]
- 5.Garcia-Gareta E. Collagen gels and the ‘Bornstein legacy’: from a substrate for tissue culture to cell culture systems and biomaterials for tissue regeneration. Exp Dermatol. 2014;23:473–474. doi: 10.1111/exd.12404. [DOI] [PubMed] [Google Scholar]
- 6.Ayres CE, Jha BS, Meredith H, et al. Measuring fiber alignment in electrospun scaffolds: a user’s guide to the 2D fast Fourier transform approach. J Biomater Sci Polym Ed. 2008;19:603–621. doi: 10.1163/156856208784089643. [DOI] [PubMed] [Google Scholar]
- 7.Sander EA, Barocas VH. Comparison of 2D fiber network orientation measurement methods. J Biomed Mater Res A. 2009;88:322–331. doi: 10.1002/jbm.a.31847. [DOI] [PubMed] [Google Scholar]
- 8.Quinn KP, Georgakoudi I. Rapid quantification of pixel-wise fiber orientation data in micrographs. J Biomed Opt. 2013;18:046003. doi: 10.1117/1.JBO.18.4.046003. [DOI] [PMC free article] [PubMed] [Google Scholar]
- 9.Golberg A, Broelsch GF, Bohr S, et al. Non-thermal, pulsed electric field cell ablation: A novel tool for regenerative medicine and scarless skin regeneration. TECHNOLOGY. 2013;01:1–7. doi: 10.1142/S233954781320001X. [DOI] [PMC free article] [PubMed] [Google Scholar]
Associated Data
This section collects any data citations, data availability statements, or supplementary materials included in this article.


