

Abstract
Background
Epstein Barr virus (EBV) is closely associated with the development of a number of tumors. During latent infection, EBV continuously expresses a number of viral genes which are essential for cell transformation and maintenance of the malignant phenotype of EBV-related tumors. There has been no previous link between EBV and T-cell prolymphocytic leukemia (T-PLL), a distinctive form of leukemia derived from T-cells at an intermediate stage of differentiation between a cortical thymocyte and a mature peripheral blood T-cell.
Objective
To determine if EBV was present in the T-PLL cells collected.
Study design
T-PLL cells were isolated from the peripheral blood of a patient diagnosed with T-PLL and continuously cultured for about one year. The existence of EBV in these cells was detected using multiple strategies including PCR, Western blotting, immunofluorescent assay and flow cytometry analysis.
Results
The EBV genome was present in these T-PLL cells by PCR analysis across multiple sites in the viral genome. In addition, these T-PLL cells expressed a number of EBV latent antigens. The EBV oncoproteins LMP1, EBNA1 and EBNA3C were expressed in the majority of the infected cells.
Conclusion
This report suggests a potential link between EBV infection and T-PLL and provides new information about the potential contribution of EBV in the initiation or maintenance of T-PLL.
Keywords: Epstein Barr virus, T-cell prolymphocytic leukemia, infection
1. Introduction
Epstein-Barr virus (EBV) was first reported as the etiological agent of Burkitt’s lymphoma in 1964 (Epstein, Achong, and Barr, 1964). Since then, EBV has been associated with many human pathologies including nasopharyngeal carcinoma which is a highly prevalent and aggressive cancer in Southeast Asia, infectious mononucleosis, and AIDS- and transplant-related B cell lymphomas (Pattle and Farrell, 2006). EBV has also been linked to T-cell lymphomas, Hodgkin’s lymphoma, and NK leukemia or LGL leukemia (Young and Murray, 2003; Young and Rickinson, 2004), supporting the concept of a wide spectrum of EBV-associated disorders. The EBV genome encodes for a number of latent proteins such as EBNA1-3, LMP 1, 2 and others which are selectively expressed during different types of viral latency (Subramanian, Knight, and Robertson, 2002). Recent studies have demonstrated that EBNA2, EBNA-LP, EBNA3A, EBNA3C and LMP1 are important for cell transformation (Subramanian, Knight, and Robertson, 2002). Furthermore, different strategies are utilized by these latent antigens to drive virus-associated transformation or carcinogenesis among the EBV-associated disorders.
Although EBV is linked to a number of different types of tumors, the association between this virus and T-cell prolymphocytic leukemia (T-PLL) has not been previously explored. T-PLL, formerly categorized as T-cell chronic lymphocytic leukemia, is a rare and aggressive hematologic malignancy (Hoyer et al., 1995; Toyota, Nakamura, and Dan, 2002; Toyota, Nakamura, and Dan, 2005). It is a distinctive type of leukemia that is derived from T-cells at the intermediate stage of differentiation between a cortical thymocyte and a mature peripheral blood T-cell (Hoyer et al., 1995; Toyota, Nakamura, and Dan, 2002; Toyota, Nakamura, and Dan, 2005). Patients with T-PLL often have a complex karyotype with recurrent alterations that involve chromosomes 14, 11, and 8. Rearrangements of chromosome 14q32.1 through inversion [inv(14)(q11;q32)] and translocation [t(14;14)(q11;q32)] are the most common cytogenetic abnormalities reported in T-PLL (Croce, 1987; Croce et al., 1985). As a result of these rearrangements, TCL1, a gene that is physiologically expressed in CD4/CD8 double-negative thymocytes, is deregulated (Narducci et al., 1997; Narducci et al., 1995; Virgilio et al., 1994). Typically, the TCL1 locus rearranges with the T-cell receptor (TCR) α/δ chain locus in the above mentioned rearrangements, but it can also rearrange with the TCR-β chain locus on chromosome 7 in another translocation [t(7;14)(q35;q32.1)] (Narducci et al., 1997; Pekarsky, Hallas, and Croce, 2001a; Pekarsky, Hallas, and Croce, 2001b). Furthermore, several patients with mature T-cell leukemias have the translocation [t(X;14)(q28;q11)], which results in the rearrangement of the MTCP1 gene (a member of the TCL1 gene family) located at Xq28 (Madani et al., 1996; Stern et al., 1993). Therefore, chromosomal rearrangements in T-PLL juxtapose TCL1 and MTCP1 to the TCR loci and lead to their activation. Recent genomic analyses of the 14q32.1 breakpoint region has revealed three additional genes, TCL1b, TNG1 (T-CL1 neighboring gene 1), and TNG2. These have an expression pattern similar to TCL1 in that they are not expressed in normal T-cells, but are expressed in T-PLL cell lines and cells from patients with T-PLL (Hallas et al., 1999; Pekarsky et al., 1999; Sugimoto et al., 1999). Activation of TCL1 through hypomethylation of its promoter has also been described (Yuille et al., 2001). These molecular events related to the above chromosomal aberrations are believed to play a casual role in the pathogenesis of T-PLL.
EBV infects the vast majority (>90%) of healthy adults and can infect T cells in vivo (Young and Rickinson, 2004). In addition, the infection of T-cells appears to convey an increased risk of malignancy such as lymphoma. This raised the possibility that EBV might also contribute to the development of another hematologic malignancy, T-PLL. A 70 years old male T-PLL patient was observed with an increased titer of EBV antigens, suggesting that there was a high level of EBV viremia and that EBV infection might be associated with this rare malignancy. In this report, we sought to determine if EBV was present in the tumor cells obtained from this EBV-positive patient with T-PLL. We found that EBV DNA can be continuously detected in the cultured tumor cells and that the majority of the essential EBV latent genes were expressed in these cells suggesting a latency pattern that is geared toward growth of the latently infected cells.
2. Methods
2.1. Patient
The study patient was a 70 years old male diagnosed at the Hospital of the University of Pennsylvania with T-cell prolymphocytic leukemia (T-PLL) (IRB#706586). He had an increase in the EBV titer which was determined by detection of the antibody against viral capsid antigen (VCA). The diagnosis was primarily based on FACS analysis of the bone marrow aspirate as well as a peripheral blood sample. The combined clinical, morphologic (absence of flower cells) and immunophenotypic features were also consistent with T-cell prolymphocytic leukemia.
2.2. Lymphocyte isolation and cell culture
Primary lymphocytes were harvested from peripheral blood mononuclear cells using a Lymphoprep gradient as described previously (Lee et al., 2001). The enriched lymphocyte population was washed and plated at 50,000 cells in 150 μl of complete medium per well in a 96-well tissue culture plate. The cells were grown and maintained in RPMI 1640 medium (Hyclone Inc., Logan, UT) supplemented with 2 mM L-glutamine, 5 μg of gentamicin per ml, and 10% heat-inactivated fetal bovine serum. 96-well plates were incubated at 37°C with 5% CO2. The plates were treated once every 8 days with a fresh 100 μl of complete medium.
2.3. DNA lysate preparation and PCR analysis
Approximately 50,000 T-PLL cells derived from the patient’s peripheral blood cells were collected and were centrifuged at 2,000 rpm for 5 min. The cell pellet was washed with phosphate-buffered saline (PBS) twice and resuspended in 50 μl of 0.2× PBS, heated to 95°C for 15 min, and then switched to 56°C for 1 h with proteinase K treatment (10 mg/ml). The enzyme was then inactivated at 95°C for 30 min. A 5-μl portion of the lysate was used for PCR amplification of EBV-specific regions for 40 cycles, and standard protocols were followed using primers indicated in table 1. DNA was also prepared from the same number of control BJAB cells. PCR was performed by heating at 95°C for 5 min and subsequently for 40 cycles, each cycle including 95°C for 1 min, 56°C for 1 min, and 72°C for 2 min, followed by further incubation at 72°C for 10 min, in a PTC-100 programmable thermal cycler (MJ Research, Inc., Waltham, MA). Five μl aliquots of PCR products were then assayed by electrophoresis on a 2.0% ME-agarose gel and visualized by ethidium bromide.
Table 1.
Primers used for PCR analysis
| Amplified region | Primer sequences | Primer co-ordinates (NC_007605) |
|---|---|---|
| BamHI C fragment | 5′GCAGGGCTCGCAAAGTATAG3′ 5′TGCGGAAGTGACACCAAATA3′ |
11095–11855 |
| BamHI E fragment | 5′TACTGCCACCAGTACCACAACA3′ 5′GGCCGACATTCTCCAAGATAA3′ |
99939–100091 |
| BamHI W fragment | 5′CCAGACAGCAGCCAATTGTC3′ 5′GGTAGAAGACCCCCTCTTAC3′ |
17374–17502 |
2.4. Immunofluorescence assay
Immunofluorescence analyses were performed as described previously (Lan et al., 2004). One million T-PLL cells were collected and briefly fixed using a 1:1 methanol and acetone mix ice cold at −20°C, blocked in the appropriate serum, and then incubated with the pre-cleared patient serum or specific primary antibody for EBNA3C and LMP1 for 1 h. Cells were washed and then further incubated with the appropriate secondary antibody conjugated to fluorescein isothiocyanate at 1:1,000 dilutions in PBS for 1 h. Slides were washed and visualized with an Olympus XI70 inverted fluorescence microscope (Olympus Inc., Melville, NY) and photographed using a digital PixelFly camera and software (Cooke, Inc., Warren, MI).
2.5. Western blotting
T-PLL from the patient and an EBV-negative cell BJAB control were lysed with 300 μl of reporter lysis buffer (Promega, Inc., Madison, WI) respectively, and 40 μl of this lysate was used. Briefly, lysates were boiled in SDS-loading buffer, fractionated by SDS-PAGE and transferred to a 0.45 mm nitrocellulose membrane. The membranes were then probed with patient serum absorbed against B cell antigens or EBV-specific antibodies followed by incubation with appropriate infrared-tagged secondary antibodies and viewed on an Odyssey imager (LiCor Inc., Lincoln, NE).
2.6. FACS analysis
For the determination of the expression of CD3 positive cells, one million cells from patient samples, negative controls (B-cell) and antibody controls were incubated with rabbit polyclonal PE-tagged anti-CD3 antibody (2 mg/ml in PBS containing 1% BSA) for 30 min at room temperature. After thoroughly washing with 1X PBS the cells were incubated with FITC-conjugated anti LMP1 mouse monoclonal antibody for 30 min. Cells were then washed and analyzed on a flow cytometer (Becton Dickinson, San Diego, CA) equipped with 488 nm Argon laser light source and a 623 nm band pass filter for FITC fluorescence. For determination of LMP-1 signals, cells were fixed in 1% paraformaldehyde followed by permeabilization with 0.05% Triton X 100 at room temperature. The cells were washed with 1X PBS 3 times at 5 minute intervals. In this fixing procedure the cytoplasm remains intact and the LMP1 antibody was allowed to gain access to the intracellular compartment. A total of 10,000 events were acquired for analysis using CellQuest software (Becton Dickinson, San Diego, CA). Cells were gated as described earlier (Lan et al., 2006), and histogram plots of PE fluorescence (x axis) versus counts (y axis) were shown as a fraction of logarithmic fluorescence intensity. A dot plot of PE fluorescence (x axis) versus FITC (y axis) was also determined as a fraction of logarithmic fluorescence intensity.
3. Results
3.1. Growth of T-cell prolymphocytic leukemia cells in vitro
The diagnosis was based on the FACS analysis of the bone marrow aspirate as well as the peripheral blood sample. The results of FACS on the bone marrow demonstrated an aberrant expanded population (70% of total events) of CD2, CD3, CD5, CD7, CD8, and CD25 T cells. These cells were CD1a, CD4, CD16, CD30, CD56, CD57, TdT and gamma-delta negative. In addition, B-cells were essentially absent (Table 2). The FACS performed on peripheral blood demonstrated an essentially identical immuno-profile and the markedly high CD7 intensity was not reduced in comparison to other pan-T antigens. The combined clinical, morphologic (absence of flower cells) and immuno-phenotypic (CD8 positivity, without loss of CD7 expression) features were consistent with T-PLL (Table 2).
Table 2.
Immunophenotyping Results
| Antibody | Major Cell Specificity | Reactivity(Bm) | Reactivity (PB) |
|---|---|---|---|
| CD1a | Thymocyte | − | − |
| CD2 | Pan T, NK | + | + |
| CD3 | Pan T | + | + |
| CD4 | T-helper, Monocyte | − | − |
| CD5 | T, subset of B | + | + |
| CD7 | T, NK |

|

|
| CD8 | T-cytotoxic/suppressor | ||
| CD16 | NK, neutrophils | − | − |
| CD25 | pre-B, pre-T | + | + |
| CD30 | Activated T, B | − | − |
| CD56 | NK | − | − |
| CD57 | NK, T-cytotoxic | − | − |
| TdT | B | − | − |
| γδ | B | − | − |
| Cd19 | B | − | − |
Mononuclear cells preparations from the patient were cultured. These cultures initially contained the T-PLL tumor cells as well as other normal lymphocytic cells. The normal cells gradually died within a month and only large T-PLL tumor cells remained as large clumps suggesting a transformed phenotype (Fig. 1A). Microscopic findings of the hematoxylin and eosin (HE) stained slides of needle aspirate showed many mature lymphocytes (Fig. 1B). The surface of some of the lymphoid cells showed enhanced ruffling (middle panel arrow). These were identified as atypical lymphocytes that continued to proliferated in culture over time. The right panel displays cells with distorted nuclei (right panel arrow). These cells were slightly smaller but their morphology was consistent with PLL (Fig. 1B).
Figure 1.
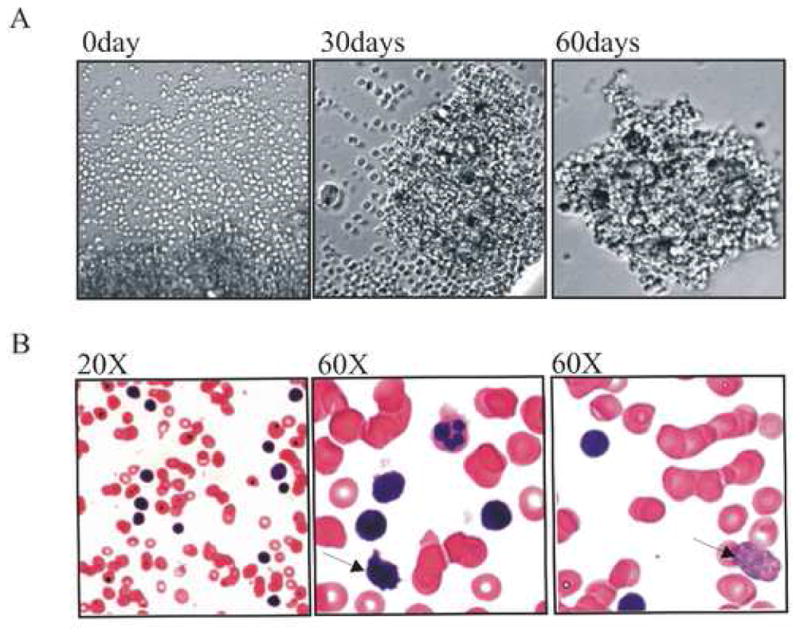
(A) The morphology of the T-PLL cells derived from the patient’s periphery blood cells. The lymphocytes were isolated from the periphery blood of the T-PLL patient and then cultured in RPMI1640 supplemented with 10% FBS. The cells were continuously cultured for approximately 13 months. The left picture shows the morphology of the cells in the culture at first day, the size of the cells is almost identical and it is hard to find big size tumor cells. The middle picture shows that the large size tumor cells are visible and the right one shows a typical image obtained for these T-PLL cells. (B) The morphology of the bone marrow sample from the patient which was stained with Haematoxylin and Eosin. There are many mature lymphocytes, and large atypical lymphocytes with small cytoplasm surrounding irregular nuclei, clumped chromatin and distinct nucleoli shown.
3.2. Confirmation of EBV sequence in the T-PLL cells
We performed PCR amplification of different regions of EBV genome to determine if there was EBV infection of the T-PLL cells derived from the patient’s peripheral blood cells which were predominantly T cells with an almost absent B cell population. Genomic DNA was prepared from the equal numbers of T-PLL cells which were continuously grown for 6 months in culture; EBV positive cell line (BC1), an EBV-negative cell line (BJAB), and the peripheral blood cells of the same patient. These were subjected to PCR analysis. Figure 2 demonstrats strong amplification of EBV target sequence in the T-PLL sample (Fig. 2). There was also a relatively lower amplification in the peripheral blood sample, suggesting that only a fraction of the circulating T cells which made up the PBMC were infected with EBV in the context of the total PBMC population. Importantly, the size of the PCR products from the above two samples was the same as the one obtained from EBV positive BC1 cells (Fig. 2). The amplification was specific and without contamination, as shown by the absence of amplification in the PCR controls, DNA from EBV-negative BJAB cells, and the controls without DNA added (Fig. 2). We also obtained amplification from the DNA sample prepared from the T-PLL cells continuously cultured for 12 months in vitro (data not shown).
Figure 2.

PCR to show the existence of EBV in T-PLL cells. Genomic DNA of T-PLL cells were prepared from the culture which was continuously passaged for 6 months and was used as template for PCR. The DNAs from EBV negative BJAB and positive BC1 cells were used as controls. EBV BamH1 W, C, E regions were amplified and the primer co-ordinates are present in Table 2.
3.3. EBV antigens were expressed in T-PLL cells
These results indicate that the EBV genomic DNA was present in the T-PLL tumor cells derived from the patient. To further confirm this and to detect are any EBV antigens in these cells, we prepared cell lysates from the cultured T-PLL tumor cells as well as EBV-negative BJAB cells, for Western blotting. First, we used the serum prepared from the patient as a primary antibody. This serum was pre-treated by incubation with BJAB cell lysate for 72 hours. Since the patient was EBV positive, there should be a broad spectrum of antibodies against different EBV antigens (Callahan et al., 1999; Robertson and Kieff, 1995). The Western blotting demonstrated that the T-PLL cell contained proteins corresponding to EBNA3C, EBNA2, EBNA1 and probably LMP1, based on the molecular sizes, respectively (Fig. 3A). Although these bands were specific were absent in the control BJAB cells, the molecular size alone was not sufficient to identify specific antigens. To confirm the specificity of a number of these EBV antigens and to determine if expression of the EBV oncoprotein LMP1 was present, the membrane was stripped completely of signal and then re-probed with specific monoclonal antibodies against EBNA3C (Fig. 3B) and LMP1 (Fig. 3C), respectively. These two proteins were chosen as targets as these antibodies have greater specificity and were available in our lab (Callahan et al., 1999; Knight et al., 2003). The results demonstrated that at least these two major latent EBV oncoproteins were clearly expressed in the T-PLL cells derived from this patient. We did not further determine expression of EBNALP and EBNA2 with specific antibodies as they were unavailable in our laboratory.
Figure 3.
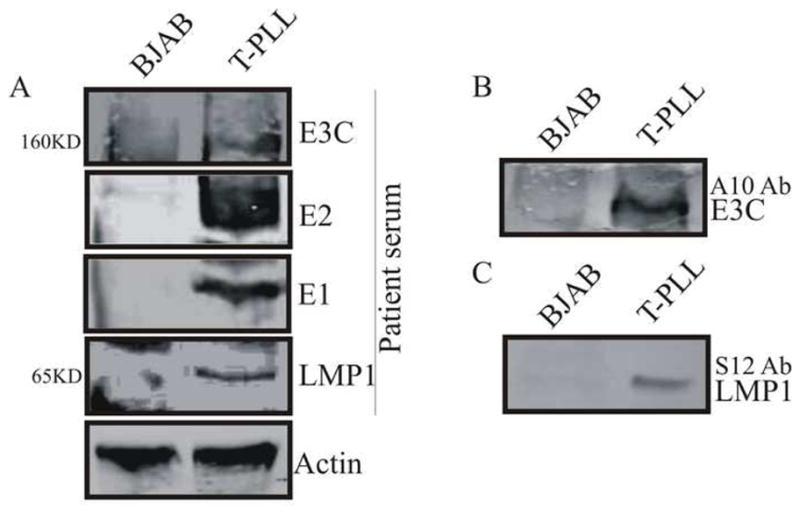
Western blotting to show the expression of EBV antigens in T-PLL cells derived from patient’s peripheral blood cells. The lysate from BJAB cells was used as a negative control. Patient serum (A), A10 mouse monoclonal antibody against EBNA3C (B) and S12 mouse monoclonal antibody against LMP1 (C) were used as primary antibodies, respectively. The membranes stripped completed and re-probed using antibody against actin to be shown as internal loading controls.
To corroborate the Western blotting data above, we further employed immunofluorescence assays to determine the expression of EBV antigens in the T-PLL cells. We harvested the T-PLL cells from the growing culture at 6 months when there were only large size tumor cells. EBV-negative BJAB cells and the EBV-positive lymphoblastoid cell line (LCL) were used as controls. There were no detectable levels of EBNA3C or LMP1 expression in BJAB cells (Fig. 4A, B, top panels). In contrast, there were approximately 90% of LCL cells contained EBNA3C or LMP1 (Fig. 4A, B, middle panels). Approximately 80% of T-PLL cells were EBNA3C positive, and 40% of T-PLL cells LMP1 positive (Fig. 4A, B, bottom panels). This suggests that the majority of the T-PLL cells were positive for EBV infection as indicated by the positive EBNA3C signals.
Figure 4.

Immunofluorescence analysis to show the expression of EBNA3C (A) and LMP1 (B) in T-PLL cells derived from patient’s periphery blood cells. EBV negative BJAB and EBV positive LCL cells were used as controls. The quantification of the positive cells is presented in the bottom.
3.4. The cultured T-PLL cells express the CD3 marker
CD3 is a pan-T antigen which is expressed on the surface of T lymphocytes (Kanellopoulos et al., 1983). Since CD3 was positive in bone marrow sample as well as the PBMC sample of the patient, we chose this maker to further confirm the origin of the T-PLL cells. We first stained the cells with CD3 antibody for flow cytometry analysis. The results showed that the cultured T-PLL cells had an increase in CD3 expression level. The intensity of CD3 positive increased about 100 times over that of the control (Fig. 5, Upper Panel). These results suggested that the T-PLL cells derived from the patient’s blood cells have a T cell origin. To further determine if these T-PLL cells were also EBV-infected, we performed FACS analysis by double staining using CD3 as well as EBV LMP1 antibody. For analysis of the LMP-1 signals, the cells were fixed in 1% paraformaldehyde at room temperature to ensure that the cells were permeabilized for intracellular staining. Our data showed that the majority of cells which were LMP1 positive were also CD3 positive (Fig. 5, bottom panel). This demonstrated that in the context of this patient, a predominant fraction of the T-PLL cells were expressing EBV LMP1.
Figure 5.
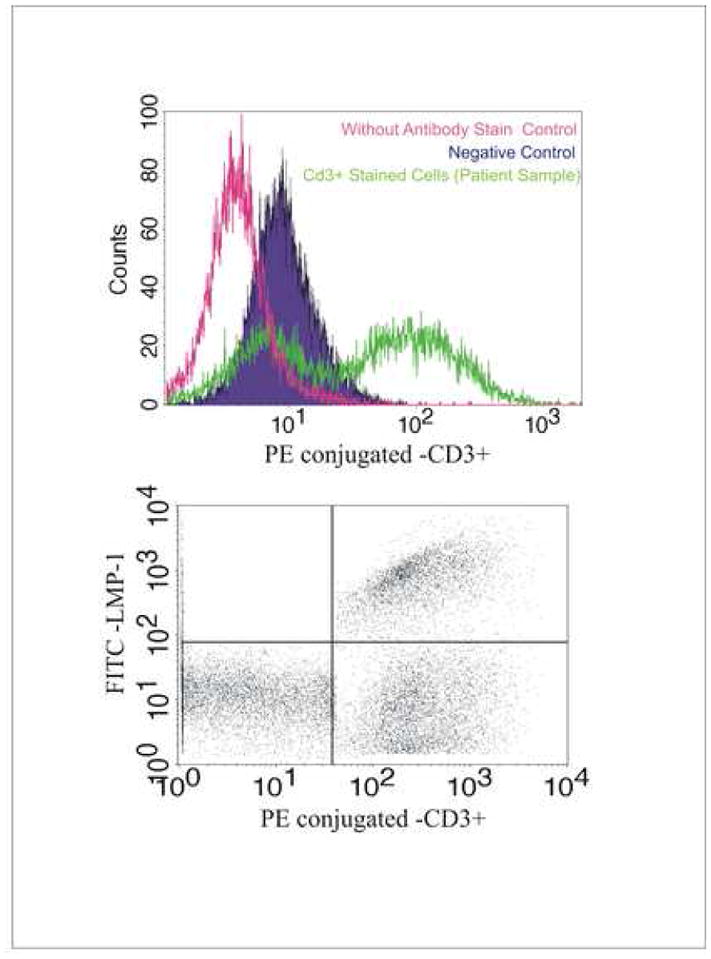
FACS analysis shows the T-PLL cells derived from the patient’s peripheral blood cells are CD3 positive (A) and dual positive for CD3 and LMP1 (B). The cells were fixed and stained with CD3 antibody or CD3 antibody plus LMP1 antibody and then were subjected to FACS analysis. As shown, the percentages of the cell populations are as following: LMP+ (2%), CD3+ (40%), LMP+/CD3+ (30%), LMP1−/CD3− (25%). BJAB was used as a negative control in this assay.
4. Discussion
T-PLL is a rare type of post-thymic T-cell neoplasm, the etiology of which is unknown. So far, it is widely accepted that certain chromosomal translocations are the common molecular feature of this tumor (Ravandi et al., 2005). However the cause of these chromosome changes remains unclear. Unlike Adult T-cell leukemia or lymphoma, the Human T-lymphotrophic viruses I and II (HTLV-I/II) are invariably negative by both serology and polymerase chain reaction (PCR) in T-PLL patients and a positive result for these viruses excludes this diagnosis (Pawson et al., 1998; Pawson et al., 1997).
Epstein–Barr virus (EBV), discovered more than 40 years ago from a Burkitt’s lymphoma biopsy, was the first virus to be directly associated with human cancer (Epstein, Achong, and Barr, 1964). EBV has two distinct life cycles in the human host; a lytic form of infection that produces new infectious virions, and a latent form of infection that allows the virus to persist in a dormant state for the lifetime of the host (Klein, Kis, and Klein, 2007). EBV has evolved a life cycle that mimics the natural differentiation pathway of antigen-activated B cells, giving the virus access to its site of latent infection, the resting memory B cells (Klein, Kis, and Klein, 2007). By steering infected cells through the various stages of lymphocyte differentiation, EBV is able to enter a cell type suitable for long-term latent persistence and periodic reactivation (Klein, Kis, and Klein, 2007). However, its presence in various stages of B-cell development, and its ability to infect other cell types such as epithelial cells and T cells could have pathogenic consequences, and may also contribute to the development of a diverse group of leukemias, lymphomas and carcinomas (Klein, Kis, and Klein, 2007).
This T-PLL patient with a high EBV titer allowed the possibility that the virus may be involved in the development of T-PLL. To further confirm this observation, a link between EBV infection and the T-PLL tumor cells must be established from multiple patients. In this report, we continuously cultured patient derived T-PLL cells in vitro for approximately a year with loss of continual growth after this period. During the culture of these T-PLL cells in vitro, we found that their doubling time was approximately 48–72 hours in the first 2 months after the enhanced population of T-PLL cells survived. However, after this initial 60 days in culture the growth rate of the cells slowed with the supplement of 10% FBS and glutamine in the medium. The growth of these cells was eventually discontinued after 13 months post culture. Improved conditions for culturing T-PLL cells will be necessary for establishment of a T-PLL cell line in the future. Additionally, it would be important to generate multiple cell lines from a number of patients for comparative analyses.
We detected EBV infection of these cells at different stages of culture. Expression of two major latent EBV antigens, EBNA3C and LMP1 was detected in these cells. Therefore, it is likely that EBV had established a Type III latency in these cells as expression of EBNA3C is likely to also be seen with expression on EBNALP and EBNA2 (Klein, Kis, and Klein, 2007). We also noticed that the percentage of EBNA3C-expressing cells and LMP1-expressing cells was also varied. This suggests that the T-PLL cells may have expanded from multiple infected T-cells during development of the leukemia and that these cells were likely to be polyclonal in nature as observed by the different EBV latent antigen expression. It would be interesting to determine if there may be a unique type of latency on these cells distinct from type II or type III based on latent antigen expression.
This report provides new evidence that EBV infection may play a role in development of T-PLL. Additional effort will be needed to further focus on the systemic characterization of EBV gene expression profiles in T-PLL cells from multiple patients, and the role of EBV in contributing to the oncogenic process of T-PLL cells.
Acknowledgments
This work was supported by grants from the Leukemia and Lymphoma Society of America and public health service grants from the NCI CA072510 and CA091792 and from NIDCR DE014136-04 and 017338 (to ESR). KL is a special fellow and ESR is a scholar of the Leukemia and Lymphoma Society of America.
Footnotes
Publisher's Disclaimer: This is a PDF file of an unedited manuscript that has been accepted for publication. As a service to our customers we are providing this early version of the manuscript. The manuscript will undergo copyediting, typesetting, and review of the resulting proof before it is published in its final citable form. Please note that during the production process errors may be discovered which could affect the content, and all legal disclaimers that apply to the journal pertain.
References
- Callahan J, Pai S, Cotter M, Robertson ES. Distinct patterns of viral antigen expression in Epstein-Barr virus and Kaposi’s sarcoma-associated herpesvirus coinfected body-cavity-based lymphoma cell lines: potential switches in latent gene expression due to coinfection. Virology. 1999;262(1):18–30. doi: 10.1006/viro.1999.9876. [DOI] [PubMed] [Google Scholar]
- Catovsky D, Galetto J, Okos A, Galton DA, Wiltshaw E, Stathopoulos G. Prolymphocytic leukaemia of B and T cell type. Lancet. 1973;2(7823):232–4. doi: 10.1016/s0140-6736(73)93135-8. [DOI] [PubMed] [Google Scholar]
- Catovsky D, Galetto J, Okos A, Miliani E, Galton DA. Cytochemical profile of B and T leukaemic lymphocytes with special reference to acute lymphoblastic leukaemia. J Clin Pathol. 1974;27(10):767–71. doi: 10.1136/jcp.27.10.767. [DOI] [PMC free article] [PubMed] [Google Scholar]
- Croce CM. Role of chromosome translocations in human neoplasia. Cell. 1987;49(2):155–6. doi: 10.1016/0092-8674(87)90552-6. [DOI] [PubMed] [Google Scholar]
- Croce CM, Isobe M, Palumbo A, Puck J, Ming J, Tweardy D, Erikson J, Davis M, Rovera G. Gene for alpha-chain of human T-cell receptor: location on chromosome 14 region involved in T-cell neoplasms. Science. 1985;227(4690):1044–7. doi: 10.1126/science.3919442. [DOI] [PubMed] [Google Scholar]
- Epstein MA, Achong BG, Barr YM. Virus Particles in Cultured Lymphoblasts from Burkitt’s Lymphoma. Lancet. 1964;15:702–3. doi: 10.1016/s0140-6736(64)91524-7. [DOI] [PubMed] [Google Scholar]
- Hallas C, Pekarsky Y, Itoyama T, Varnum J, Bichi R, Rothstein JL, Croce CM. Genomic analysis of human and mouse TCL1 loci reveals a complex of tightly clustered genes. Proc Natl Acad Sci U S A. 1999;96(25):14418–23. doi: 10.1073/pnas.96.25.14418. [DOI] [PMC free article] [PubMed] [Google Scholar]
- Hoyer JD, Ross CW, Li CY, Witzig TE, Gascoyne RD, Dewald GW, Hanson CA. True T-cell chronic lymphocytic leukemia: a morphologic and immunophenotypic study of 25 cases. Blood. 1995;86(3):1163–9. [PubMed] [Google Scholar]
- Kanellopoulos JM, Wigglesworth NM, Owen MJ, Crumpton MJ. Biosynthesis and molecular nature of the T3 antigen of human T lymphocytes. Embo J. 1983;2(10):1807–14. doi: 10.1002/j.1460-2075.1983.tb01662.x. [DOI] [PMC free article] [PubMed] [Google Scholar]
- Klein E, Kis LL, Klein G. Epstein-Barr virus infection in humans: from harmless to life endangering virus-lymphocyte interactions. Oncogene. 2007;26(9):1297–305. doi: 10.1038/sj.onc.1210240. [DOI] [PubMed] [Google Scholar]
- Knight JS, Lan K, Subramanian C, Robertson ES. Epstein-Barr virus nuclear antigen 3C recruits histone deacetylase activity and associates with the corepressors mSin3A and NCoR in human B-cell lines. J Virol. 2003;77(7):4261–72. doi: 10.1128/JVI.77.7.4261-4272.2003. [DOI] [PMC free article] [PubMed] [Google Scholar]
- Lan K, Kuppers DA, Verma SC, Robertson ES. Kaposi’s sarcoma-associated herpesvirus-encoded latency-associated nuclear antigen inhibits lytic replication by targeting Rta: a potential mechanism for virus-mediated control of latency. J Virol. 2004;78(12):6585–94. doi: 10.1128/JVI.78.12.6585-6594.2004. [DOI] [PMC free article] [PubMed] [Google Scholar]
- Lan K, Murakami M, Choudhuri T, Kuppers DA, Robertson ES. Intracellular-activated Notch1 can reactivate Kaposi’s sarcoma-associated herpesvirus from latency. Virology. 2006;351(2):393–403. doi: 10.1016/j.virol.2006.03.047. [DOI] [PubMed] [Google Scholar]
- Lee W, Hwang YH, Lee SK, Subramanian C, Robertson ES. An Epstein-Barr virus isolated from a lymphoblastoid cell line has a 16-kilobase-pair deletion which includes gp350 and the Epstein-Barr virus nuclear antigen 3A. J Virol. 2001;75(18):8556–68. doi: 10.1128/JVI.75.18.8556-8568.2001. [DOI] [PMC free article] [PubMed] [Google Scholar]
- Madani A, Choukroun V, Soulier J, Cacheux V, Claisse JF, Valensi F, Daliphard S, Cazin B, Levy V, Leblond V, Daniel MT, Sigaux F, Stern MH. Expression of p13MTCP1 is restricted to mature T-cell proliferations with t(X;14) translocations. Blood. 1996;87(5):1923–7. [PubMed] [Google Scholar]
- Narducci MG, Stoppacciaro A, Imada K, Uchiyama T, Virgilio L, Lazzeri C, Croce CM, Russo G. TCL1 is overexpressed in patients affected by adult T-cell leukemias. Cancer Res. 1997;57(24):5452–6. [PubMed] [Google Scholar]
- Narducci MG, Virgilio L, Isobe M, Stoppacciaro A, Elli R, Fiorilli M, Carbonari M, Antonelli A, Chessa L, Croce CM, Russo G. TCL1 oncogene activation in preleukemic T cells from a case of ataxia-telangiectasia. Blood. 1995;86(6):2358–64. [PubMed] [Google Scholar]
- Pattle SB, Farrell PJ. The role of Epstein-Barr virus in cancer. Expert Opin Biol Ther. 2006;6(11):1193–205. doi: 10.1517/14712598.6.11.1193. [DOI] [PubMed] [Google Scholar]
- Pawson R, Schulz T, Matutes E, Catovsky D. Absence of HTLV-I/II in T-prolymphocytic leukaemia. Br J Haematol. 1998;102(3):872–3. doi: 10.1046/j.1365-2141.1998.00887.x. [DOI] [PubMed] [Google Scholar]
- Pawson R, Schulz TF, Matutes E, Catovsky D. The human T-cell lymphotropic viruses types I/II are not involved in T prolymphocytic leukemia and large granular lymphocytic leukemia. Leukemia. 1997;11(8):1305–11. doi: 10.1038/sj.leu.2400725. [DOI] [PubMed] [Google Scholar]
- Pekarsky Y, Hallas C, Croce CM. Molecular basis of mature T-cell leukemia. Jama. 2001a;286(18):2308–14. doi: 10.1001/jama.286.18.2308. [DOI] [PubMed] [Google Scholar]
- Pekarsky Y, Hallas C, Croce CM. The role of TCL1 in human T-cell leukemia. Oncogene. 2001b;20(40):5638–43. doi: 10.1038/sj.onc.1204596. [DOI] [PubMed] [Google Scholar]
- Pekarsky Y, Hallas C, Isobe M, Russo G, Croce CM. Abnormalities at 14q32.1 in T cell malignancies involve two oncogenes. Proc Natl Acad Sci U S A. 1999;96(6):2949–51. doi: 10.1073/pnas.96.6.2949. [DOI] [PMC free article] [PubMed] [Google Scholar]
- Ravandi F, Kantarjian H, Jones D, Dearden C, Keating M, O’Brien S. Mature T-cell leukemias. Cancer. 2005;104(9):1808–18. doi: 10.1002/cncr.21405. [DOI] [PubMed] [Google Scholar]
- Robertson E, Kieff E. Reducing the complexity of the transforming Epstein-Barr virus genome to 64 kilobase pairs. J Virol. 1995;69(2):983–93. doi: 10.1128/jvi.69.2.983-993.1995. [DOI] [PMC free article] [PubMed] [Google Scholar]
- Stern MH, Soulier J, Rosenzwajg M, Nakahara K, Canki-Klain N, Aurias A, Sigaux F, Kirsch IR. MTCP-1: a novel gene on the human chromosome Xq28 translocated to the T cell receptor alpha/delta locus in mature T cell proliferations. Oncogene. 1993;8(9):2475–83. [PubMed] [Google Scholar]
- Subramanian C, Knight JS, Robertson ES. The Epstein Barr nuclear antigen EBNA3C regulates transcription, cell transformation and cell migration. Front Biosci. 2002;7:d704–16. doi: 10.2741/subraman. [DOI] [PubMed] [Google Scholar]
- Sugimoto J, Hatakeyama T, Narducci MG, Russo G, Isobe M. Identification of the TCL1/MTCP1-like 1 (TML1) gene from the region next to the TCL1 locus. Cancer Res. 1999;59(10):2313–7. [PubMed] [Google Scholar]
- Toyota S, Nakamura N, Dan K. T-cell prolymphocytic leukemia with hemorrhagic gastrointestinal involvement and a new chromosomal abnormality. Int J Hematol. 2002;75(3):314–7. doi: 10.1007/BF02982049. [DOI] [PubMed] [Google Scholar]
- Toyota S, Nakamura N, Dan K. Small cell variant of T-cell prolymphocytic leukemia with a gammadelta immunophenotype. Int J Hematol. 2005;81(1):66–8. doi: 10.1532/ijh97.04129. [DOI] [PubMed] [Google Scholar]
- Virgilio L, Narducci MG, Isobe M, Billips LG, Cooper MD, Croce CM, Russo G. Identification of the TCL1 gene involved in T-cell malignancies. Proc Natl Acad Sci U S A. 1994;91(26):12530–4. doi: 10.1073/pnas.91.26.12530. [DOI] [PMC free article] [PubMed] [Google Scholar]
- Young LS, Murray PG. Epstein-Barr virus and oncogenesis: from latent genes to tumours. Oncogene. 2003;22(33):5108–21. doi: 10.1038/sj.onc.1206556. [DOI] [PubMed] [Google Scholar]
- Young LS, Rickinson AB. Epstein-Barr virus: 40 years on. Nat Rev Cancer. 2004;4(10):757–68. doi: 10.1038/nrc1452. [DOI] [PubMed] [Google Scholar]
- Yuille MR, Condie A, Stone EM, Wilsher J, Bradshaw PS, Brooks L, Catovsky D. TCL1 is activated by chromosomal rearrangement or by hypomethylation. Genes Chromosomes Cancer. 2001;30(4):336–41. doi: 10.1002/gcc.1099. [DOI] [PubMed] [Google Scholar]