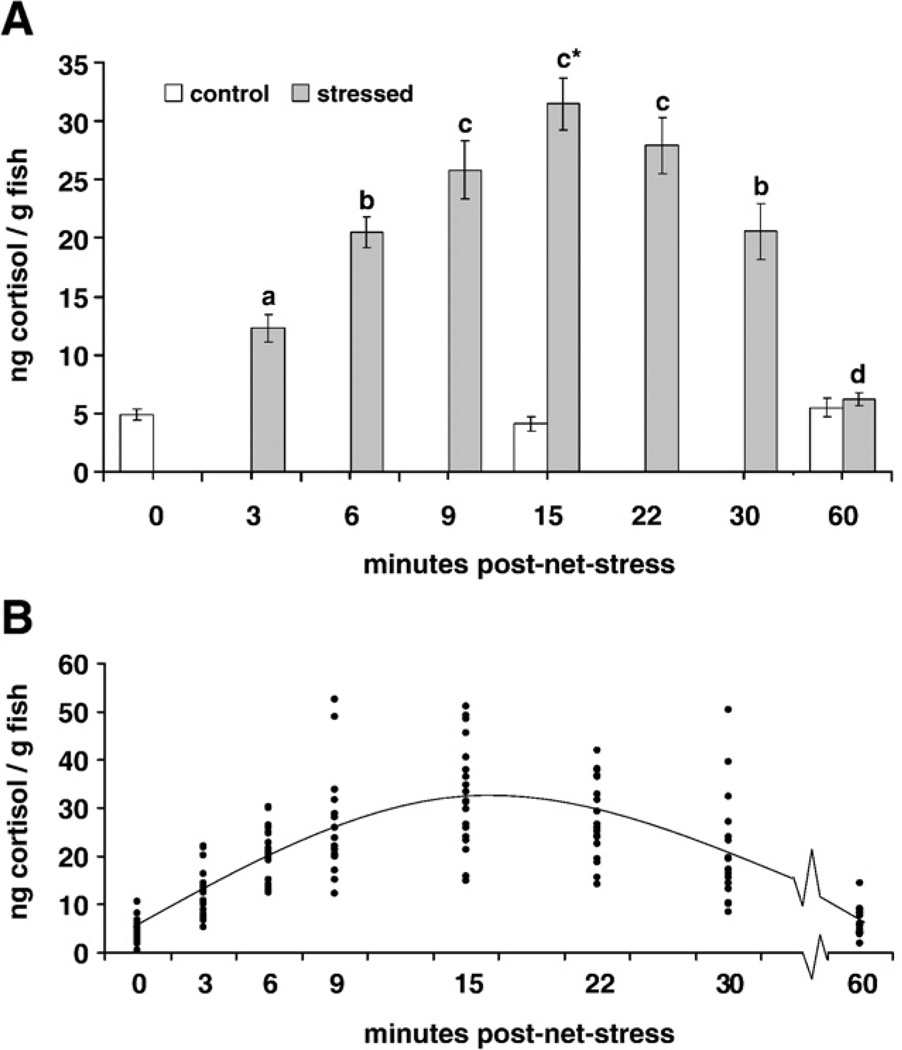
Fig. 3.
Whole-body cortisol values (ng/g fish weight; ± SEM; n = 20) over time (60 min) after acute net-stress (1 h Study). Net-stress groups (gray bars) were held suspended in a net for 3 min, allowed to recover for 3 min and suspended in a net for 3 min (9 min total net stress). Control groups (white bars) received no net stress prior to sampling. A) Mean cortisol over time among control and net stressed groups. T-tests were used to compare the cortisol of control and net-stressed groups at 15 min and 60 min post-net stress; a significant difference between control and net-stressed groups is indicated by an asterisk over the net-stressed group. The control group was compared over time post-net stress using an analysis of variance (ANOVA); there were no significant differences between control groups over time. The net-stressed group was compared over time post-net stress using an ANOVA. Significant differences between net-stressed cortisol are indicated by different letters (a,b,c,d). Significance was reported at p < 0.05. B) Individual cortisol (●) among net-stressed fish over time. Fish at time 0 min received no net stress prior to sampling (control). There was a positive linear relationship between cortisol and time from 0 to 15 min PNS (cortisol = 7.26 + 1.76 × time; R2 = 0.622; P = 5.5×10⁻²²) and a negative linear relationship between cortisol and time from 15 to 60 min PNS (cortisol = 39.5−0.56×time; R2 = 0.516; p = 1.33×10⁻¹³).

