Abstract
Objective
To investigate the relationship between EEG source localization and the number of scalp EEG recording channels.
Methods
128 EEG channel recordings of 5 pediatric patients with medically intractable partial epilepsy were used to perform source localization of interictal spikes. The results were compared with surgical resection and intracranial recordings. Various electrode configurations were tested and a series of computer simulations based on a realistic head boundary element model were also performed in order to further validate the clinical findings.
Results
The improvement seen in source localization substantially decreases as the number of electrodes increases. This finding was evaluated using the surgical resection, intracranial recordings and computer simulation. It was also shown in the simulation that increasing the electrode numbers could remedy the localization error of deep sources. A plateauing effect was seen in deep and superficial sources with further increasing the electrode number.
Conclusion
The source localization is improved when electrode numbers increase, but the absolute improvement in accuracy decreases with increasing electrode number.
Significance
Increasing the electrode number helps decrease localization error and thus can more ably assist the physician to better plan for surgical procedures.
Keywords: EEG Source Localization, Pediatric Patients, Partial Epilepsy, Electrode Number, Interictal Spikes, High resolution EEG
Introduction
Using EEG source imaging to plan for resection has shown promise to aid presurgical planning in medically intractable partial epilepsy patients. Many research groups in the past decades have conducted experiments to show the efficacy of using EEG source analysis techniques in the pre-surgical planning for patients diagnosed with focal epilepsy (Ding et al., 2007; Ebersole, 2000; He et al., 1987, 2013; Leijten and Huiskamp, 2008; Lu et al., 2012b, 2014; Michel et al., 1999; Plummer et al., 2008; Sperli et al., 2006; Wang et al., 2011; Yang et al., 2011). Using the interictal spikes found in the EEG of these patients, such techniques can provide a noninvasive way to assist the physician in localizing the epileptogenic foci. In addition to being noninvasive, EEG recording is a low-cost and fairly available recording module from which a large number of patients can potentially benefit. The availability of powerful personal computers in most clinical environments is another factor that gives the clinician the opportunity to benefit from EEG inverse algorithms. It has been demonstrated in a number of previous studies that such inverse algorithms are capable of localizing the epileptogenic foci with acceptable precision (Fukushima et al., 2012; Ding et al., 2006, 2007; Krings et al., 1998; Lai et al., 2011; Lu et al., 2012a; Michel et al. 2004a; Oikonomou et al., 2012; Wang et al., 2012; Wu et al., 2012; Zhang et al., 2003).
Using a realistic head model for each patient based on their MRI images is another modification that has helped improve the localization of epileptic foci. Using a boundary element method (BEM) model to more accurately model the electric field propagation through brain tissue is one successful step in better modeling the forward solution and has been shown to decrease localization error (Ding et al., 2005; Hämäläinen and Sarvas, 1989; He et al., 1987; Herrendorf et al., 2000; Roth et al., 1997; Wang et al., 2011).
One major concern for EEG recordings was its low number of scalp recordings, which to some degree is lessened by the introduction of high density EEG caps, i.e. nets or caps with 128 electrodes or more (Baillet et al., 2001; He et al., 2011; He & Ding, 2013; Spitzer et al., 1989). Determining the minimum number of electrodes in order to prevent poor performance is an important issue since using too few electrodes translates to undersampling the scalp potential. There have been a number of studies in the past two decades that have tackled this question (Lantz et al., 2003a; Srinivasan et al., 1998; Tucker, 1993). Traditionally, a 3cm interelectrode spacing has been suggested (Spitzer et al., 1989; Tucker, 1993), which is generally achieved when about 100 electrodes are used (Gevins, 1993; Michel et al., 2004b; Plummer et al., 2008; Srinivasan et al., 1998). This was experimentally shown to be suitable for a number of applications (Srinivasan et al., 1998; Tucker, 1993).
Although the effect of electrode number on localizing the epileptogenic source has been previously reported in some studies, there is still a need to investigate this matter further in a comprehensive study (Plummer et al., 2008). There have been studies to show the precision of using 128 electrodes when determining the epileptogenic foci (Lantz et al., 2003b; Michel et al., 2004a; Sperli et al., 2006); in addition, recent work has demonstrated the significance of using high density EEG caps versus low density caps in localization error (Wang et al., 2011; Lantz et al, 2003a; Lu et al. 2012a). However, presently there does not exist, to our knowledge, a comprehensive study to clearly delineate the relationship between localization error of interictal spikes and the number of EEG electrodes.
It is also worthy of attention that several work has been reported in the literature based on the recordings from healthy and mostly adult subjects (Junghöfer et al., 2000; McMenamin et al., 2010; Picton et al., 1995; Picton et al., 2000). Nonetheless, as the underlying source and geometry of the head can be very different in pediatric epileptic patients than healthy normal adults, it is reasonable to think that the necessary conditions for an acceptable data recording would be different.
In the present study, the localization error is inspected when the number of electrodes is varied from 32 electrodes to 128 electrodes. Furthermore, the localization error (which is usually calculated based on resection volume) is also calculated by comparing the maxima of the reconstructed solution with electrocorticogram (ECoG) electrodes that were marked as seizure onset zone (SOZ) electrodes by the epileptologists. ECoG recording is considered the gold standard for identifying SOZ foci (Engel, 1987); thus, including ECoG data to verify source localization results is another important feature of this study.
Methods
Patients and data acquisition
Five pediatric patients with medically intractable partial epilepsy were studied using a protocol approved by the Institutional Review Boards of the University of Minnesota and University of Alabama at Birmingham. The patients were all under 16 years of age. The patients were selected based on the following criteria: (1) interictal spikes were recorded in their high density pre-operative EEG recordings, (2) patients underwent surgical resection after presurgical workup, (3) patients were seizure free after operation, and (4) high resolution MRI images were taken preceding and following the operation. The surgical resection was used to evaluate the source localization accuracy and was not used to obtain the inverse solution. The lesion sizes, obtained from post-operative MRI images, are 9.5cm3, 45.8cm3, 2.1cm3, 15.1cm3 and 18.9cm3 in patients 1 to 5, respectively. The clinical information of these patients is summarized in Table 1.
Table 1.
Clinical information of all patients
| Patient | Gender | Age | MRI Lesion | Pathology | Surgery | Outcome | Duration of follow-up (years) |
|---|---|---|---|---|---|---|---|
| 1 | Female | 2 | Right frontal temporal lobe lesion; Ganglioglioma; Low-grade glioma; Focal cortical dysplasia. | Focal Cortical Dysplasia (FCD) IA | Right frontal cortical resection | ILAE-2 | 5 |
| 2 | Male | 11 | Encephalomalacia; left parieto-occipital regions; Arachnoid cyst left temporal region; CSF collection in dural spaces over left fronto-parietal regions | No Report | Left temporal/occipital lobectomy | ILAE-1 | 3 |
| 3 | Male | 11 | Increased signal in the right mesial temporal | FCD IIA, Mesial Temporal Sclerosis | Right temporal lobectomy | ILAE-1 | 5 |
| 4 | Male | 16 | Normal | No Report | Left temporal lobectomy | ILAE-2 | 3 |
| 5 | Female | 4 | abnormal lesion, suspicious for focal cortical dysplasia at the left frontal polar area | No Report | Left frontal cortical resection | ILAE-1 | 4 |
ILAE: International League Against Epilepsy; ILAE-1, completely seizure free outcome; ILAE-2, only auras no other seizures.
The location of the epileptogenic foci was specified for each patient by neurologists using high resolution MRI, long term video-EEG recordings prior to surgery, ictal intracranial EEG and SPECT when available. The patients underwent surgery and had the epileptogenic foci resected. All patients were seizure free during a one year follow up with the exception of one patient (patient 5) who underwent a second surgery and was seizure free during a two year follow up.
During the long term monitoring prior to surgery, 128 channel scalp EEG recordings with 250 Hz or 500 Hz sampling rate were collected. A band pass filter of 1 to 30 Hz was used to filter the linear trend and high frequency noise (Lu et al., 2012a). The MR images (voxel size: 0.86*0.86*3 mm3 or 0.86*0.86*1.5 mm3) were obtained from a 1.5T GE MRI scanner (General Electric Medical Systems, Milwaukee, WI). Electrode location for each patient was not available (as a digitized file); thus, in order to find the electrode location for each patient, a generic electrode location file that was provided by the EEG system vendor (Electrical Geodesics Inc., Eugene, OR) was used. The sensors were projected to each patient’s head using the patients’ MRI images. In order to better fit the electrodes, landmarks such as ear location, nasion and inion have been taken into consideration when projecting the electrodes onto the patient’s head. This will decrease the mismatch between the true electrode location and the ones used in analysis. In order to study different electrode configurations, i.e. electrode numbers, the electrodes were selected in a manner to uniformly cover the whole head, in an attempt to be as close as possible to the original/modified 10–20 system.
Data Analysis
The pre-operative scalp EEG recordings were reviewed and the interictal events were identified. In order to minimize the possibility of including rare events, i.e. non-epileptic events, all scalp potential maps were reviewed and the spikes pertaining to the dominant spatial map were selected for analysis. Priority was given to spikes with higher signal to noise ratio (SNR) that showed stable potential maps near the peak.
There has been a controversy in the field as to what instance of a spike should be used for analysis (Huppertz et al., 2001; Lantz et al., 2003b; Mirkovic et al., 2003; Plummer et al., 2008; Wang et al., 2011). As each spike was analyzed individually, it is preferable to use the EEG potential map at the spike peak time in the analysis to benefit from its higher SNR value. It has been shown that using the peak time might give better results than using the half-rise time in certain circumstances (Wang et al., 2011). Wang et al. (2011) argued that propagation of activity might still be close to the resected area, and thus better localization can be expected due to higher SNR of EEG signal at spike peak.
Four different EEG montages (128, 96, 64 and 32 electrodes) were tested in this study. The electrodes were uniformly spread over the scalp surface and conformed to the original/modified 10–20 system as much as possible.
For each patient, at least 15 spikes were selected based on the aforementioned criteria. At each spike event, the time for which the mean global field power (MGFP) peaked, was selected. In order to calculate the distributed dipole inverse solution, the standardized low-resolution brain electromagnetic tomography (sLORETA) method was used (Pascual-Marqui RD, 2002). A three dimensional grid of 5mm was used to form the solution space. A realistic boundary element method (BEM) model obtained from each patient’s MRI was used for modeling the head which composed of a three layer model representing the scalp, skull and brain with electrical conductivities of 0.33 S/m, 0.0042 S/m and 0.33 S/m, respectively (Hämäläinen and Sarvas, 1989). In order to calculate the localization error, the distance between the closest point on the resection boundary and the maxima of the reconstructed solution was calculated for each spike. The resection area was extracted from the post-operative MRI images of patients. CURRY 7 (Compumedics, Charlotte, NC) was used for these analyses.
All patients underwent invasive ECoG recording before surgery. The physician placed the ECoG grid on the suspected epileptogenic areas on the cortical surface and identified the SOZ electrodes. In four of the selected patients (with the exception of patient 2) the ECoG grid position was extracted using the computed tomography (CT) images and then the electrodes marked as SOZ electrodes were selected based on physician’s report. The stereotaxic referencing of different modalities such as CT and MRI were performed based on anatomical landmarks such as pre-auricular left (PAL), pre-auricular right (PAR), nasion and inion, in CURRY 7 (Compumedics, Charlotte, NC). The maximum of the inverse solution was then projected to the cortical surface and the distance between this point and the set of SOZ electrodes was calculated for each spike in every electrode montage. The interelectrode distance of ECoG electrodes is 10 mm. Fig. 1 summarizes the whole procedure for the data analysis.
Fig. 1.
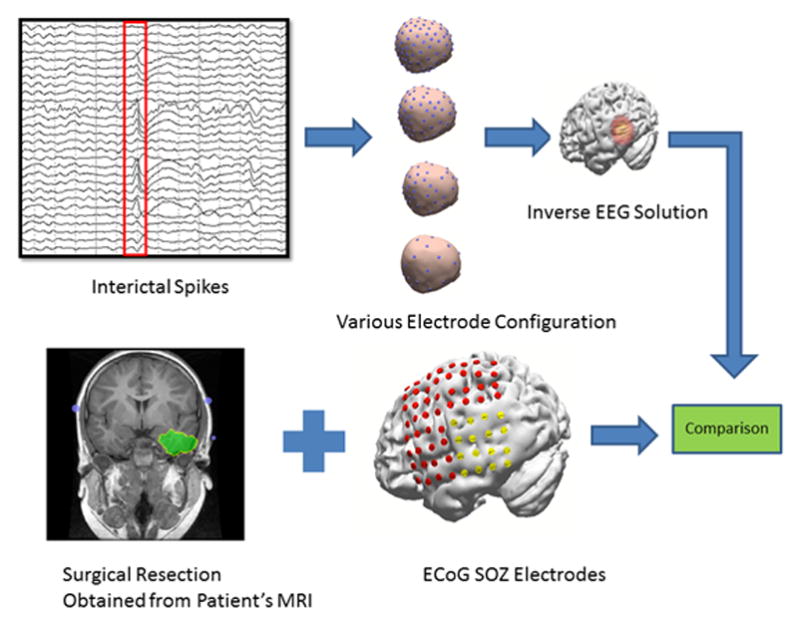
Schematic diagram of current study’s data analysis
Computer Simulation
In addition to the patient data, a series of simulations were performed to investigate the relationship between localization error and electrode number. It is necessary to determine if results similar to clinical data analysis can be obtained using computer simulation. By using the MRI images of one patient, a realistic BEM head model was formed, in order to have a more realistic simulation. 100 dipoles at random locations and with random orientations were selected within the brain volume and their corresponding scalp potential was calculated using the lead field matrix obtained from the BEM model. White Gaussian noise with different power was added to the scalp potential and the inverse solution was obtained using the sLORETA method for each dipole and every electrode montage. The distance between the reconstructed source maximum and dipole location was calculated as the localization error.
The sLORETA method is based on minimum norm solutions. After calculating the minimum norm solution, the variations due to noise and the variations due to sources, i.e. volume conduction and the inverse algorithm applied, are accounted for. This makes sLORETA solution an “F” statistics, which measures the likelihood of source activity in each location rather than estimated current density (Pascual-Marqui RD, 2002).
Results
As the error analysis was performed for each spike individually, it was necessary to average the localization errors of a particular electrode montage for each patient before reporting the results in this study. Fig. 2 shows the maximum of the inverse solution for all spikes of patient 3. Each dot corresponds to an individual spike maximum. As it can be seen (specifically by comparing panel A and D which respectively corresponds to 128 and 32 electrodes) the inverse solution is much more confined to the resection area (depicted by the yellow line) when the number of electrodes increases. This is in accordance with one’s intuition that increasing the number of electrodes should improve the source localization. The same effect is observed when the location of the maxima is compared with SOZ. Supplementary Figure S1 shows this relation. Moving from panel A to panel D which respectively corresponds to 128 and 32 electrodes, it can be clearly seen that the location of the solution maxima (depicted by blue dots) disperses and gets away from the SOZ (depicted by red dots).
Fig. 2.
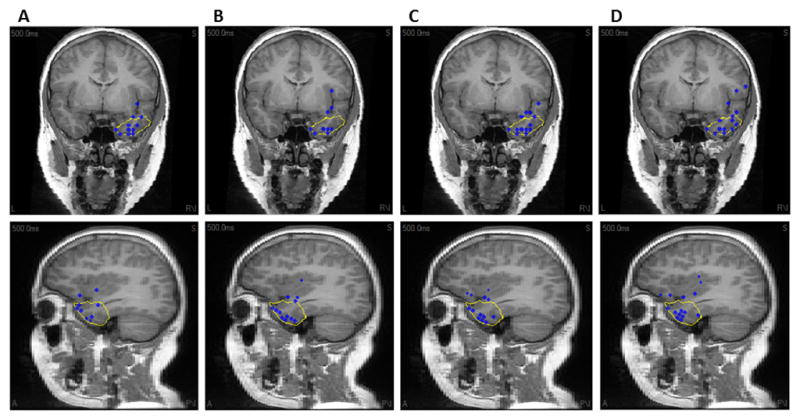
The source location of all interictal spikes in Patient 3 obtained using respectively (A) 128, (B) 96, (C) 64 and (D) 32 electrodes. The blue dot represents the location of maximum of sLORETA inverse solution. The yellow line shows the resection boundaries. Note that the spike maxima are projected to the plane of view.
Clinical Data
In Fig. 3, the localization error of all patients is shown. In Fig. 3A, the individual localization error for different electrode montages is shown. It can be seen that in general, increasing the number of electrodes will result in a smaller localization error; however, when observing the group average in Fig. 3B, not only an error decrease was found, but also a decrease in the improvement rate. In other words, the most dramatic decrease in localization error can be seen when going from 32 electrodes to 64 electrodes. The average localization error improves by 4mm when going from 32 electrodes to 64 electrodes, and improves by 1.3 mm when going from 64 electrodes to 96 electrodes, and 1.0 mm when going from 96 electrodes to 128 electrodes. It should be noted that a paired t-test was performed to confirm the significance of the results obtained in group averages. Although a significant difference (p < 0.002, degree of freedom (DF) = 89, t > 2.93) was found between any pair of the electrode configurations (128, 96, 64 and 32 electrodes), the improvement in localization is lesser for larger number of electrodes. It is also interesting to observe the effect that the epileptogenic foci size might have on this trend. The lesion size in patients 1 to 5 can be crudely categorized as small and large based on the lesion sizes provided in the Methods section. Patient 2 obviously has a large lesion in comparison to other patients. Comparing the source localization improvement, it can be seen that the improvement is not as steep in patient 2 as it is for other patients. This is in line with intuition, as signals arising from larger lesions are more prone to be picked up even with fewer numbers of electrodes. The same effect is also observed in simulation studies, as will be explained later.
Fig. 3.
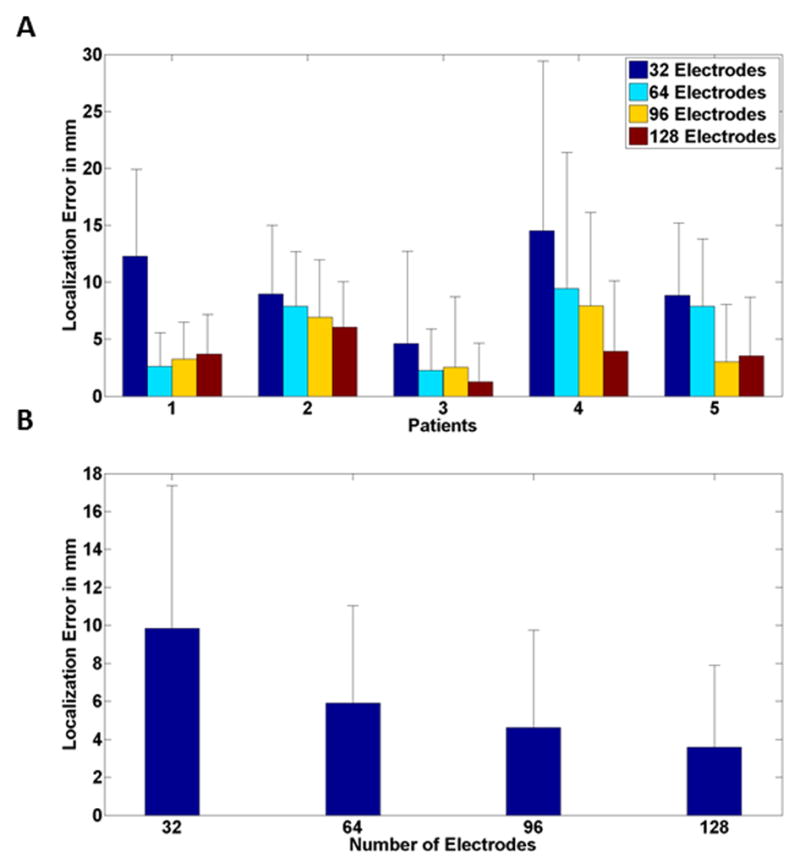
Mean source localization error (comparing with resected area) for (A) individual patients and (B) all patients stacked together for different electrode numbers. Black bar represents standard deviation.
Figure 4 shows the localization error with respect to the SOZ defined from ECoG recordings. The general trend of lower error when electrode numbers are increased can be seen in individual (Fig. 4A) and group (Fig. 4B) level results. A significant difference (p < 0.05, degree of freedom (DF) = 58, t > 1.67) was found between any pair of the electrode configurations (128, 96, 64 and 32 electrodes) except for 96 and 128 electrodes, which were not significantly different.
Fig. 4.
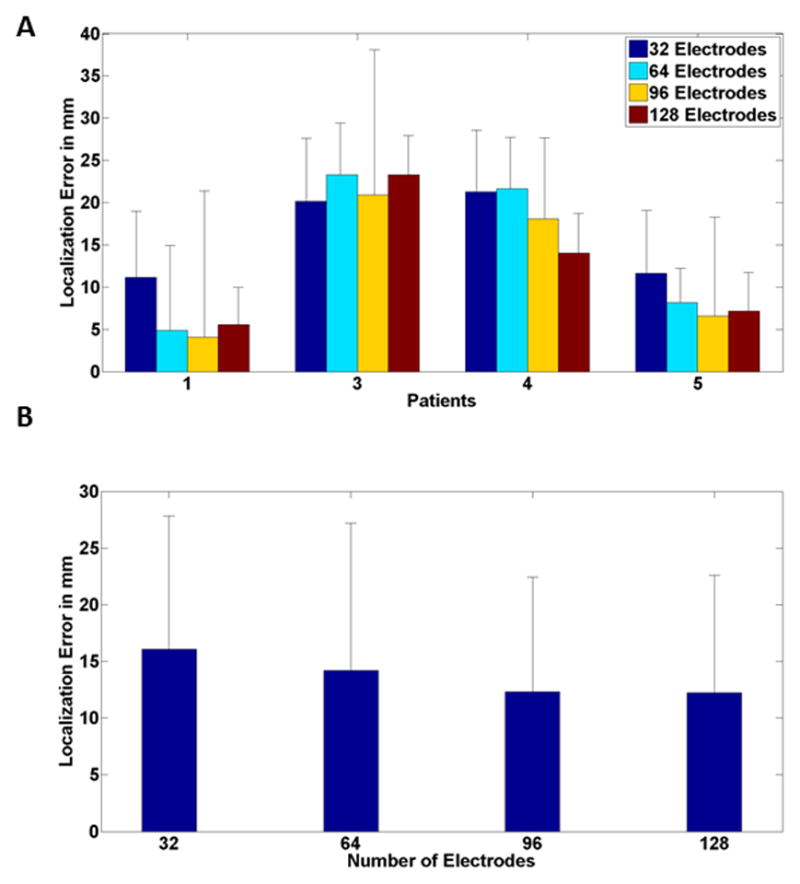
Mean source localization error (comparing with ECoG defined SOZ) for (A) individual patients and (B) all patients for different electrode numbers. Black bar corresponds to standard deviation. Note that Patient 2 had no ECoG data.
Computer Simulation
In order to further evaluate our clinical findings, a series of computer simulations were performed. Figure 5 shows the dipole localization error of different electrode configurations (128, 96, 64 and 32 electrodes) with various SNR values (10, 7, 3 and 0 dB1). It is interesting to note that the same relationship observed in clinical findings was also found in computer simulation. The localization improvement rate decreases as the electrode numbers increased; a trend that was observed, regardless of noise level (It is good to note that the sLORETA fitting was acceptable. The residual error defined as the norm of the residual vector normalized by the norm of the measured potential vector, was on average equal to 0.12±0.007).
Fig. 5.
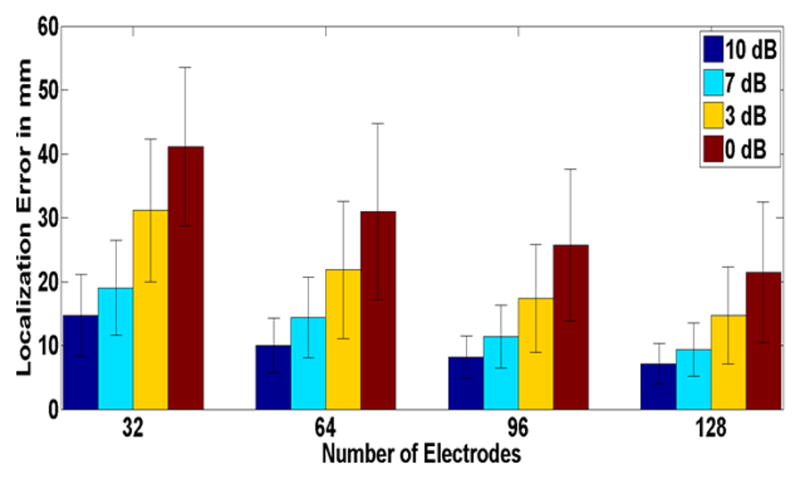
Source localization error for different electrode numbers and various SNRs in a realistic BEM model (Simulation Study). Mean values corresponding to source localization error of 100 simulated points of random location and orientation are depicted. The black bars represent the standard deviation. Each color represents different SNR values.
One major concern in weighted minimum norm (WMN) like solutions is the effect of source depth on inverse solution accuracy. It is generally known that deep sources are localized with higher error (Dale and Sereno, 1993; De Peralta-Menendez and Gonzalez-Adino, 1998; Hämäläinen and Ilmoniemi, 1984). Figure 6 shows the relation between source depth and localization error for two electrode configurations, i.e. 128 and 32 electrodes. It can be seen that localization error increases almost linearly with source depth. It is noteworthy that the depth-error relation appears to be more prominent and with higher variation when a lesser number of electrodes was used (Fig. 6).
Fig. 6.
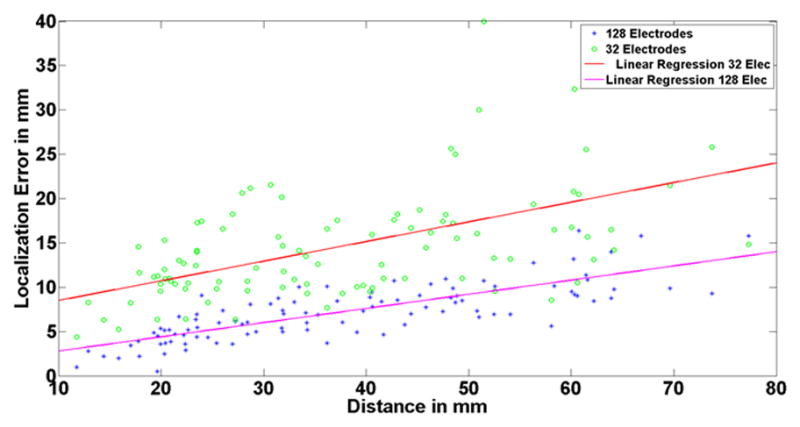
Relation of depth and source localization error. The horizontal axis shows the distance of each simulated dipole to the scalp. The green circles represent the source localization error when 32 electrodes are used to perform the inverse for each simulated dipole, and the blue asterisks represent the 128 electrode case. The regression line is provided in each case. Note that the localization error is higher for deeper sources than the superficial ones. Also note that the depth-error dependency is more prominent when using less number of electrodes for reconstruction.
In order to further investigate the relation between localization error and electrode number, the dipole sources were divided, based on their depth (distance to surface electrodes), into superficial and deep sources. The localization error for each group was calculated, and is represented in Fig. 7. Comparing the superficial (Fig. 7A) and deep (Fig. 7B) sources, it can be seen that the same relation seen in clinical data is also observed regardless of source depth (noting that deep electrodes have larger localization errors).
Fig. 7.
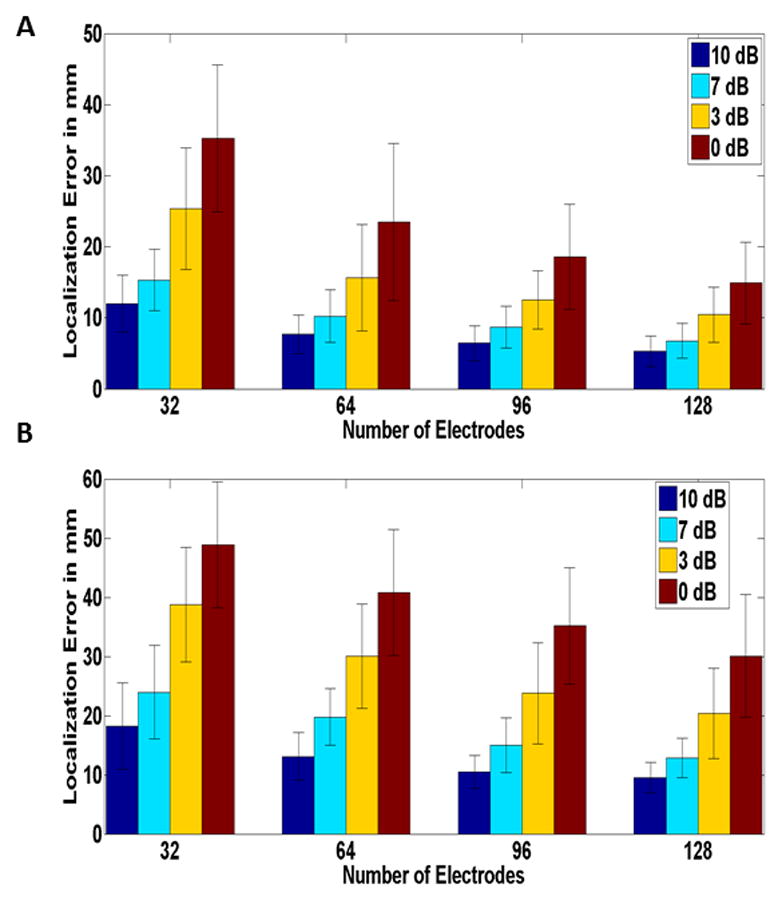
Source localization Error for different electrode numbers and various SNRs for (A) superficial and (B) deep dipoles in a realistic BEM model (Simulation Study). Mean values corresponding to source localization error of 100 simulated points of random location and orientation, depicted. The black bars represent the standard deviation. Each color represents different SNR values. Note that the same relation as in (Fig. 5) can be seen regardless of source depth.
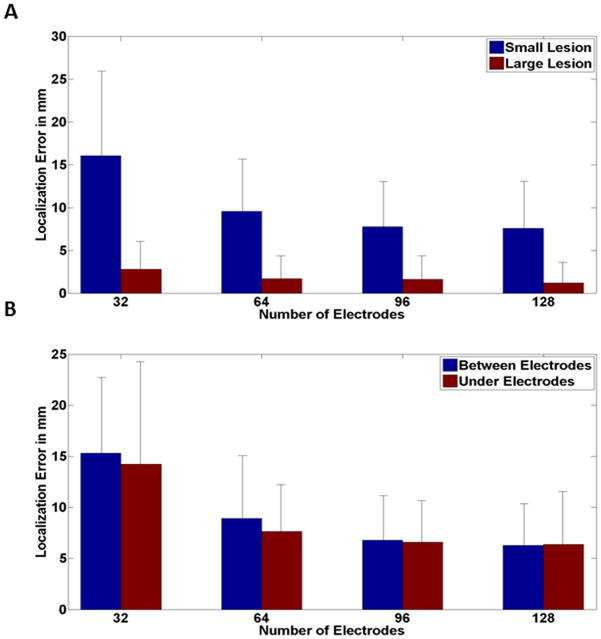
To study the effect of lesion size the same procedure as before was repeated for sources with extent. That is, instead of simulating a dipole, spherical sources with two different sizes were simulated at each random location. The inverse problem was solved using the sLORETA method and the maximum of the inverse solution was compared to the center of the simulated sphere to calculate the localization error. As it can be seen in Fig. 8A, the same plateauing effect as before is observed. It is good to note that the improvement is not as steep in the large lesion compared to the small lesion. This is intuitive as explained before in the clinical data section. Signals arising from larger lesions are more prone to be picked up even with fewer numbers of electrodes. To see if the relative location of the lesion and the electrode position can play a significant role or not, the simulated sources were categorized as under and between electrodes, based on the distance between the center of the source and the nearest electrode when the center was projected to the scalp. As it can be seen in Fig. 8B, the same phenomenon is observed. This is comprehendible as the signal coming from the lesion is not only picked up by the nearest electrode, but also by other electrodes on the scalp. After all, it is the scalp map that distinguishes different source configurations, and as all the electrodes play a role in sampling the scalp potential, the relative position of one electrode and source center should not play a significant role in localizing the source.
Fig. 8.
Source localization errors and their relation with electrode numbers for extended sources in computer simulation. (A) Two different source sizes were simulated at each random location and the same relation between electrode number and localization error is seen regardless of lesion size. (B) The two sources with different size were classified into two groups based on their relative location with the 32 electrode configuration. The same plateauing effect is observed regardless of the lesion being under or between the electrodes.
Discussion
In this study we have examined the relationship between the localization error and the number of scalp electrodes in pediatric epilepsy patients. It was confirmed that the source localization benefitted from an increased number of scalp electrodes. Moreover, the rate of improvement decreased as electrode number increased. This is particularly interesting, considering the question of required number of electrodes for accurate localization. The data presented in the present study suggests a plateauing pattern for localization error as electrode number increases. It is interesting to note that the group average interelectrode distance pertaining to 128 electrode configuration is about 2 cm (in this study), which is the value traditionally reported as the minimum interelectrode spacing for some applications (Spitzer et al., 1989; Srinivasan et al., 1998; Tucker, 1993); However, a wide range of interelectrode spacing can be inferred based on previous studies (Freeman et al., 2003; Nunez and Srinivasan, 2006; Spitzer et al., 1989; Srinivasan et al., 1998; Tao et al., 2005; Tucker, 1993). This range varies from 1 to 3cm. To further complicate the matter, the intrinsic low pass filtering effect of the skull (Srinivasan et al., 1996; Srinivasan et al., 1998) needs to be taken into consideration as well. This indicates that such studies need to continue with a larger number of electrodes to fully investigate the matter. Whether it can be concluded that a particular number of electrode configuration is enough, is a question that can only be answered when an abundance of experiments with 256 electrode (or more) configuration are conducted.
A realistic BEM head model has been used in our study. As shown by previous studies, using realistic BEM model versus a simple three concentric spheres model provides more accurate solutions (Ding et al., 2005; He et al., 1987, 2002; Herrendorf et al., 2000; Roth et al., 1997; Wang et al., 2011). An additional improvement that can be incorporated into future studies is the inclusion of actual electrode position on the patient scalp. Due to the lack of such data in the present study, the electrodes were placed on the head using the MRI images of the patient, trying to disperse the electrodes as uniformly as possible and as close as possible to the original/modified 10–20 system, using anatomical landmarks such as nasion, PAL, PAR and inion; Nonetheless the mismatch may still cause some error in the source localization. If accurate electrode positions were provided by a digitizer, the source localization would potentially improve further (De Munck et al., 1991; Khosla et al., 1999; Towle et al., 1993; Wang and Gotman, 2001). It seems that there are two possible methods to find sensor locations. The first category is the manual method; where each sensor location has to be measured individually. In the other category, only a subset of sensor locations are measured and the rest are interpolated (Russell et al., 2005). Choosing either of the methods depending on time and required accuracy improves source localization.
The main focus of this work was not to investigate the performance of the inverse method in estimating the extent of the epileptogenic lesion or to come up with an inverse algorithm that could potentially give estimates of the source extent. Nonetheless, being able to give reasonable estimates of the lesion size is potentially important and interesting in clinical settings. In order to partially address this within the scope of this paper, some area under curve (AUC) analysis (where the curve is the receiver operating characteristic, ROC, curve) was performed. If the resected area is set as the active or desired area and the rest of the brain is set as the inactive area, by thresholding the inverse solution with various different thresholds, a sensitivity (ratio of points in the resected area with their corresponding value in the inverse solution being above the threshold, to all the points in the resected area) and specificity (ratio of points within the inactive region with their corresponding value in the inverse solution being below the threshold, to all the points in the inactive region) can be attributed to each threshold. Plotting these sensitivity-specificity pairs together in a plot will give a curve known as the receiver operating characteristic (ROC) curve. Calculating the area under this curve gives a value which is called the AUC. The closer this AUC is to 1, the better our estimation of the resected area will be (Grova et al., 2006). It was observed that the AUC value for the different electrode configurations did not vary much and had the mean value of 0.86±0.12. As it can be seen changing the number of electrodes did not affect the estimate of the source extent much. This may be interpreted as a limitation of inverse algorithms. They are not as sensitive to lesion size as to location. Many efforts have been put in place to make the inverse algorithms more accurate and less blurred, but there is still a long way ahead. It seems that working on better inverse algorithms being more sensitive to lesion size is a necessary direction for future work.
Epilepsy is one of the most common neurological diseases among children, and has strong undesirable effects on the patients throughout their life (Shinnar and Pellock, 2002). There are adverse impacts on the social, economic and educational aspects of pediatric patients with recurring seizures; thus seizure control and treatment are very important for pediatric patients (Lu et al., 2012b; Shinnar and Pellock, 2002). About 30% of pediatric epilepsy cases are not remitted. Some of these patients undergo resection to control seizures (Engel, 2008; Palmini et al., 1991; Siegel et al. 2004); thus, trying to improve noninvasive methods that assist the physician is crucial. EEG source localization is a good candidate which needs further improvement and studying.
In conclusion, it was shown that using EEG source localization to determine the epileptogenic foci in epileptic patients gives reasonably accurate results. The effect of electrode number on localization error was investigated using the surgical resection and ECoG defined SOZ. It was shown how source localization improvement rate was slowed down when electrode number increased. Simulation results also confirmed the trend and further showed that the trend is valid regardless of source location (deep or superficial sources). Finally, looking into the variability of minimum interelectrode spacing reported in the literature, it was concluded that more such studies are necessary. Our study shows that using a high density EEG configuration in pediatric epileptic patients (during the presurgical workup) can help the physician to plan for surgery more precisely and reliably.
Supplementary Material
The source location of all interictal spikes in Patient 1 obtained using respectively (A) 128, (B) 96, (C) 64 and (D) 32 electrodes. The blue dot represents the location of maximum of sLORETA inverse solution. The red dot represents the ECoG electrodes marked as seizure onset zone electrodes.
Highlights.
The relationship between source localization and electrode number was investigated in pediatric patients with partial epilepsy.
Source imaging results were compared with surgical resection and seizure onset zone from intracranial electrodes.
The source localization is improved when electrode numbers increase, but the absolute improvement is less significant for larger electrode numbers.
Acknowledgments
The authors would like to thank Kaitlin Cassady for assistance in editing the manuscript. This work was supported in part by NIH EB006433, EY023101, HL117664, and NSF CBET-1264782.
Footnotes
The Definition of the SNR used is as follows, , where power of a vector is calculated as the mean of the squared value of each entry in the vector.
Publisher's Disclaimer: This is a PDF file of an unedited manuscript that has been accepted for publication. As a service to our customers we are providing this early version of the manuscript. The manuscript will undergo copyediting, typesetting, and review of the resulting proof before it is published in its final citable form. Please note that during the production process errors may be discovered which could affect the content, and all legal disclaimers that apply to the journal pertain.
References
- Baillet S, Mosher J, Leahy R. Electromagnetic Brain Imaging. IEEE Trans Signal Process. 2001;18:14–30. [Google Scholar]
- Dale A, Sereno M. Improved localization of cortical activity by combining EEG and MEG with MRI cortical surface reconstruction: a linear approach. J Cog Neurosci. 1993;5:162–176. doi: 10.1162/jocn.1993.5.2.162. [DOI] [PubMed] [Google Scholar]
- De Munck JC, Vijn PCM, Spekreijse H. A practical method for determining electrode positions on the head. Electroencephalogr Clin Neurophysiol. 1991;89:85–7. doi: 10.1016/0013-4694(91)90023-w. [DOI] [PubMed] [Google Scholar]
- De Peralta-Menendez R, Gonzalez-Adino S. A critical analysis of linear inverse solutions to the neuroelectromagnetic inverse problem. IEEE Trans Biomed Eng. 1998;45:440–8. doi: 10.1109/10.664200. [DOI] [PubMed] [Google Scholar]
- Ding L, Worell GA, Lagerlund TD, He B. Ictal source analysis: Localization and imaging of casual interactions in humans. NeuroImage. 2007;34:575–586. doi: 10.1016/j.neuroimage.2006.09.042. [DOI] [PMC free article] [PubMed] [Google Scholar]
- Ding L, Lai Y, He B. Low resolution brain electromagnetic tomography in a realistic geometry head model: a simulation study. Phys Med Biol. 2005;50:45–56. doi: 10.1088/0031-9155/50/1/004. [DOI] [PubMed] [Google Scholar]
- Ding L, Worrell G, Lagerlund T, He B. 3D source localization of interictal spikes in epilepsy patients with MRI lesions. Phys Med Biol. 2006;51:4047–62. doi: 10.1088/0031-9155/51/16/011. [DOI] [PMC free article] [PubMed] [Google Scholar]
- Ebersole JS. Noninvasive localization of epileptogenic foci by EEG source modeling. Epilepsia. 2000;41:24–33. doi: 10.1111/j.1528-1157.2000.tb01531.x. [DOI] [PubMed] [Google Scholar]
- Engel J., Jr . Approaches to localization of the epileptogenic lesion. In: Engel J Jr, editor. Surgical treatment of the epilepsies. New York: Raven Press; 1987. pp. 75–9. [Google Scholar]
- Engel J., Jr Surgical treatment for epilepsy: too little, too late? JAMA. 2008;300:2548–50. doi: 10.1001/jama.2008.756. [DOI] [PubMed] [Google Scholar]
- Freeman W, Holmes M, Burke B, Vanhatalo S. Spatial spectra of scalp EEG and EMG from awake humans. Clin Neurophysiol. 2003;114:1053–68. doi: 10.1016/s1388-2457(03)00045-2. [DOI] [PubMed] [Google Scholar]
- Fukushima M, Yamashita O, Kanemura A, Ishii S, Kawato M, Sato MA. A state-space modeling approach for localization of focal current sources from MEG. IEEE Trans Biomed Eng. 2012;59:1561–1571. doi: 10.1109/TBME.2012.2189713. [DOI] [PubMed] [Google Scholar]
- Gevins A. High esolution EEG. Brain Topogr. 1993;5:321–25. doi: 10.1007/BF01128684. [DOI] [PubMed] [Google Scholar]
- Grova C, Daunizeau J, Lina J, Bénar C, Benali H, Gotman J. Evaluation of EEG localization methods using realistic simulations of interictal spikes. Neuroimage. 2006;29:734–53. doi: 10.1016/j.neuroimage.2005.08.053. [DOI] [PubMed] [Google Scholar]
- Hämäläinen M, Ilmoniemi R. Interpreting measured magnetic fields of the brain: estimates of current distribution. Helsinki: University of Technology, Dept. of Technical Physics; 1984. Report TKK-F-A559. [Google Scholar]
- Hämäläinen M, Sarvas J. Realistic conductivity geometry model of the human head for interpretation of neuromagnetic data. IEEE Trans Biomed Eng. 1989;36:165–71. doi: 10.1109/10.16463. [DOI] [PubMed] [Google Scholar]
- He B, Musha T, Okamoto Y, Homma S, Nakajima Y, Sato T. Electric dipole tracing in the brain by means of the boundary element method and its accuracy. IEEE Trans Biomed Eng. 1987;34:406–14. doi: 10.1109/tbme.1987.326056. [DOI] [PubMed] [Google Scholar]
- He B, Zhang X, Lian J, Sasaki H, Wu D, Towle VL. Boundary Element Method-Based Cortical Potential Imaging of Somatosensory Evoked Potentials Using Subjects’ Magnetic Resonance Images. NeuroImage. 2002;16:564–76. doi: 10.1006/nimg.2002.1127. [DOI] [PubMed] [Google Scholar]
- He B, Yang L, Wilke C, Yuan H. Electrophysiological imaging of brain activity and connectivity – challenges and opportunities. IEEE Trans Biomed Eng. 2011;58:1918–31. doi: 10.1109/TBME.2011.2139210. [DOI] [PMC free article] [PubMed] [Google Scholar]
- He B, Ding L. Electrophysiological mapping and neuroimaging. In: He B, editor. Neural Engineering. New York: Springer; 2013. [Google Scholar]
- He B, Coleman T, Genin G, Glover G, Hu X, Johnson N, et al. Grand challenges in mapping the human brain: NSF workshop report. IEEE Trans Biomed Eng. 2013;60:2983–92. doi: 10.1109/TBME.2013.2283970. [DOI] [PubMed] [Google Scholar]
- Herrendorf G, Steinhoff B, Kolle R, Baudewig J, Waberski T, Buchner H, et al. Dipolesource analysis in a realistic head model in patients with focal epilepsy. Epilepsia. 2000;41:71–80. doi: 10.1111/j.1528-1157.2000.tb01508.x. [DOI] [PubMed] [Google Scholar]
- Huppertz H, Hof E, Klisch J, Wagner M, Lücking C, Kristeva-Feige R. Localization of interictal delta and epileptiform EEG activity associated with focal epileptogenic brain lesions. Neuroimage. 2001;13:15–28. doi: 10.1006/nimg.2000.0680. [DOI] [PubMed] [Google Scholar]
- Junghöfer M, Elbert T, Tucker D, Rockstroh B. Statistical control of artiacts in dense array EEG/MEG studies. Psychophysiology. 2000;37:523–532. [PubMed] [Google Scholar]
- Khosla D, Don M, Kwong B. Spatial mislocalization of EEG electrodes effects on accuracy of dipole estimation. Clin Neurophysiol. 1999;110:261–71. doi: 10.1016/s0013-4694(98)00121-7. [DOI] [PubMed] [Google Scholar]
- Krings T, Chiappa K, Cuffin B, Buchbinder B, Cosgrove G. Accuracy of electroencephalographic dipole localization of epileptiform activities associated with focal brain lesions. Ann Neurol. 1998;44:76–86. doi: 10.1002/ana.410440114. [DOI] [PubMed] [Google Scholar]
- Lai D, Zhang X, Van Drongelen W, Korhman M, Hecox K, Ni Y, He B. Localization of Endocardial Ectopic Activity by Means of Noninvasive Endocardial Surface Current Density Reconstruction. NeuroImage. 2011;54:244–52. [Google Scholar]
- Lantz G, Grave de Peralta R, Spinelli L, Seeck M, Michel C. Epileptic source localization with high density EEG: how many electrodes are needed. Clin Neurophysiol. 2003a;114:63–9. doi: 10.1016/s1388-2457(02)00337-1. [DOI] [PubMed] [Google Scholar]
- Lantz G, Spinelli L, Seeck M, de Peralta Menendez R, Sottas C, Michel C. Propagation of interictal epileptiform activity can lead to erroneous source localizations: a 128-channel EEG mapping study. J Clin Neurophysiol. 2003b;20:311–9. doi: 10.1097/00004691-200309000-00003. [DOI] [PubMed] [Google Scholar]
- Leijten F, Huiskamp G. Interictal electromagnetic source imaging in focal epilepsy: practices, results and recommendations. Curr Opin Neurol. 2008;21:437–45. doi: 10.1097/WCO.0b013e3283081e23. [DOI] [PubMed] [Google Scholar]
- Lu Y, Yang L, Worrell G, He B. Seizure source imaging by means of FINE spatio-temporal dipole localization and directed transfer function in partial epilepsy patients. Clin Neurophysiol. 2012a;123:1275–83. doi: 10.1016/j.clinph.2011.11.007. [DOI] [PMC free article] [PubMed] [Google Scholar]
- Lu Y, Yang L, Worrell G, Brinkmann B, Nelson C, He B. Dynamic imaging of seizure activity in pediatric epilepsy patients. Clin Neurophysiol. 2012b;123:2122–29. doi: 10.1016/j.clinph.2012.04.021. [DOI] [PMC free article] [PubMed] [Google Scholar]
- Lu Y, Worrell G, Zhang H, Yang L, Brinkmann B, Nelson C, He B. Noninvasive imaging of the high frequency brain activity in focal epilepsy patients. IEEE Trans Biomed Eng. 2014;61:1660–67. doi: 10.1109/TBME.2013.2297332. [DOI] [PMC free article] [PubMed] [Google Scholar]
- McMenamin B, Shackman A, Maxwell J, Bachhuber D, Koppenhaver A, Greischar L, Davidson R. Validation of ICA-based myogenic correction for scalp and sourc-localized EEG. NeuroImage. 2010;49:2416–32. doi: 10.1016/j.neuroimage.2009.10.010. [DOI] [PMC free article] [PubMed] [Google Scholar]
- Michel C, Grave de Peralta R, Lantz G, Andino S, Spinelli L, Blanke O, Landis T, Seeck M. Spatiotemporal EEG Analysis and Distributed Source Estimation in Presurgical Epilepsy Evaluation. Clin Neurophysiol. 1999;16:239–66. doi: 10.1097/00004691-199905000-00005. [DOI] [PubMed] [Google Scholar]
- Michel C, Lantz G, Spinelli L, Grave dePeralta R, Landis T, Seeck M. 128-Channel EEG Source Imaging in Epilepsy: Clinical Yield and Localization Precision. Clin Neurophysiol. 2004a;21:71–83. doi: 10.1097/00004691-200403000-00001. [DOI] [PubMed] [Google Scholar]
- Michel C, Murray M, Lantz G, Gonzalez S, Spinelli L, Grave de Peralta R. EEG Source Imaging. Clin Neurophysiol. 2004b;115:2195–2222. doi: 10.1016/j.clinph.2004.06.001. [DOI] [PubMed] [Google Scholar]
- Mirkovic N, Adjouadi M, Yaylali I, Jayakar P. 3-d Source localization of epileptic foci integrating EEG and MRI data. Brain Topogr. 2003;16:111–9. doi: 10.1023/b:brat.0000006335.75534.78. [DOI] [PubMed] [Google Scholar]
- Nunez P, Srinivasan R. Electric fields and curents in biological tissue. In: Nunez P, Srinivasan R, editors. Electric fields of the brain. The neurophysics of EEG. Oxford University Press; New York: 2006. pp. 147–202. [Google Scholar]
- Oikonomou VP, Blekas K, Astrakas L. A sparse and spatially constrained generative regression model for fMRI data analysis. IEEE Trans Biomed Eng. 2012;59:58–67. doi: 10.1109/TBME.2010.2104321. [DOI] [PubMed] [Google Scholar]
- Palmini A, Andermann F, Olivier A, Tampieri D, Robitaille Y. Focal neuronal migration disorders and intractable partial epilepsy: results of surgical treatment. Ann Neurol. 1991;30:750–7. doi: 10.1002/ana.410300603. [DOI] [PubMed] [Google Scholar]
- Pascual-Marqui RD. Standardized low-resolution brain electromagnetic tomography (sLORETA): Technical details. Methods Find Exp Clin Pharmacol. 2002;24D:5–12. [PubMed] [Google Scholar]
- Picton T, Lins O, Scherg M. The recording and analysis of event-related. In: Boller F, Grafman J, editors. Handbook of Neurophysiology. Amsterdam: Elsevier; 1995. pp. 3–73. [Google Scholar]
- Picton T, Bentin S, Berg P, Donchin E, Hillyard S, Johnson R, et al. Guidelines for using human event-related potentials to study cognition: Recordin standards and publication citeria. Psychophysiology. 2000;37:127–52. [PubMed] [Google Scholar]
- Plummer C, Harvey A, Cook M. EEG source localization in focal epilepsy: Where are we now. Epilepsia. 2008;49:201–18. doi: 10.1111/j.1528-1167.2007.01381.x. [DOI] [PubMed] [Google Scholar]
- Roth B, Ko D, von Albertini-Carletti I, Scaffidi D, Sato S. Dipole localization in patients with epilepsy using the realistically shaped head model. Electroencephalogr Clin Neurophysiol. 1997;102:159–66. doi: 10.1016/s0013-4694(96)95111-5. [DOI] [PubMed] [Google Scholar]
- Russell G, Eriksen K, Poolman P, Tucker D. Geodesic photogrammetry for localizing sensor positions in dense array EEG. Clin Neurophysiol. 2005;116:1130–40;. doi: 10.1016/j.clinph.2004.12.022. [DOI] [PubMed] [Google Scholar]
- Shinnar S, Pellock JM. Update on the epidemiology and prognosis of pediatric epilepsy. J Child Neurol. 2002;17:S4. doi: 10.1177/08830738020170010201. [DOI] [PubMed] [Google Scholar]
- Siegel AM, Cascino GD, Meyer FB, McClelland RL, So EL, Marsh WR, et al. Resective reoperation for failed epilepsy surgery: seizure outcome in 64 patients. Neurology. 2004;63:2298–302. doi: 10.1212/01.wnl.0000147476.86575.a7. [DOI] [PubMed] [Google Scholar]
- Sperli F, Spinelli L, Seeck M, Kurian M, Michel C, Lantz G. EEG Source Imaging in Pediatric Epilepsy Surgery: A New Perspective in Presurgical Workup. Epilepsia. 2006;47:981–90. doi: 10.1111/j.1528-1167.2006.00550.x. [DOI] [PubMed] [Google Scholar]
- Spitzer A, Cohen L, Fabrikant J, Hallett M. A method for determining optimal interelectrode spacing for cerebral topographic mapping. Electroencephalogr Clin Neurophysiol. 1989;72:355–61. doi: 10.1016/0013-4694(89)90072-2. [DOI] [PubMed] [Google Scholar]
- Srinivasan R, Nunez P, Tucker D, Silberstein R, Cadusch P. Spatial sampling and filtering of EEG with spline laplacians to estimate cortical potentials. Brain Topogr. 1996;8:355–66. doi: 10.1007/BF01186911. [DOI] [PubMed] [Google Scholar]
- Srinivasan R, Tucker D, Murias M. Estimating the spatial Nyquist of the human EEG. Behavior Research Methods, Instruments, & Computers. 1998;30:8–19. [Google Scholar]
- Tao JX, Ray A, Hawes-Ebersole S, Ebersole JS. Intracranial EEG Substrates of Scalp EEG Interictal Spikes. Epilepsia. 2005;46:669–76. doi: 10.1111/j.1528-1167.2005.11404.x. [DOI] [PubMed] [Google Scholar]
- Towle VL, Bolanos J, Suarez D, Tan K, Grzeszczuk R, Levin DN, Cakmur R, Frank SA, Spire J-P. The spatial location of EEG electrodes: locating the best-fitting sphere relative to cortical anatomy. Electroencephalogr Clin Neurophysiol. 1993;86:1–6. doi: 10.1016/0013-4694(93)90061-y. [DOI] [PubMed] [Google Scholar]
- Tucker D. Spatial sampling of head electric fields: the geodesic sensor net. Electroencephalogr Clin Neurophysiol. 1993;87:154–63. doi: 10.1016/0013-4694(93)90121-b. [DOI] [PubMed] [Google Scholar]
- Wang H, Tang Q, Zheng W. L1-norm-based common spatial patterns. IEEE Trans Biomed Eng. 2012;59:653–662. doi: 10.1109/TBME.2011.2177523. [DOI] [PubMed] [Google Scholar]
- Wang G, Worrel G, Yang L, Wilke C, He B. Interictal spike analysis of high-density EEG in patients with partial epilepsy. Clin Neurophysiol. 2011;112:1098–1105. doi: 10.1016/j.clinph.2010.10.043. [DOI] [PMC free article] [PubMed] [Google Scholar]
- Wang Y, Gotman J. The influence of electrode location errors on EEG dipole source localization with a realistic head model. Clin Neurophysiol. 2001;112:1777–80. doi: 10.1016/s1388-2457(01)00594-6. [DOI] [PubMed] [Google Scholar]
- Wu SC, Swindlehurst AL, Wang PT, Nenadic Z. Efficient dipole parameter estimation in EEG systems with near-ML performance. IEEE Trans Biomed Eng. 2012;59:1339–1348. doi: 10.1109/TBME.2012.2187336. [DOI] [PubMed] [Google Scholar]
- Yang L, Wilke C, Brinkmann B, Worrel GA, He B. Dynamic imaging of ictal oscillations using non-invasive high-resolution EEG. NeuroImage. 2011;56:1908–17. doi: 10.1016/j.neuroimage.2011.03.043. [DOI] [PMC free article] [PubMed] [Google Scholar]
- Zhang X, van Drongelen W, Hecox K, Towle V, Frim D, McGee A, et al. Highresolution EEG: cortical potential imaging of interictal spikes. Clin Neurophysiol. 2003;114:1963–73. doi: 10.1016/s1388-2457(03)00194-9. [DOI] [PubMed] [Google Scholar]
Associated Data
This section collects any data citations, data availability statements, or supplementary materials included in this article.
Supplementary Materials
The source location of all interictal spikes in Patient 1 obtained using respectively (A) 128, (B) 96, (C) 64 and (D) 32 electrodes. The blue dot represents the location of maximum of sLORETA inverse solution. The red dot represents the ECoG electrodes marked as seizure onset zone electrodes.


