

Abstract
Mesenchymal cells transdifferentiation and extracellular matrix deposition are involved in the fibrotic process of Crohn’s disease (CD). Mesenchymal smooth muscle cells (SMCs) de-differentiation, driven by Platelet-derived growth factor (PDGF) that counteracts Transforming growth factor (TGF-β) has been studied in vascular muscle. The role of SMCs in intestinal fibrogenesis is still not clearly elucidated. Aim of the study was to evaluate the possible myogenic contribution to CD fibrotic process through the comparative analysis of histological, morphometric and molecular alterations occurring in human smooth muscle. Full thickness specimens were obtained from CD (non-involved and stenotic tracts) and healthy (control) ileum. Tissues were processed for histological and immunohistochemical (IHC) analyses and SMCs were isolated from the muscularis propria for morphofunctional and molecular (qPCR) analyses. CD stenotic ileum showed a significant increased thickness of all layers compared to CD non-involved and control ileum. IHC revealed an overexpression of α-smooth muscle actin and collagens I-III throughout all intestinal layers only in stenotic tracts. The two growth factors, PDGF and TGF-β, showed a progressive increase in expression in the muscle layer from CD non-involved to stenotic tracts. Freshly isolated SMCs presented alterations in CD non-involved tracts that progressively increased in the stenotic tracts consisting in a statistical increase in mRNA encoding for PDGF-β and collagen III, paralleled to a decrease in TGF-β and Tribbles-like protein-3 mRNA, and altered morphofunctional parameters consisting in progressive decreases in cell length and contraction to acetylcholine. These findings indicate that intrinsic myogenic alterations occur in CD ileum, that they likely precede stricture formation, and might represent suitable new targets for anti-fibrotic interventions.
Key words: Fibrosis, Crohn’s disease, ileal smooth muscle cells, stricture formation, PDGF, TGF-β
Introduction
The Crohn’s disease (CD) is a chronic relapsing inflammatory bowel disease potentially affecting any portion of the gastrointestinal tract characterized by a discontinuous and ulcerous transmural inflammation often involving the ileocecal region. Clinical CD behavior is variable with more than one-third of patients developing, in their lifetime, a stricturing pattern, mainly associated to an ileal location of the disease.1 The presence of strictures may determine clinical intestinal obstructions that usually need surgery and are accompanied by high recurrence rates.2,3 While the pathogenesis of inflammation in CD has been extensively investigated, knowledge of stricture pathogenesis still remains limited. Fibrogenesis in CD has a complex etiology resulting from a complicated interaction among local inflammatory cells, cytokines and mesenchymal intestinal cells (fibroblasts, myofibroblasts and smooth muscle cells).4 Strictures are the result of chronic transmural inflammation and they are due to an excessive and abnormal deposition of extracellular matrix produced by activated myofibroblasts, that exhibit an hybrid phenotype between fibroblasts and smooth muscle cells (SMCs).5-8 In CD, a state of constant differentiation and de-differentiation among the three mesenchymal phenotypes has been observed with a prevalent phenotypic switch of fibroblasts into myofibroblasts.9,10 The contribution of SMCs, myofibroblast precursors,11 in CD fibrotic process has been suggested but less extensively studied.12 In atheromatous fibrotic plaque evolution,11 the main constituent is the SMC that contributes to extracellular matrix (ECM) components, throughout a process known as phenotypic modulation, consisting in the transition from a quiescent, contractile phenotype to a myofibroblast-like proliferative synthetic state.13 In vascular muscle, the contractile phenotype is under control of transforming growth factor beta (TGF-β) that, in association with bone morphogenetic protein (BMP), inhibits SMCs proliferation and migration, and stimulates gene expression of the contractile smooth-muscle protein α-actin.14-16 The switch from a contractile to a synthetic SMCs phenotype is conversely driven by the Platelet-derived growth factor beta (PDGF-β), that counteracts TGF-β signaling by increasing miR-24 expression, which induces a downregulation of the Tribbles-like protein-3 (Trb3) and a decrease in Smad protein levels, key molecules for TGF-β signaling.13,16 During transition to the synthetic phenotype, SMCs begin to synthesize collagen.17
The aim of the present study was to evaluate the possible contribution of intestinal human smooth muscle to CD fibrotic process through the comparative analysis of histological, morphometric and molecular alterations occurring in smooth muscle of non-involved and stenotic ileum of patients with Crohn’s disease in respect to control.
Materials and Methods
Tissues specimens
Full thickness intestinal wall specimens were obtained from 9 patients (5 males and 4 females, median age 45, range 31-64 years, all B2-L1 according to the Montreal classification) subjected to surgery for CD obstructive symptoms. From each surgical specimen, two tissue samples were collected from the diseased stenotic tract and two from the macroscopically non-involved bowel (CD non-involved tract), proximal to the surgical margin of the resection. Control specimens of terminal ileum were obtained from 3 patients, which had surgery for carcinomas of the right colon. Tissue samples were collected from the resection margin, at least 5 cm from the neoplastic area, immediately after surgical removal of the tumor. Samples for primary SMCs culture were immediately immersed in chilled antibiotics-supplemented PBS buffer.
Histology and morphometry
Samples were fixed in 10% buffered formalin and embedded in low-paraffin. Three μm sections were stained with hematoxylin-eosin and Masson’s trichrome and observed under an Olympus BX51 Light Microscope (Olympus, Optical Co. Ltd, Tokyo, Japan). The degree of intestinal inflammation was assessed and scored on a 0-3 scale, as follows: 0, absence of infiltrate; 1, infiltrate at the subepithelium and lamina propria level; 2, infiltrate reaching muscularis mucosae; 3, severe and extended infiltrate reaching submucosa and/or involving muscularis propria.18
The thickness of mucosa, submucosa, muscularis propria and serosa layers of non-involved and stenotic tracts was quantitatively estimated. Two pathologists independently performed histological score and morphometric analysis on all specimens. For each specimen more than 6 different sections were performed and 6 random different fields for each section were analyzed in a double blind fashion with an agreement always higher than 90%. Quantitative morphometric analysis of the myenteric plexus area was also performed and expressed as the area occupied by myenteric plexus/total area x 100. For each sample, more than five myenteric plexuses positive for neuronal cocktail (see below) were studied. Data are expressed as the percentage of immunohistochemical positive cells over the total area examined. Microphotographs were taken by Olympus BX-51 (Optical Co. Ltd.) with a videocam (Spot Insight, Diagnostic Instrument, Inc., Sterling Heights, MI, USA) and processed with an image analysis system (IAS-Delta Sistemi, Rome, Italy) software.
Immunohistochemistry
For immunohistochemistry (IHC), sections were mounted on glass slides coated with 0.1% poly-L-lysine. After deparaffination, endogenous peroxidase activity was blocked by a 20-min incubation in hydrogen peroxide (2.5%). Sections were incubated overnight at 4°C with polyclonal antibodies to Transforming growth factor beta (TGF-β1 #sc-146, 1:400), collagen types I-III (#sc-8784 and #sc-8781 respectively, 1:200), Platelet-derived growth factor (PDGF-A #sc-128, 1:100), C-kit (#sc-168, 1:400), α-smooth muscle actin (α-SMA, #sc-32251, 1:400), a neuronal cocktail antibodies (S100, #sc-7849-R; antineurofilament n-4142, Sigma Aldrich, St. Louis, MO, USA; NSE #sc-292097, 1:2000) and Glial fibrillary acidic protein (GFAP Sigma Aldrich G-3893, 1:400). Samples were then rinsed with PBS for 5 min and incubated with a labeled streptavidin-biotin-peroxidase conjugate kit (Dako LSAB, cod. K0675, Dako-Cytomation, Milan, Italy). After rinsing in PBS for 10 min, the sections were incubated with 3,3-diaminobenzidine-tetrahydrochloride (DAB, Sigma Aldrich) for 1-3 min.
To demonstrate the specificity of immunoreaction, negative and positive controls were performed for all immunoreactions. For negative controls, the primary antibody was replaced (same dilution) with normal serum from the same species. For positive controls, the following tissues were tested: mouse uterus extract, human colon carcinoma and human breast cancer were used for TGFβ1, PDGF and C-kit respectively, while α-SMA, collagen I and III and cocktail neuronal positivity are intrinsic in the sample. Finally, the samples were counter-stained with Mayer’s hematoxylin and observed under a photomicroscope (Olympus BX51 Light Microscopy). The intensity of the immunoreaction was assessed and scored according to the density and extent of immunopositivity as follows: absent, no discernible staining; mild, limited to typical sides; moderate, marked positive immunostaining in typical sides with a weak positivity in atypical layers; and severe, strong and transmural overexpression.19
Colorimetric evaluation of collagen content
Sections of 15-mμ thick, 100 mm2 large, were obtained from each specimen and used for colorimetric evaluation. For this purpose the sections were deparaffinized through successive baths in absolute toluol, toluol:ethanol (50:50) and 50% aqueous ethanol and water. Staining procedures with fast green FCF 0.1 (Chroma-Gesellschaft, no. IA30, Stuttgart, Germany) and Sirius Red F3B 0.01% (Atomergic Chemical Corporation, no. 10022; Plainview, New York, NY, USA) were performed according to Gascon-Barrè.20 Colors were eluted in 0.05 M NaOH and 50% aqueous methanol. The eluted colors were examined in a Lambda 4 B PE spectrophotometer. Correlations between absorbance and protein estimations were assessed using the following formulas according to Gascon-Barrè:20
i) Non-collagenous protein determination by: non-collagenous protein (mg) = absorbance at 605 nm/2.08;
ii) Collagenous protein determination using the latter interference factor by: collagen (µg) = (absorbance at 540 nm- 0.26 absorbance at 605 nm)/38.4;
iii) Collagen content (collagen/protein ratio) by: collagen content (µg/mg total protein) = µg collagen/(µg collagen+mg non-collagenous protein)
Primary culture of human intestinal smooth muscle cells
Human SMCs were isolated as previously described.21 Briefly, slices of circular muscle layer were incubated overnight in DMEM supplemented with penicillin-streptomycin solution (10,000 U/mL), gentamicin (1 mg/mL), anphotericin B (250 μg/mL), fetal bovine serum, an ATP-regenerating system (ATP 3 mM, phosphocreatine 10 mM, creatine phosphokinase 10 U/mL), antimycin (10 μM) and collagenase (150 U/mL). On the following day, digested muscle strips were suspended in DMEM supplemented only with FBS and antibiotics for 20 min to allow spontaneous dissociation of SMCs. Cells were then harvested and used immediately to prepare RNA or to perform morpho-functional analysis.
Total RNA extraction
Total RNA was harvested from human SMCs using Trizol (Invitrogen-Life Technologies, Paisley, UK), according to the manufacturer’s protocol. RNA integrity was confirmed by electrophoresis on 1% agarose gel and ethidium bromide staining (0.1 μg/mL). RNA quantification was performed using spectrophotometry, with optical density at 260 nm used to estimate the concentration of total RNA.
cDNA synthesis
Approximately 1 μg of total RNA, from each preparation, was used for cDNA synthesis in a total volume of 20 μL of RT-buffer using the SuperSriptTM system (Invitrogen Life Technologies) containing 50 mM Tris-HCl (pH 8.3), 75 mM KCl, 5 mM MgCl2, 10 mM dithiothreitol (DTT), 0.5 mM deoxynucleoside triphosphates (dNTP), 0.5 μg Oligo (dT) and 50 U of RT. The reactions were carried out at 42°C for 50 min and terminated by heating at 70°C for 15 min.
Real-time PCR
After treatment at 37°C for 30 min with 20-50 units of RNase-free DNase I, oligo-dT primers (Roche Diagnostics Corp. Indianapolis USA) were used to synthesize single-stranded cDNA. mRNAs were quantified using SYBR green Master Mix (Applera Corp., Foster City, CA, USA) with specific human oligonucleotides in a GeneAmp Abiprism 7000 (Applera Corp.). In each assay, calibrated and no-template controls were included. Each sample was run in duplicate. SYBR green dye intensity was analyzed using the Abiprism 7000 SDS software (Applera Corp.). All results were normalized to the unaffected housekeeping gene β-actin. The following specific human oligonucleotides were used: PDGF-β: 5’-CGATCCGCTCCTTTG ATGAT-3’; 5’-AGGCTGGTGTCCAAAGAATCC-3’; TGF-β: 5’-AAAATCGAGCAAGCTATGGATCTAG-3’, 5’-TGCTCTTTGAGGACCTCCACTT-3’; Trb3: 5’-CCTCTACGCCTTTTTCACT-3’; 5’-AGTATCT CAGGTCCCACGTA-3’; Collagen III: 5’-GGGAAC-AACTTGATGGTGCT-3’, 5’-CCTCCTTCAACAG CTTCCTG -3’.
Measurement of contractile response
Biological morpho-functional SMCs features (cell length and contractile response) were measured by image scanning micrometry using a ProgRes® camera with CapturePro 2.6 application software (Jenoptik Laser Optik, Jena, Germany) installed on a phase-contrast microscope Leica 2500 (Leica Microsystems, Wetzlar, Germany), as described previously.22 Quantitative evaluation was carried out, in the control state and upon exposure to a maximal dose of acetylcholine (1 µM), by measuring the length of 50 cells in sequential microscopic fields. Contraction was expressed as percentage decrease in cell length from control taken as 100.
Data and statistical analysis
Results are expressed as means±SE of triplicate examinations of n experiments, n referring to the number of experiments on specimens derived from separate intestinal specimens or primary cultures. Statistical analysis was performed by parametric ANOVA test, corrected for multiple comparisons by the Bonferroni procedure. P values of less than 0.05 were considered significant.
Ethical requirements
The study was approved by the Ethical Committee of La Sapienza University of Rome (ref. no. 1106, 2010). All subjects gave informed consent to the work.
Results
A significant increased thickness of all wall layers, except serosa, was observed in CD stenotic ileum, compared to CD non-involved tract and control ileum (Table 1), accompanied by a severe disarrangement of wall architecture, an high degree of fibrosis and a transmural inflammation (inflammation score, 2-3) that reached the muscularis propria. CD non-involved tract showed a normal morphological pattern and a regular connective tissue distribution, with a low level of inflammatory infiltrate limited to the mucosa (inflammation score, 1) as control specimen (Figure 1). In the stenotic tracts a significant increase of immunostaining of α-SMA was observed compared to normal and CD non involved tracts where α-SMA expression was limited to the smooth muscle cells of the muscularis mucosa and the muscularis propria as well as to the myocytes of the median layer of the vessels (Figure 2). In stenotic lesions, α-SMA immunoreactivity was also present in the mucosa and submucosa.
Table 1.
Relative thickness of intestinal wall layers in control ileum, Crohn’s disease non-involved and stenotic tracts.
| Layers | Control | CD non-involved tract | Cd stenotic tract | P* |
|---|---|---|---|---|
| Mucosa (µ) | 384.84±12.10 | 381.67±14.04 | 661.75±70.72* | <0.005 |
| Submucosa (µ) | 996.76±41.52 | 1046.14±46.24 | 1544.01±90.48* | <0.005 |
| Muscolaris propria (µ) | 1171.90±28.62 | 1191.06±36.76 | 1779.07±87.44* | <0.005 |
| Serosa (µ) | 379.34±23.18 | 389.49±30.46 | 439.55±42.86* | =0.356 |
CD, Crohn’s disease. Data are expressed as mean± SEM of 3-6 experiments.
*CD vs control.
Figure 1.
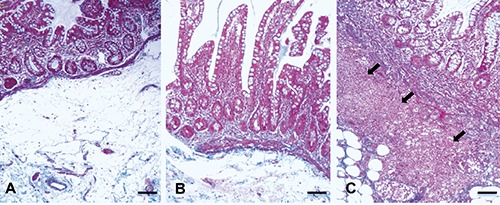
Masson trichromic staining. In Control ileum (A) and in Crohn’s disease (CD) non-involved tract (B) the inflammation was limited to the mucosa. CD stenotic tract (C) showed a transmural inflammation that reached the submucosa (arrows) and the muscolaris propria. Scale bars: 100 µm.
Figure 2.

Immunohistochemistry for α-Smooth Muscle Actin (α-SMA). A-C), α-SMA immunoreactivity was limited to the muscolaris mucosa (arrows) and muscolaris propria (*) in control ileum (A), Crohn’s disease non-involved (B), whereas in stenotic (C) (arrow heads) tracts immunoreactivity was also present in mucosa and submucosa layers; scale bars: 100 µm. D-F) α-SMA immunoreactivity in muscularis propria in control ileum (D), Crohn’s disease non-involved (E) and stenotic (F) tracts; scale bars: 50 µm.
TGF-β expression (Figure 3I) was mild in the submucosa and absent in the other wall layers in control ileum. Its immunoreactivity became mild in the muscularis propria in CD non-involved tract. In CD stenotic tract TGF-β staining was moderately expressed in the mucosa, severely widespread in the submucosa and moderately scattered in the smooth muscle layers. PDGF expression (Figure 3II), that was mild in the submucosa of control ileum, showed a progressive marked increased of immunopositivity throughout the mucosa, submucosa and muscularis propria from control to CD stenotic samples. qPCR analysis of the two growth factors was performed on cDNA obtained from SMCs, isolated separately from control, CD non-involved and stenotic tracts (Figure 4). Control SMCs constitutively expressed mRNA encoding for PDGF-β and TGF-β. At the molecular level, TGF-β expression differed from immunohistochemical findings in that it resulted highly expressed in SMCs isolated from control ileum and progressively decreased in CD non-involved and stenotic tracts, reaching a statistically significant difference in the latter in respect to control ileum (Figure 4A). Accordingly, a parallel decrease in mRNA encoding for Trb3, one of the key molecules for TGF-β signaling, was observed, that resulted already statistically significant in CD non-involved tract in respect to control ileum. In turn, SMCs mRNA encoding for PDGF-β paralleled immunohistochemical findings. PDGF-β was already significantly over-expressed in SMCs isolated from CD non-involved tract with respect to control ileum, with a further increase in that isolated from CD stenotic tract (Figure 4A). The progression of PDGF-β expression was further evident when qPCR products expression was compared between the two CD tracts of the same patient, with a 4.27±0.83 increase in SMCs isolated from CD stenotic tracts (Figure 4B).
Figure 3.

Immunohistochemistry for TGF-β (I); A) TGF-β immunoreactivity was mild in submucosa (arrow) in control ileum and (B) in Crohn’s disease non-involved, whereas in stenotic (C) tracts TGF-β staining was moderately expressed in mucosa (arrow) and severely widespread in submucosa (arrow heads); scale bars: 100 µm; D) TGF-β immunoreactivity is absent in muscolaris propria in control ileum, mild in Crohn’s disease non-involved (E) and moderate scattered in stenotic (F) tracts; scale bars: 50 µm. Immunohistochemistry for Platelet-Derived Growth Factor (PDGF) (II); A) PDGF immunoreactivity was mild in submucosa (arrow) in control ileum; B) moderately expressed in CD non-involved; C) markedly positive in stenotic tracts; scale bars: 100 µm; D) PDGF immunolocalization in muscularis propria showed a progressive increase of immunopositivity from in control ileum, Crohn’s disease non-involved (E) to stenotic (F) tracts; scale bars: 50 µm.
Figure 4.

qPCR products expression analysis. A) Fold-variation from control ileum in the expression of mRNA encoding for Platelet-derived growth factor (PDGF-β), Transforming growth factor beta (TGF-β), Tribbles-like protein-3 (Trb3), Collagen I (COLL I) and III (COLL III) in human smooth muscle cells isolated from Crohn’s disease non-involved (white column) and stenotic (grey column) tracts; data are mean ±SE of 4 independent experiments; *P<0.05 vs control; #P<0.05 Crohn stenotic vs non-involved tracts. B) %variation in expressions of mRNA encoding for Platelet-derived growth factor (PDGF-β), Transforming growth factor beta (TGF-β), Tribbles-like protein-3 (trb3), Collagen I (COLL I) and III (COLLIII) in smooth muscle cells.
Colorimetric evaluation of collagen content demonstrated statistically higher values of collagen in the CD stenotic compared with CD non-involved tracts (0.048±0.015 µg vs 0.034±0.006 µg, P<0.05), no significant differences were observed between CD non-involved tract and control ileum (0.034±0.006 µg vs 0.032±0.007 µg, P=0.38). In addition, collagen I-III immunoreactions, absent or mild in all the layers of CD non-involved tract and control ileum, resulted over-expressed in CD stenotic tract throughout all the intestinal layers, except the serosa (Figure 5). In parallel, SMCs isolated from CD stenotic tract presented a significant increase of 4.83±1.54 in mRNA encoding for Collagen III expression towards CD non-involved tract while no differences were present between the latter and control ileum.
Figure 5.

Immunohistochemistry for Collagen (I-III). A) Collagen (I-III) immunoreactivity was absent or mild in mucosa and submucosa in control ileum; B) Crohn’s disease non-involved; C) it was overexpressed in stenotic tracts (arrows); scale bars: 100 µm. D) Collagen (I-III) immunoreactivity located in muscolaris propria in control ileum; E) in Crohn’s disease non-involved; F) stenotic tracts show the same trend observed in mucosa and submucosa; scale bars: 50 µm.
Further alterations in SMCs isolated from CD tracts were observed in their morpho-functional parameters, comparing to control (Table 2). Firstly, SMCs presented a progressive shortening of resting cell length that reached a statistical significance, with respect to control, in SMCs isolated from CD stenotic tracts. Secondly, SMCs presented an impairment of maximal contractile response to the cholinergic agonist acetylcholine. In respect to control, maximal contraction to acetylcholine progressively decreased in SMC isolated from CD non-involved ileum, reaching a statistical difference in SMCs isolated from CD stenotic tracts. Finally, the neuronal cocktail immunoreactivity in nerve cell bodies of the myenteric plexus seems to show a disruption of plexus in CD stenotic tracts, probably due to an increase of the interspersed collagen fibers (Figure 6, upper panels). No differences were however observed in the percentage of the area occupied by the plexus: 3.84±1.99 for CD stenotic tract, 3.90±2.06 for CD non-involved tract and 3.95±1.43 for control ileum. Immunoreactivity of enteric glial cells (GFAP), located in the myenteric plexus and in nerve fibers of the circular and longitudinal muscle layers, did not present differences between control ileum and CD non-involved and stenotic tracts (Figure 6, central panels). Conversely, c-kit expression was confined at the level of the myenteric plexus in CD non-involved tract and control ileum, while it was distributed within the longitudinal and circular muscle layers of the muscularis propria in CD stenotic tract (Figure 6, lower panels).
Table 2.
Morpho-functional features of human smooth muscle cells isolated from control ileum and Crohn’s disease (CD) non-involved and stenotic tracts.
| Control | CD non-involved tract | CD stenotic tract | |
|---|---|---|---|
| Resting cell (µm) | 93.45±2.91 | 84.81±9.60 | 67.84±3.32* |
| Acetylcholine-induced contraction (%) | 19.20±2.57 | 16.60±1.72 | 8.14±1.14* |
CD, Crohn’s disease. Data are expressed as mean± SEM of 3-6 experiments.
*P<0.05 vs control.
Figure 6.

Immunohistochemistry for Neuronal cocktail (S100, antineurofilament, NSE), GFAP, and c-kit on control, Crohn’s disease (CD) non-involved and stenotic tracts. Myenteric plexus (upper panels) was observed in all specimens and appeared disrupted in CD stenotic ileum (arrows). Enteric glial cells (central panels), located in the myenteric plexus and in nerve fibers of the circular and longitudinal muscle layers, did not differ between control and CD non-involved and stenotic tracts. Interstitial cells of Cajal (lower panels) resulted confined between the longitudinal and the circular muscle layers in control ileum and CD non-involved tract whereas, in CD stenotic tract, they were distributed within the longitudinal and circular muscle layers of the muscolaris propria. Scale bars: 50 µm.
Discussion
In the present study, the comparative analysis carried out in parallel on whole mount tissues and freshly isolated SMCs of the same CD tracts, has offered the possibility to take a snapshot of intrinsic myogenic alterations occurring in vivo in chronic intestinal inflammation. It was demonstrated that SMCs isolated from CD ileum presented an overexpression of PDGF-β, the main growth factor driving the myogenic switch towards a synthetic phenotype, that was paralleled to a reduction of mRNAs encoding for factors contributing to the quiescent smooth muscle contractile phenotype, namely TGF-β and Trb3. Furthermore, alterations in SMC morphology and contractile activity were observed. These myogenic alterations, similar to that observed in vascular muscle,13,16 support the hypothesis that SMCs concur to intestinal fibrogenesis. Interestingly, these myogenic alterations were not only present in stenotic tracts but were also found in SMCs isolated from CD non-involved bowel. This latter observation acquires a potential importance in the context of the high recurrence post-surgical rate in the neoterminal ileum immediately proximal to the anastomosis.23,24
Fibrosis and CD stricture formation is the result of an uncontrolled and excessive process of intestinal healing. The main driver of gut fibrogenesis appears to be chronic inflammation, which leads to intestinal mesenchymal cell recruitment and activation. Up to now, evidence indicates that inflammation induces the activation of fibroblasts with increased biosynthetic collagen activity. These collagen-producing fibroblasts are labeled with antibodies to the filament αSMA supporting their differentiation towards myofibroblasts. The increase in the resident activated fibroblast population represents a pivotal mechanism for the development of intestinal fibrosis.25 However, smooth muscle proliferation also affects the nature and amount of extracellular matrix, with an inflammatory milieu driving change to these mesenchymal cells leading to fibrosis. Increased muscle cell proliferation and hypertrophy has been reported in CD stenosis, driven by an increase of Insulin-like growth factor-I mRNA and IGF-I protein production.26 Besides, islands of SMCs in the submucosa, with dense collagen deposition and disruption and expansion of muscularis mucosa, as well as collagen septae that extend through a disorganized muscularis propria, to form a greatly thickened muscularis, have been demonstrated in CD strictures.3 These alterations may also lead to the presence of an additional muscle layer in the submucosa with areas where a fusion of the muscularis mucosae and propria occurred.27 The overexpression of αSMA in all wall layers of CD stenotic tracts is in accordance with the above observations and supports the prevalent involvement of these two αSMA-positive mesenchymal cells in CD stricture,28 namely myofibroblasts and SMCs. Whereas the origin of intestinal myofibroblasts from fibroblasts has been established, controversies exist about their possible origin from SMCs.
Protracted smooth muscle proliferation has long been known to promote the loss of differentiated smooth muscle characteristics29 and TGF-β and the PDGF-β, key factors in the intestinal myofibroblats fibrotic response,4 have been also demonstrated to regulate phenotypic SMCs plasticity. In proliferative and obliterative vascular diseases, an aberrant SMCs switch from contractile to synthetic phenotype occurs with their consequent proliferation and transformation into myofibroblasts.13,30 Both growth factors, as well as collagens, are synthesized by the same SMCs.31 In vascular muscle, TGF-β stimulates the expression of contractile markers and maintains the contractile phenotype14 whereas PDGF-β is able to counteract the TGF signaling, through downregulation of Smads, key pro-contractile TGF-β-related signal transducers, and to mediate a switch from a contractile to synthetic phenotype, resulting in the de-differentiation of vascular smooth muscle cells.16 These inhibitory effects of PDGF-β on TGF-β signaling are mediated by a small non-coding microRNA (miRNA), namely miR-24. This miRNA downregulates the expression of Tribbles-like protein-3 (Trb3) mRNA with consequent decrease in Smad protein levels and then TGF-β signaling.32 Inhibition of miR-24 function in vascular smooth muscle prevents the SMCs switch towards a synthetic phenotype upon PDGF treatment.33 The role of PDGF-β in promoting growth of intestinal SMCs has been recently studied.34 Pro-inflammatory cytokines exerted a critical effect on SMCs by stimulating the expression of PDGF receptor in quiescent control cells and then further promoting the resulting growth response through its up-regulation. Immunohistochemical and myogenic qPCR alterations observed in the present study suggest that PDGF-β likely is involved in human intestinal fibrosis. Immunohistochemistry revealed a progressive overexpression from control ileum to CD stenosis of PDGF-β in all wall layers and the qPCR analysis highlighted the intrinsic increase in mRNA encoding for this growth factor in SMCs isolated from CD ileum. In muscle, this increase was paralleled by a decrease in SMCs expressions of mRNA encoding for TGF-β and Trb3. The intrinsic decrease of TGF-β expression in freshly isolated SMCs from CD tracts suggests that the moderate scattered TGF-β immunopositivity of smooth muscle layers might be ascribed to an attained de-differentiation of SMC in myofibroblasts. Available data on TGF-β expression in active CD are controversial as some authors found higher levels,35-37 while others found no differences compared to the healthy ileum.38,39 Of note is that, among fibrogenetic parameters, TGF-β mRNA expression is the only one that differs depending on the diseased bowel side.38
Cellular mechanisms involved in SMCs switch towards a synthetic de-differentiated phenotype appear then present in SMCs isolated from CD tracts suggesting, in accordance with previous observations,40 a possible SMCs involvement in stricture formation. Direct assays of proteins are however required to definitively establish smooth muscle contribution to CD fibrogenesis. In the light of the postsurgery recurrent disease in the neoterminal ileum, that maintains the original disease phenotype,41,42 the present demonstration of alterations in mRNA expression, encoding for factors regulating pro-synthetic phenotype switch already in SMCs isolated from CD non-involved tract, acquires an important pathophysiological relevance in the development of new possible therapeutic targets in anti-fibrotic treatments.
Besides hyperplasia and hypertrophy of intestinal mesenchymal cells, the other main feature of intestinal strictures is represented by the thickening of all layers of the intestinal wall and the net increase in extracellular matrix production and deposition3, both alterations being observed in the present study. Furthermore, similarly to the present observations, the increased levels of both type I and type III collagens have already been reported in CD fibrosis,43 mainly localized to internal intestinal layers.44 Analysis of the collagen types in human intestinal muscle reveals a predominance of types I and III,27 the latter subtype creates an ECM suited to scar contraction and stricture formation.45 An overexpression in mRNA encoding for collagen III was observed in SMCs, that however, differently from the previous parameters, was restricted to cells isolated from CD stricture. These overall changes likely result in both a loss of the normal compliance of the intestine and a thickening of the intestinal wall, resulting ultimately in the intestinal obstruction. Motor alterations are also likely favored by the observed changes of cellular SMCs morphology, contractile activity and of the enteric nervous apparatus observed in CD tracts. Ileal ganglioneuritis and alterations in interstitial cells of Cajal reported in CD ileum46 were in partly also observed in CD strictures in the present study. These were paralleled to differences in the distribution of Cajal cells that were confined to the myoenteric plexus in control ileum, while interspersed within the muscle layers in CD stenosis.
In conclusion, even if immunohistochemical and molecular analyses cannot define the complex relation between growth factors and intestinal mesenchymal cells during initiation or progression of fibrosis, this study highlights the presence of intrinsic myogenic alterations that appear both in CD stricture and in the upstream non-involved tract and that might contribute to intestinal motor alterations and, similarly to vascular musculature, might represent suitable possible new targets for antifibrotic interventions.
Acknowledgments
This study was supported by a grant from Italian Ministry of Education, University and Research (PRIN 2009: B81J11002260001) to CS.
References
- 1.Lichtenstein GR, Olson A, Travers S, Diamond RH, Chen DM, Pritchard ML, et al. Factors associated with the development of intestinal strictures or obstructions in patients with Crohn’s disease. Am J Gastroenterol 2006;101:1030-8. [DOI] [PubMed] [Google Scholar]
- 2.Van Assche G, Geboes K, Rutgeerts P. Medical therapy for Crohn’s disease strictures. Inflamm Bowel Dis 2004;10:55-60. [DOI] [PubMed] [Google Scholar]
- 3.Burke JP, Mulsow JJ, O’Keane C, Docherty NG, Watson RW, O’Connell PR. Fibrogenesis in Crohn’s disease. Am J Gastroenterol 2007;102:439-48. [DOI] [PubMed] [Google Scholar]
- 4.Wynn TA. Cellular and molecular mechanisms of fibrosis. J Pathol 2008;214:199-210. [DOI] [PMC free article] [PubMed] [Google Scholar]
- 5.Powell DW, Mifflin RC, Valentich JD, Crowe SE, Saada JI, West AB. Myofibroblasts I. Paracrine cells important in health and disease. Am J Physiol Cell Physiol 1999;277:C1-C9. [DOI] [PubMed] [Google Scholar]
- 6.Powell DW, Mifflin RC, Valentich JD, Crowe SE, Saada JI, West AB. Myofibroblasts II. Intestinal subepithelial myofibroblasts. Am J Physiol Cell Physiol 1999;277:C183-201. [DOI] [PubMed] [Google Scholar]
- 7.Gabbiani G. The myofibroblast in wound healing and fibrocontractive diseases. J Pathol 2003;200:500-3. [DOI] [PubMed] [Google Scholar]
- 8.Desmouliere A, Chaponnier C, Gabbiani G. Tissue repair, contraction, and the myofibroblast. Wound Repair Regen 2005;13:7-12. [DOI] [PubMed] [Google Scholar]
- 9.Rieder F, Fiocchi C. Intestinal fibrosis in IBD - a dynamic, multifactorial process. Nat Rev Gastroenterol Hepatol 2009;6:228-35. [DOI] [PubMed] [Google Scholar]
- 10.Rieder F, Brenmoehl J, Leeb S, Scholmerich J, Rogler G. Wound healing and fibrosis in intestinal disease. Gut 2007;56:130-9. [DOI] [PMC free article] [PubMed] [Google Scholar]
- 11.Hinz B, Phan SH, Thannickal VJ, Galli A, Bochaton-Piallat ML, Gabbiani G. The myofibroblast: one function, multiple origins. Am J Pathol 2007;170:1807-16. [DOI] [PMC free article] [PubMed] [Google Scholar]
- 12.Speca S, Giusti I, Rieder F, Latella G. Cellular and molecular mechanisms of intestinal fibrosis. World J Gastroenterol 2012;18:3635-61. [DOI] [PMC free article] [PubMed] [Google Scholar]
- 13.Owens GK, Kumar M S, Wamhoff B R. Molecular regulation of vascular smooth muscle cell differentiation in development and disease. Physiol Rev 2004;84:767-801. [DOI] [PubMed] [Google Scholar]
- 14.Misiakos EP, Kouraklis G, Agapitos E, Perrea D, Karatzas G, Boudoulas H, et al. Expression of PDGF-A, TGFb and VCAM-1 during the developmental stages of experimental atherosclerosis. Eur Surg Res 2001;33:264-9. [DOI] [PubMed] [Google Scholar]
- 15.Guo J, Sartor M, Karyala S, Medvedovic M, Kann S, Puga A, et al. Expression of genes in the TGF-beta signaling pathway is significantly deregulated in smooth muscle cells from aorta of aryl hydrocarbon receptor knockout mice. Toxicol Appl Pharmacol 2004;194:79-89. [DOI] [PubMed] [Google Scholar]
- 16.Lagna G, Ku MM, Nguyen PH, Neuman NA, Davis BN, Hata A. Control of phenotypic plasticity of smooth muscle cells by BMP signaling through the myocardin-related transcription factors. J Biol Chem 2007;282:37244-55. [DOI] [PMC free article] [PubMed] [Google Scholar]
- 17.Adiguzel E, Ahmad PJ, Franco C, Bendeck MP. Collagens in the progression and complications of atherosclerosis. Vasc Med 2009;14:73-89. [DOI] [PubMed] [Google Scholar]
- 18.Gaudio E, Taddei G, Vetuschi A, Sferra R, Frieri G, Ricciardi G, et al. Dextran sulfate Sodium (DSS) colitis in rats. Clinical, structural and ultrastructural aspects. Dig Dis Sci 1999;44:1458-75. [DOI] [PubMed] [Google Scholar]
- 19.Parkkila S, Lasota J, Fletcher JA, Ou WB, Kivelä AJ, Nuorva K, et al. Carbonic anhydrase II. A novel biomarker for gastrointestinal stromal tumors. Mod Pathol 2010;23:743-50. [DOI] [PMC free article] [PubMed] [Google Scholar]
- 20.Gascon-Barré M, Huet PM, Belgiorno J, Plourde V, Coulombe PA. Estimation of collagen content of liver specimens. Variation among animals and among hepatic lobes in cirrhotic rats. J Histochem Cytochem 1989;37:377-81. [DOI] [PubMed] [Google Scholar]
- 21.Tattoli I, Corleto V D, Taffuri M, Campanini N, Rindi G, Caprilli R, et al. Optimisation of isolation of richly pure and homogeneous primary human colonic smooth muscle cells. Dig Liver Dis 2004;36:735-43. [DOI] [PubMed] [Google Scholar]
- 22.Scirocco A, Matarrese P, Petitta C, Cicenia A, Ascione B, Mannironi C, et al. Exposure of Toll-like receptors 4 to bacterial lipopolysaccharide (LPS) impairs human colonic smooth muscle cell function. J Cell Physiol 2010;223: 442-50. [DOI] [PubMed] [Google Scholar]
- 23.Rutgeerts P, Geboes K, Vantrappen G, Beyls J, Kerremans R, Hiele M. Predictability of the postoperative course of Crohn’s disease. Gastroenterology 1990;99:956-63. [DOI] [PubMed] [Google Scholar]
- 24.Cullen G, O’toole A, Keegan D, Sheahan K, Hyland J M, O’donoghue DP. Long-term clinical results of ileocecal resection for Crohn’s disease. Inflamm Bowel Dis 2007;13:1369-73. [DOI] [PubMed] [Google Scholar]
- 25.Zeisberg M, Kalluri R. Cellular mechanisms of tissue fibrosis. 1. Common and organ-specific mechanisms associated with tissue fibrosis. Am J Physiol Cell Physiol 2013;304:C216-25. [DOI] [PMC free article] [PubMed] [Google Scholar]
- 26.Flynn RS, Murthy KS, Grider JR, Kellum JM, Kuemmerle JF. Endogenous IGF-I and alphaVbeta3 integrin ligands regulate increased smooth muscle hyperplasia in stricturing Crohn’s disease. Gastroenterology. 2010;138285-93. [DOI] [PMC free article] [PubMed] [Google Scholar]
- 27.Geboes KP, Cabooter L, Geboes K. Contribution of morphology for the comprehension of mechanisms of fibrosis in inflammatory enterocolitis. Acta Gastroenterol Belg 2000;63:371-6. [PubMed] [Google Scholar]
- 28.Sappino AP, Schürch W, Gabbiani G. Differentiation repertoire of fibroblastic cells: expression of cytoskeletal proteins as marker of phenotypic modulations. Lab Invest 1990;63:144-61. [PubMed] [Google Scholar]
- 29.Chamley-Campbell J, Campbell GR, Ross R. The smooth muscle cell in culture. Physiol Rev 1979;59:1-61. [DOI] [PubMed] [Google Scholar]
- 30.Smith P, Heath D, Yacoub M, Madden B, Caslin A, Gosney J. The ultrastructure of plexogenic pulmonary arteriopathy. J Pathol 1990;160:111-21. [DOI] [PubMed] [Google Scholar]
- 31.Rensen SSM, Doevendans PAFM, van Eys GJJM. Regulation and characteristics of vascular smooth muscle cell phenotypic diversity. Neth Heart J 2007;15:100-8. [DOI] [PMC free article] [PubMed] [Google Scholar]
- 32.Chan MC, Hilyard AC, Wu C, Davis BN, Hill NS, Lal A, et al. Molecular basis for antagonism between PDGF and the TGFbeta family of signalling pathways by control of miR-24 expression. EMBO J 2010;29:559-73. [DOI] [PMC free article] [PubMed] [Google Scholar]
- 33.Chan MC, Nguyen PH, Davis BN, Ohoka N, Hayashi H, Du K, et al. A novel regulatory mechanism of the bone morphogenetic protein (BMP) signaling pathway involving the carboxyl-terminal tail domain of BMP type II receptor. Mol Cell Biol 2007;27:5776-89. [DOI] [PMC free article] [PubMed] [Google Scholar]
- 34.Nair DG, Miller KG, Lourenssen SR, Blennerhassett MG. Inflammatory cytokines promote growth of intestinal smooth muscle cells by induced expression of PDGF-Rβ. J Cell Mol Med. 2014;18444-54. [DOI] [PMC free article] [PubMed] [Google Scholar]
- 35.Di Mola FF, Friess H, Scheuren A, Di Sebastiano P, Graber H, Egger B, et al. Transforming growth factor-betas and their signaling receptors are co-expressed in Crohn’s disease. Ann Surg 1999;229:67-75. [DOI] [PMC free article] [PubMed] [Google Scholar]
- 36.Flynn RS, Mahavadi S, Murthy KS, Grider JR, Kellum JM, Akbari H, et al. Endogenous IGFBP-3 regulates excess collagen expression in intestinal smooth muscle cells of Crohn’s disease strictures. Inflamm Bowel Dis 2011;17:193-201. [DOI] [PMC free article] [PubMed] [Google Scholar]
- 37.Babyatsky MW, Rossiter G, Podolsky DK. Expression of transforming growth factors alpha and beta in colonic mucosa in inflammatory bowel disease. Gastroenterology 1996;110:975-84. [DOI] [PubMed] [Google Scholar]
- 38.Scarpa M, Bortolami M, Morgan SL, Kotsafti A, Ferraro S, Ruffolo C, et al. TGF-beta1 and IGF-1 production and recurrence of Crohn’s disease after ileo-colonic resection. J Gastrointestinal Surgery 2008; 12:1981-90. [DOI] [PubMed] [Google Scholar]
- 39.Del Zotto B, Mumolo G, Pronio AM, Montesani C, Tersigni R, Boirivant M. TGF-β1 production in inflammatory bowel disease: differing production patterns in Crohn’s disease and ulcerative colitis. Clin Exp Immunol 2003;134:120-6. [DOI] [PMC free article] [PubMed] [Google Scholar]
- 40.Suekane T, Ikura Y, Watanabe K, Arimoto J, Iwasa Y, Sugama Y, et al. Phenotypic change and accumulation of smooth muscle cells in strictures in Crohn’s disease: relevance to local angiotensin II system. J Gastroenterol 2010;45:821-30. [DOI] [PubMed] [Google Scholar]
- 41.Ahmed T, Rieder F, Fiocchi C, Achkar JP. Pathogenesis of postoperative recurrence in Crohn’s disease. Gut 2011;60:553-62. [DOI] [PubMed] [Google Scholar]
- 42.Achkar JP, Hanauer SB. Medical therapy to reduce postoperative Crohn’s disease recurrence. Am J Gastroenterol 2000;95: 1139-46. [DOI] [PubMed] [Google Scholar]
- 43.Graham M F, Diegelmann R F, Elson C O, Lindblad W J, Gotschalk N, Gay S, et al. Collagen content and types in the intestinal strictures of Crohn’s disease. Gastroenterology 1988;94:257-65. [DOI] [PubMed] [Google Scholar]
- 44.Shelley-Fraser G, Borley NR, Warren BF, Shepherd NA. The connective tissue changes of Crohn’s disease. Histopathology 2012;60:1034-44. [DOI] [PubMed] [Google Scholar]
- 45.Bailey AJ, Bazin S, Sims TJ, Le Lous M, Nicoletis C, Delaunay A. Characterization of the collagen of human hypertrophic and normal scars. Biochim Biophys Acta 1975;405:412-21. [DOI] [PubMed] [Google Scholar]
- 46.Ohlsson B, Veress B, Lindgren S, Sundkvist G. Enteric ganglioneuritis and abnormal interstitial cells of Cajal: features of inflammatory bowel disease. Inflamm Bowel Dis 2007;13:721-6. [DOI] [PubMed] [Google Scholar]