

Abstract
A multi-inlet microfluidic hydrodynamic focusing (MF) system to prepare lipopolyplex (LP) containing Bcl-2 antisense deoxyoligonucleotide (ODN) was developed and evaluated. The lipopolyplex nanoparticles consist of ODN:protamine:lipids (1:0.3:12.5 wt/wt ratio) and the lipids included DC-Chol:egg PC:PEG–DSPE (40:58:2 mol/mol%). Using K562 human erythroleukemia cells, which contain an abundance of Bcl-2 and overexpression of transferrin receptors (TfR), and G3139 (oblimerson sodium or Genasense™) as a model cell line and drug, respectively, the Bcl-2 down-regulation at the mRNA and protein levels as well as cellular uptake and apoptosis was compared between the conventional bulk mixing (BM) method and the MF method. The lipopolyplex size and surface charge were characterized by dynamic light scattering (DLS) and zeta potential (ζ) measurement, respectively, while the ODN encapsulation efficiency was determined by gel electrophoresis. Cryogenic transmission electron microscopy (Cryo-TEM) was used to determine the morphology of LPs. Our results demonstrated that MF produced LP nanoparticles had similar structures but smaller size and size distribution compared to BM LP nanoparticles. MF LP nanoparticles had higher level of Bcl-2 antisense uptake and showed more efficient down-regulation of Bcl-2 protein level than BM LP nanoparticles.
Keywords: Microfluidics, Liposome, Antisense ODN, G3139, Lipopolyplex, Bcl-2 down-regulation, Nanoparticle
1. Introduction
Modulation of oncogene expression by antisense or reverse complementary oligodeoxyribonucleotides (ODNs) has long been pursued as a therapeutic strategy in cancer treatment. Antisense ODNs are single-stranded deoxyribonucleic acid (DNA), typically 16–29 bases, that hybridize to specific genes or their mRNA products by Watson– Crick base pairing, thereby resulting in a disruption of the targets’ functions [1,2]. The ODN–mRNA complex then becomes a substrate for intracellular RNases (i.e., RNase H) that catalyze mRNA target degradation, while allowing the ODN to recycle for another base pairing event. This results in a sustained decrease in target expression. Although the use of ODNs to down-regulate target oncogenes has long been recognized as a potentially useful treatment approach to cancer, the therapeutic application of free/naked ODNs has been limited by rapid clearance from blood circulation, lack of selectivity for target cells, low permeability through the cell membrane, and degradation by serum nucleases, of these compounds. To overcome these limitations, it has been proposed to complex ODNs to cationic polymers or liposomes.
Liposomes are self-assembling vesicles that can encapsulate hydrophilic drugs in their interior aqueous core, whereas lipophilic and amphiphilic drugs can be embedded in the lipid bilayers. Liposomes have been studied extensively as drug delivery vehicles because of their biocompatibility and ability to encapsulate drugs as well as prolong circulation time which leads to enhanced accumulation at disease sites due to the enhanced permeability and retention (EPR) effect [3]. However, the conventional bulk production of liposomes requires bulk mixing (BM) of multiple reagents, which is a heterogeneous and uncontrolled chemical and/or mechanical process resulting in liposomes that are polydispersed in size and lamellarity [4] thereby limiting their applicability in vivo. Therefore, this calls for novel techniques that by consistently producing controlled size and monodispersed liposomes and achieving high encapsulation, may improve targeted ODN delivery, resulting in more efficient down-regulation and ultimately better clinical response.
Microfluidics is a technology for manipulation of liquid flows at the micrometer and picoliter scale. Due to the small channel dimensions and typically low volumetric flow rates, microfluidic devices generally operate at a Reynolds number that is less than 1 so that the flow is strictly laminar [5]. This allows well-defined mixing to be controlled solely by interfacial diffusion when multiple flow streams are injected into a single microchannel. Recently, microfluidic (MF) devices with hydrodynamic focusing were applied for liposome self-assembly [4,6] and complexation of DNA with cationic lipids [7] and dendrimers [8]. These studies showed a well-defined and diffusion-controlled compaction process [7,8]. The MF method has also been used for microdroplet formation [9–11].
In the present study, we report an MF approach to lipopolyplex nanoparticle formation that, by precisely controlling the flow conditions and mixing process of the reagents at the micrometer scale, results in more uniformly sized and structured nanoparticles that enhanced delivery of ODNs to target cancer cells compared with the conventional bulk mixing method. To test our system, we incorporated in the nanoparticle an ODN that has been shown to down-regulate Bcl-2 at the mRNA and protein levels in vitro and in vivo and has already been studied in clinic trials. Bcl-2 is an antiapoptotic protein implicated in a wide variety of cancers such as melanoma, leukemia, breast, prostate and lung carcinomas and is associated with resistance to chemotherapy [12]. Bcl-2 down-regulation is therefore a potentially valuable strategy to reverse chemoresistance, lower the apoptotic threshold in cancer cells, and improve the clinical response to chemotherapy [12]. Here, we show that lipopolyplex nanoparticles containing transferrin as targeting molecules (Tf-LP) produced by the MF method can provide better delivery into cells and improve down-regulation of Bcl-2 compared to the BM method.
2. Materials and methods
2.1. Materials
Egg phosphatidylcholine (egg PC), 3β-[N-(N′,N′-dimethylaminoethane)-carbamoyl] cholesterol (DC-Chol) and distearoyl phosphatidylethanolamine-N-[maleimide-polyethylene glycol, M.W. 2000] (Mal–PEG–DSPE) were purchased from Avanti Polar Lipids (Alabaster, AL). Methoxy–PEG2000–DSPE (PEG–DSPE) was purchased from Genzyme Corporation (Cambridge, MA). Human holotransferrin (Tf), 2-iminothiolane (Traut's reagent), protamine sulfate, and other chemicals and reagents were purchased from Sigma (St. Louis, MO). All tissue culture media and supplies and M-murine leukemia virus reverse transcriptase were purchased from Invitrogen (Carlsbad, CA). RNeasy mini kit, RNAse inhibitor, and Float-A-Lyzer were purchased from Qiagen (Valencia, CA), Promega (Madison, WI), and Spectrum Labs (Rancho Dominguez, CA), respectively. All ODNs used in this study were fully phosphorothioated. An 18-mer antisense ODN (5′-TCT CCC AGC GTG CGC CAT-3′) and its fluorescence-labeled derivative, FITC-ODN was purchased from Alpha DNA (Montreal, Quebec, Canada).
The K562 cell line, purchased from the American Type Culture Collection (ATCC) (Manassas, VA), was cultured in RPMI 1640 media supplemented with 10% heat-inactivated fetal bovine serum (FBS), 100 U/mL penicillin, 100 μg/mL streptomycin, and l-glutamine at 37 °C in a humidified atmosphere containing 5% CO2.
2.2. Design and fabrication of the microfluidic device
Plastic microfluidic devices were fabricated using a modified microfabrication protocol described elsewhere [13]. The microfluidic hydrodynamic focusing (MF) devices were designed in AutoCAD (Autodesk, San Rafael, CA) and a g-code program was generated and then transferred into a high precision computer numerically controlled (CNC) machine (Aerotech, Inc.) which was used to machine the patterns on a poly(methyl methacrylate) (PMMA) plate. The channel width and depth were 254 μm and 150 μm, respectively, and can easily be varied by using the appropriate end mill sizes. The channel lengths are given in Table 1. A 45 μm thick PMMA film was thermally laminated onto the PMMA plate to form the closed channels by passing the PMMA/film sandwich through a thermal laminator (GBC, Inc.). Prior to thermal bonding, the microchannels were gently brushed to remove any debris and the PMMA plates were sonicated in IPA/DI H2O (1:10) for 5–10 min to remove grease and then blown dry. After lamination, straight Tee polycarbonate fluidic connectors (Value Plastics, Inc.) were bonded onto the PMMA plate by applying a UV curing adhesive around the perimeter of the connectors. The connectors were aligned over the inlet/outlet openings and the adhesive was cured by exposure to UV irradiation (Novacure 2100, EFXO Corp., Quebec, Canada) for 15 s. The assembled devices were sterilized overnight under UV light in a cell culture hood prior to experimentation.
Table 1.
Flow configurations.
| Configuration | Microchannel |
||||||
|---|---|---|---|---|---|---|---|
| a | b | c | d | e | f | g | |
| Length (mm) | 17.50 | 8.00 | 17.50 | 0.25 | 25.00 | 25.00 | 10.00 |
| I | Protamine | ODN | Protamine | – | Lipids | Lipids | – |
| II | ODN | Lipids/protamine | ODN | – | Lipids/protamine | Lipids/protamine | ODN/lipids/protamine |
| Conc. (mg/mL)* | 1050.00 | 656.25/15.75+ | 1050.00 | – | 656.25/15.75+ | 656.25/15.75+ | 50.00/625.00/15.75++ |
| Flow rate (μL/min) | 5.00 | 100.00 | 5.00 | – | 50.00 | 50.00 | 210.0 |
“/”separates concentration of each component.
Parameters for flow configuration II.
Concentration of lipids and protamine.
Concentration of ODN, lipids and protamine.
2.3. Preparation of ODN-containing LPs
An ethanol dilution method [14] was modified to prepare the LPs containing ODN. For the BM method as shown in Fig. 1A, a lipid mixture (egg PC:DC-Chol:PEG–DSPE at molar ratio 68:30:2) in absolute ethanol (EtOH) was mixed with protamine sulfate in sodium citrate buffer (20 mM, pH=4) at a mass ratio and a volume ratio of lipid-to-protamine sulfate of 12.5:0.3 and 2:1, respectively, to obtain an EtOH concentration of 66.6% (v/v). ODN, dissolved in sodium citrate buffer (20 mM, pH=4) was then added into the lipid/ protamine solution followed by vortexing for 30 s to spontaneously form pre-LPs at EtOH concentration of 40% (v/v) where the weight ratio of ODN:protamine:lipids was 1:0.3:12.5. A regular benchtop ultrasonic bath was used for sonication.
Fig. 1.
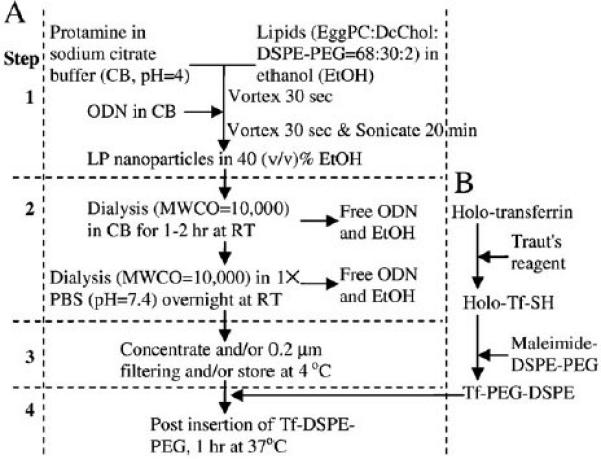
BM preparation of ODN-LP (A) and (B) transferrin conjugated PEG–DSPE (Tf– PEG–DSPE). (A) Step 1: after mixing ODN with protamine/lipids and before dialysis, 2: after dual dialysis, 3: after 0.2 μm filtering, and 4: after post insertion with Tf–PEG– DSPE. (B) Holo-transferrin is reacted with Traut's reagent to from thiolated transferrin (Holo-Tf-SH) and reacted with maleimide–DSPE–PEG to form Tf–PEG–DSPE micelles for post insertion.
For the MF method, a 5-inlet MF system was developed and used to produce the LPs as shown in Fig. 2. The MF device consists of 3 inlet ports and 1 outlet port. The inlet ports are each connected to sterile syringes containing protamine or lipids or protamine/lipids or ODN solution. Autoclaved Saint-Gobain tygon biocompatible tubing (Fisher Scientific) with an inner diameter of 1.9 cm (3/4 in) was used to connect the syringe and the connector on the MF device. At inlet port 1 or 2, a fluid stream was introduced into each port that splits into 2 side microchannel streams (microchannels a and c or e and f) while at inlet port 3, a fluid stream was introduced in the central microchannel (microchannel b). The product stream was collected at the outlet port (microchannel g). Typically, the protamine (microchannels a and c) and lipids (microchannels e and f) or protamine/lipid streams (microchannels a and c or e and f) would be injected first and then the ODN stream. After the ODN stream has entered and the hydrodynamic focusing established, the fluids were flowed through the device for 3−5 min to reach steady flow before the product was collected in sterile conical centrifuge tubes (BD Biosciences) at the outlet port (microchannel g). The magnitude of the hydrodynamic focusing was controlled by altering the Flow Rate Ratio (FRR) of the side streams to the middle stream. FRR is the ratio of the total flow rate to the middle stream flow rate. Two programmable syringe pumps (Pump 33, Harvard Apparatus, Holliston, MA) were used to control the fluid flow rates independently. For flow visualization, the MF device was mounted on an inverted microscope stage (Nikon Eclipse 2000U) with a 10× Nikon Plan Fluro objective.
Fig. 2.
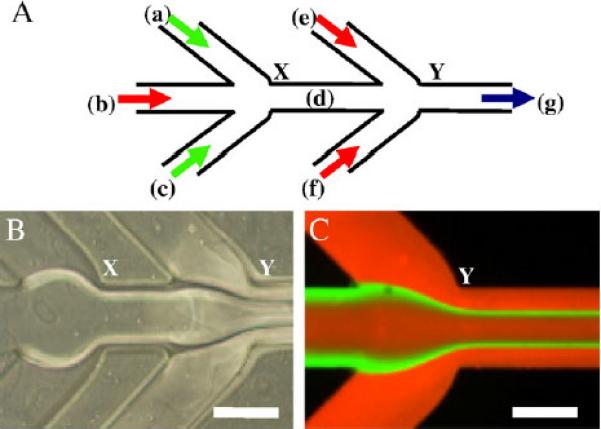
A 5-inlet MF device. (A) Schematic of the 5-inlet MF system. (B) Optical micrograph of the flow pattern at the two junctions (X and Y) of the MF system. (C) Fluorescence micrograph of flow pattern at junction Y. The volumetric flow rates used for rhodamine, fluorescein, and rhodamine were 200, 20, and 200 μL/min, respectively. Red and green color is rhodamine and fluorescein, respectively. Scale bar=250 μm.
Two 5-inlet flow configurations were tested and their conditions are listed in Table 1. Ideally, a lipopolyplex nanoparticle should have a negatively charged ODN/protamine core surrounded by positively charged lipids to form a small core/shell structure with low positive zeta potential. Based on this ideal structure, we first designed Configuration I where an ODN solution stream was introduced in the centre microchannel, b at junction X, while two protamine sulfate solution streams were introduced in the side microchannels, a and c, to hydrodynamically focus the ODN into a narrow stream to form ODN/protamine nanoparticles or “proticles” via electrostatic interactions between negatively charged ODN and positively charged protamine sulfate. Immediately downstream (~200 μm) at junction Y, another two lipids streams were introduced in the side microchannels, e and f, to further sandwich and squeeze the ODN/protamine streams to form ODN/protamine/lipids nanoparticles or lipopolyplexes (LPs). The final weight ratio of ODN:protamine:lipids was 1:0.3:12.5 and the ethanol concentration was 40%. The flow rates for ODN, protamine, and lipids streams were 20, 20, and 450 μL/min, respectively, and were controlled independently by two syringe pumps (Pump33, Harvard Apparatus, Holliston, MA). Both ODN and protamine were prepared in sodium citrate buffer (20 mM, pH=4) whereas the lipid mixture was in 100% ethanol.
As shown later, this design resulted in very large lipopolyplex nanoparticles because of the complicated particle formation mechanism explained in Figure R1 in the Supplementary Material. In bulk mixing, we also found that premixing of ODN and protamine and then adding lipids led to the formation of large lipopolyplex nanoparticles. This is probably caused by the formation of large and stable ODN/ protamine complex which cannot be separated by lipids. Premixing of protamine and lipids and then adding ODN, on the other hand, led to smaller lipopolyplex nanoparticles in bulk mixing. Our explanation is that lipids can quickly interact with protamine and ODN to prevent the formation of large ODN/protamine aggregates. Based on this observation, our next microfluidic design was a 3-inlet MF device where lipids and protamine were premixed and injected as the two side streams, a and c, while the ODN solution stream was still introduced in the central microchannel, b. However, a very high flow rate in the lipids/protamine streams was required to squeeze the ODN stream in the middle. This led to the use of a high concentration of lipids resulting in high toxicity to cells. Finally, we designed Con-figuration II where a protamine/lipid mixture stream was introduced in the central microchannel, b at junction X and sandwiched by two ODN side streams, a and c. Immediately downstream (~200 μm) at junction Y, another two protamine/lipid streams, e and f, were introduced to further sandwich and squeeze the ODN/protamine/lipid streams. Again, the final weight ratio of ODN:protamine:lipids was 1:0.3:12.5 and the ethanol concentration was 40%. The flow rates for protamine/lipids, ODN, and protamine/lipid streams were 200, 20, and 200 μL/min, respectively, and were controlled independently by two syringe pumps (Pump33, Harvard Apparatus, Holliston, MA). This 5-inlet design turns out to be the best choice because it allows the use of lower lipid concentration and can sandwich and provide high focusing on the ODN solution stream.
In all cases, the ODN concentration in buffer and the lipid concentration in ethanol were so chosen that the final ethanol to buffer ratio is 40%. The pre-LPs produced by both methods were vortexed for 30 s and then sonicated in a benchtop ultrasonic bath for 20 min followed by dialyzing against sodium citrate buffer (20 mM, pH=4) for 1–2 h and then 1× PBS (pH=7.4) overnight at room temperature, using a SpectraPor Float-A-Lyzer MWCO 10,000Da to raise the pH to neutral in order to remove unbound ODN, reduce ethanol, and to partially neutralize the cationic DC-Chol.
For visualization of LPs and Tf-LPs, FITC-labeled ODN (G4243) was used in the preparation of the LPs. After dialysis, the LPs were sterilized by filtering through a 0.2 μm PVDF filter and stored at 4 °C until further use. The MF device was mounted on an inverted microscope to visualize the flow pattern (Fig. 2B). To enhance flow visualization, fluorescein and rhodamine were introduced into the microdevice at various flow rates. Fig. 2C shows a typical fluorescence micrograph of flow pattern where the volumetric flow rates used for rhodamine, fluorescein, and rhodamine were 200, 20, and 200 μL/min, respectively.
Transferrin was used as a targeting molecule. It was conjugated to PEG–DSPE using a modified method as previously described [15]. Briefly, holo(diferric)-transferrin (holo-Tf) in 1× phosphate-buffered saline (PBS, pH=8) was reacted with 5× Traut's reagent to yield thiolated Tf (holo-Tf-SH). Free Traut's reagent was removed through a D-Salt Dextran Desalting Column (Pierce, Rockford, IL) with 1× phosphate-buffered saline (PBS, pH=6.5) using a protein assay (Bio-Rad) to detect Tf in the elution. Holo-Tf-SH was then reacted with micelles of Mal–PEG–DSPE at a protein-to-lipid molar ratio of 1:10 for 2 h at room temperature in 1× PBS (pH=6.5) and dialyzed using a SpectraPor Float-A-Lyzer [16] MWCO 5000Da (Spectrum Labs, Rancho Dominguez, CA) against 1× PBS (pH=7.4) to form Tf–PEG– DSPE. This process is shown in Fig. 1B.
A post-insertion method [15,17] was adopted to incorporate Tf ligand into ODN-loaded LPs. ODN-loaded LPs were incubated with Tf– PEG–DSPE for 1 hr at 37 °C at a Tf–PEG–DSPE-to-LP lipid ratio of 1:100 (1 mol% based on DSPE–PEG) to form Tf-LPs according to Chiu et al. [15]. This condition was able to add sufficient Tf ligand onto LPs to achieve good gene transfection.
2.4. LP characterization
The particle size and zeta potential (ζ) of non-targeted and targeted LPs were analyzed using a dynamic light scattering goniometer (BI-200SM) and a zeta potential analyzer (ZetaPALS, Brookhaven Instruments Corp., Holtsville, NY), respectively. The effective/mean diameters and polydispersities were obtained from log-normal fitting of data. Each data represents mean±standard deviation of four separate experiments. To determine ODN encapsulation, ODN-LP after dialysis was diluted in 1× TE or lysed in 1% sodium dodecyl sulfate (SDS), heated at 95 °C for 5 min in a thermal cycler, cooled to room temperature, then mixed in a gel-loading solution at a ratio of 1:5 (Sigma), and loaded on 3% ReadyAgarose™ gel plus ethidium bromide (Bio-Rad Laboratories, Hercules, CA). Electrophoresis was carried out at 100 V for 45–60 min in a 1× TAE running buffer (Invitrogen). A digital image of the gel was captured under UV light using ChemiDoc XRS system (Bio-Rad). The encapsulation efficiency of ODN in the LP was calculated based on the ratio of the amount of ODN before and after SDS treatment and against a standard curve of ODN concentrations. The amount of ODN was quantified by ImageJ software (NIH Image, Bethesda, MD).
Cryogenic transmission electron microscopy (cryo-TEM) imaging was performed as previously described [18]. Briefly, samples were examined in a Philips CM120 microscope (Eindhoven, The Netherlands) operated at 120 kV, using an Oxford CT-3500 cooling holder and transfer station (Abingdon, England). LP specimens were equilibrated in the microscope below −178 °C, then examined in the low-dose imaging mode to minimize electron beam radiation damage, and recorded at a nominal underfocus of 2–4 μm to enhance phase contrast. Images were acquired digitally by a Gatan MultiScan 791 cooled charge-coupled device camera (Pleasanton, CA) using the Digital Micrograph 3.1 software package.
2.5. Transfection studies
K562 leukemia cells were plated in 6-well tissue culture plates at 106 cells/well in 1.2 mL RPMI1640 medium containing 10% FBS. An appropriate amount of Tf-LPs or one of the other formulations (0.3 mL) was added into each well, within 48 h after preparation, to yield a final ODN concentration of either 0.5 μM or 1 μM. The cells were then incubated at 37 °C in a CO2 incubator for 6 h. The cells were washed, transferred to fresh medium, incubated for another 24 to 48 h, and then analyzed for Bcl-2 mRNA level and Bcl-2 protein level by real-time RT-PCR and Western blot, respectively. All transfection experiments were performed in RPMI1640 medium containing 10% FBS.
The ODN used in this study was designed to specifically bind the first six codons of the human Bcl-2 mRNA and down-regulate Bcl-2 gene expression [19,20]. The Bcl-2 mRNA level in leukemia cells was evaluated using real-time RT-PCR as follows. Total RNA was extracted using RNeasy Mini kit (Qiagen) in accordance to the manufacturer's protocol and concentrations were measured at O.D.260 nm using a spectrophotometer (Thermo Fisher Scientific, Waltham, MA). For cDNA synthesis, 2 μg of total mRNA from each sample was mixed with 1.5 μL of 20 μM random hexamer and nuclease free water to a total volume of 17 μL and heated to 70 °C for 5 min followed by cooling on ice for at least 5 min. 12.9 μL of master mixture containing 5× reaction buffer (6 μL), 100 mM dithiothreitol (3 μL), 10 mM of each dNTP (1.5 μL), M-murine leukemia virus reverse transcriptase (1.5 μL), and RNAse inhibitor (0.9 μL) was added into each sample and the samples were then incubated in a thermal cycler (Bio-Rad Laboratories, Hercules, CA) at 42 °C for 60 min followed by 94 °C for 5 min. The resulting cDNA was amplified by real-time PCR iQ5 (Bio-Rad Laboratories, Hercules, CA). The following oligonucleotide primers designed by the Primer Express program (Applied Biosystems) were used: Bcl-2, forward and reverse primers were CCCTGTGGATGACTGAGTACCTG and CCAGCCTCCGTTATCCTGG, respectively. Each cDNA sample was used as a template in two separate PCR amplification reactions prepared in a SYBR Green (Bio-Rad) mastermix: (a) a set of primers for Bcl-2 transcripts, and (b) primers for a housekeeping gene ABL. The housekeeping gene ABL expression was used as an internal control. Bcl-2 mRNA was normalized to ABL mRNA levels.
Western blot was carried out to evaluate the Bcl-2 protein level and was performed as previously described [16]. Briefly, whole cellular lysates were prepared through harvesting the cell in 1× cell lysis buffer supplemented with protease inhibitors and phosphatase inhibitors. Anti-β-actin was purchased from Santa Cruz Biotechnology (Santa Cruz, CA), and anti-human Bcl-2 was from Dako (Carpinteria, CA). Equivalent gel loading was confirmed by probing with antibodies against β-actin. Bcl-2 protein expression levels were quantified by ImageJ software and normalized to the β-actin level from the same sample.
Cellular uptake of FITC-labeled ODN Tf-LP was evaluated by incubating 3×10⁵ cells with FITC-ODN LPs or Tf-LPs, at an ODN concentration of 0.5 μM, in RPMI1640 medium containing 10 % FBS for 6 and 24 h at 37 °C and 5% CO2 in an incubator. The cells were collected by centrifugation, washed twice with cold 1× PBS (pH=7.4), and fixed in 4% paraformaldehyde. As negative control, cells were treated with 1× PBS (pH=7.4). The uptake of FITC-ODNs was observed by fluorescence microscope and quantified by flow cytometry. All measurements were carried out in triplicate to determine the mean fluorescence intensity and the standard deviation (MFI±SD).
K562 cells (1×10⁶) were treated with different formulations, at an ODN concentration of 1 μM, in serum containing medium at 37 °C for 72 h. Cells were washed once with PBS and resuspended in PBS. Cells were then stained with Annexin V-FITC using a kit (BD Biosciences Pharmingen, San Jose, CA). Early apoptotic cells bound to Annexin VFITC but excluded propidium iodide (PI). Cells in late apoptotic stages were labeled with both Annexin V-FITC and propidium iodide. Cells stained with Annexin V-FITC and PI were detected and quantified by flow cytometry (Becton-Dickinson, Heidelberg, Germany) (Ex=488 nm, Em=530 nm) using a FITC signal detector (FL1) and a PE emission signal detector (FL2), respectively. Results were processed using the Cellquest software (Becton-Dickinson) based on a percentage of total gated cells.
Data were represented as mean±standard deviations (S.D.) and analyzed by two-tailed Student's t-test using JMP software (Cary, NC). p≤0.05 was considered statistically significant.
3. Results
3.1. LP size, zeta potential, and morphology
The average particle size, zeta potential, and morphology of LPs were measured by dynamic light scattering (DLS) goniometry, zeta potential instrument, and cryo-TEM, respectively. When protamine was first premixed with lipids and then mixed with ODN, no large aggregates were observed by DLS. Therefore, this method of preparing LPs was selected in bulk mixing.
For the first flow configuration, the nanoparticle size was 236.9± 2.5 nm (Flow Rate Ratio=24.5). Increasing the lipids stream flow rate to 600 μL/min (Flow Rate Ratio=32) resulted in only a slight decrease in the particle size to 205.0±5.6 nm. To produce smaller LPs for better gene transfection, a second flow configuration was developed and used in the remaining portion of this study. The average particle size at each step in the LP synthesis process by BM and MF methods was also measured by DLS (Table 2). Table 2 summarizes the mean particle size, polydispersity, and surface charge (or zeta potential) of the LPs. Also, in Tables R1 and R2 in the Supplementary Material, the typical particle size, polydispersity, and distribution of BM and MF prepared LPs before and after filtering are shown. The MF method produced LP nanoparticles were slightly smaller in size than the BM method in all the steps; before dialysis (step 1), after dialysis but before filtering (step 2, p<0.05), after dialysis and filtering (step 3), and after post insertion of Tf–PEG–DSPE (step 4, p<0.05). The MF produced LPs had smaller polydispersities and were not statistically different. The zeta potential values of MF produced LPs were also slightly lower than those of BM LPs. The decrease in zeta potential indicated that the Tf–DSPE–PEG was successfully incorporated into the LP nanoparticles since Tf–DSPE– PEG has a net negative charge.
Table 2.
Nanopartide characterization – DLS and zeta potential.
| Method | Step | BM |
MF |
||||
|---|---|---|---|---|---|---|---|
| MPS (nm) | PD | ζ (mV) | MPS (nm) | PD | ζ (mV) | ||
| Before dialysis | 1 | 334.2±63.6 | 0.229±0.036 | – | 282.0±24.0 | 0.191±0.044 | – |
| After dialysis | 2 | 152.7±22.1* | 0.121±0.052 | – | 114.8±12.7 | 0.120±0.063 | – |
| After filtering | 3 | 131.0±21.0 | 0.087±0.018 | 11.6±3.6 | 106.8±5.5 | 0.078±0.019 | 7.9±1.3 |
| After post insertion | 4 | 131.5±16.1* | 0.133±0.025 | 3.6±2.9 | 107.1±8.0 | 0.112±0.039 | 2.5±4.5 |
Mean±SD (n =4); MPS, PD and ζ represents mean particle size, polydispersity, and zeta potential, respectively.
p <0.05 compared to MF is indicated by symbol.
The morphology of LP cannot be easily visualized by light microscopy, atomic force microscopy (AFM), X-ray diffraction, and neutron scattering methods. Therefore, the LP morphology was characterized by cryogenic-temperature transmission electron microscopy (cryo-TEM) by imaging directly the vitrified hydrated samples with high spatial resolution in their native state. The nano-aggregates were kept in a thin film of vitreous ice during the examination [21]. The samples were vitrified within 96 h after preparation, kept in liquid nitrogen and imaged within 14 days. As shown in Fig. 3, both BM and MF samples consist of several coexisting nano-aggregates such as classic lipoplexes, vesicles, multilamellar vesicles and fused vesicles. For the BM sample (Fig. 3A), the arrowhead shows multilamellar vesicles and the white arrows show onion-like complexes, which are known as the classic lipoplex structure. Weisman et al. [18] reported onion-like structures, where the ODNs are sandwiched between two adjacent lipid bilayers. For the MF sample (Fig. 3B), white arrow shows onion-like nanostructure. The black arrow points at amorphous and optically dense aggregates are similar to those reported by Yang et al. [22].
Fig. 3.
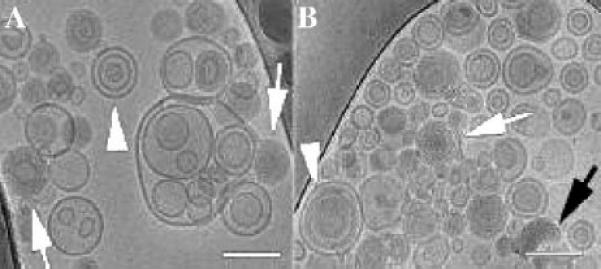
Cryo-TEM images of LP nanoparticles prepared by (A) BM and (B) MF. (A) Arrowheads show multilamellar vesicles, while arrows show onion-like complexes. (B) Onion-like aggregates (white arrow), amorphous protamine/ODN aggregate (black arrow), and multilamellar nanostructure in which protamine/ODN aggregate coats lipid bilayers (arrowhead). Scale bars represent 100 nm.
They are probably formed by prior complexion of protamine and ODNs. The arrowhead indicates multilamellar nanostructure where the layers are thicker than the multilamellar onion-like complexes. The protamine/ODN aggregates tend to attach and coat the lipid bilayers [22]. In general, BM and MF prepared LP nanoparticles have similar bilayers structures, although the aggregate size distribution might be somewhat different. Because cryo-TEM is not a quantitative method, the average LP sizes were determined by DLS measurements.
3.2. Analysis of ODN encapsulated in LPs
After LP nanoparticle production by BM and MF methods, the solutions were dialyzed twice and filtered using 0.2 μm PVDF filter. After filtering, the ODN encapsulation efficiency of BM and MF produced LPs were analyzed by gel electrophoresis and quantified by ImageJ software. Calculated from Fig. 4, ODN encapsulation efficiencies for BM and MF methods were 71.3%±3.2% and 74.8%±3.8%, respectively. This high encapsulation efficiency is typical for lipoplex prepared by the ethanol dilution method [14,15,23].
Fig. 4.
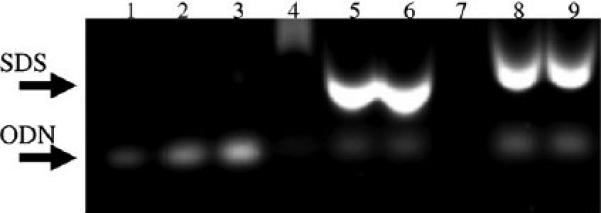
Determination of ODN encapsulation efficiency in LP nanoparticles by agarose gel electrophoresis. LPs after dialysis were lysed in 1% sodium dodecyl sulfate (SDS) at 95 °C for 5 min. Lanes 1–3. ODN; 4. BM LP without 1% SDS; 5–6. BM LP with 1% SDS; 7. MF LP without 1% SDS; 8–9. MF LP with 1% SDS.
3.3. Cellular uptake of FITC-labeled ODN analyzed with FCM
The relative uptake of LPs plays a significant role in Bcl-2 down-regulation in the K562 cells. Flow cytometry was used to analyze the uptake of targeted LPs containing FITC-labeled ODN produced by BM and MF methods (Fig. 5). By comparing samples BM Tf-LP (sample 2) and MF LP (sample 3) in Fig. 5A, we can see that MF LP has a narrow and sharp fluorescence distribution with a mean fluorescence intensity of 512±2 while BM Tf-LP has a broad distribution and a lower mean fluorescence intensity of 268±33. The merged fluorescence and phase contrast images of the samples are shown in Fig. 5B. We can see that fluorescence in the cells treated by MF LP is brighter and more uniform than those by BM Tf-LP. This indicates that more FITC-labeled ODN molecules were accumulated in the cells, which is consistent with the flow cytometry results. Therefore, the MF LP is more efficient in delivering FITC-labeled ODN into the cells than the BM Tf-LP. Fig. 5C shows the mean fluorescence intensity (MFI) of cells treated with MF Tf-LP and BM Tf-LP nanoparticles. MFI±SD is the average of 3 separate experiments and is typically used for representing flow cytometry data.
Fig. 5.
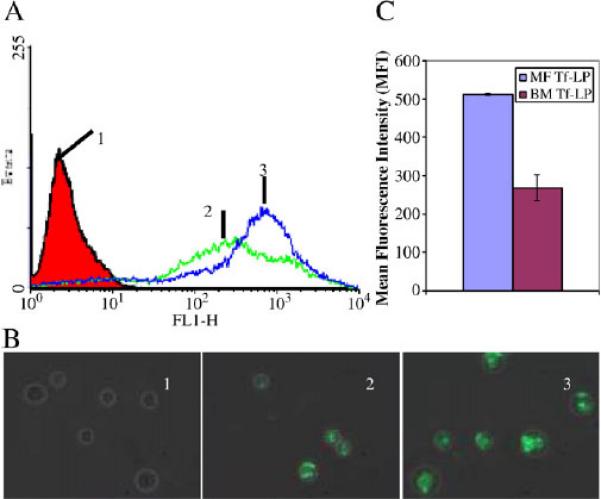
Uptake of BM and MF lipopolyplexes containing FITC-labeled ODN in K562 cells. Cells were treated with non-targeted and targeted BM and MF LP nanoparticles staining FITC-labeled ODN as analyzed by (A) flow cytometry and (B) fluorescence microscopy at 400× magnification. 1 is untreated cell control, 2 is cells treated with targeted BM Tf-LP, and 3 is cells treated with targeted MF Tf-LP. (C) Mean fluorescence intensity of cells treated with MF Tf-LP and BM Tf-LP nanoparticles. Cells were treated for 24 h. The ODN concentration used was 0.5 μM at a cell density of 3×10⁵. (n=3).
3.4. In vitro Bcl-2 down-regulation
The effect of ODN encapsulated in the BM and MF LPs on down-regulation of Bcl-2 at both protein and mRNA levels in K562 cells was then evaluated by real-time RT-PCR and Western blot, respectively. K562 cells were treated with free ODN, Tf conjugated ODN-containing liposomes produced by BM (BM Tf-LP), non-targeted ODN-containing liposomes produced by MF (MF LP), and Tf conjugated ODN-containing liposomes produced by MF (MF Tf-LP). From Fig. 6 where the cells were treated with 1 μM ODN, the analysis revealed that Bcl-2 protein and mRNA levels in 24 and 48 h after transfection were decreased. The MF Tf-LP down-regulated Bcl-2 more efficiently than free ODN, non-targeted MF LP, and BM Tf-LP. In addition, the Bcl-2 down-regulation by non-targeted MF LP containing only 0.5 μM ODN was comparable to free ODN (1 μM), indicating that LP could deliver ODN more efficiently into the cells even without Tf targeting. The effect of ODN concentration in the Tf conjugated BM and MF LPs on down-regulation of Bcl-2 protein level was also evaluated (Fig. 7) and the results showed that better down-regulation was achieved at a higher amount of ODN in the LPs.
Fig. 6.
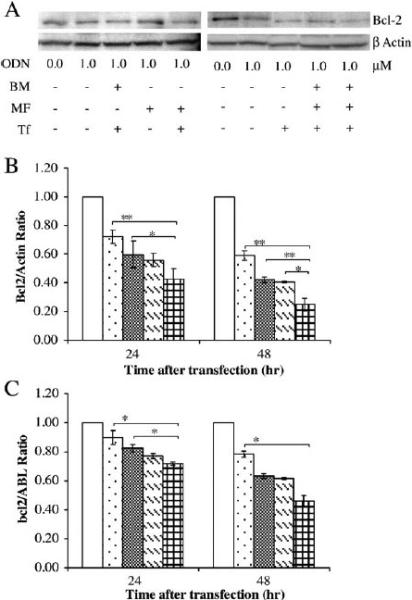
Effect of Bcl-2 down-regulation by ODN. K562 cells were treated with free ODN, BM Tf-LP, MF LP and MF Tf-LP. ODN concentration was 1 μM in all groups except for the untreated group. A representative Western blot of Bcl-2 protein expression (A), its corresponding densitometry data (B), and results of real-time RT-PCR analysis (C) at 24 and 48 h following treatment are shown. p<0.05 and p<0.01 indicated by * and ** symbols, respectively, as compared to MF Tf-LP sample (n=3). □ Untreated control;  Free ODN;
  BM Tf-LP, 1.0 μM ODN;
  MF LP, 1.0 μM ODN; and
  MF Tf-LP, 1.0 μM ODN.
Fig. 7.
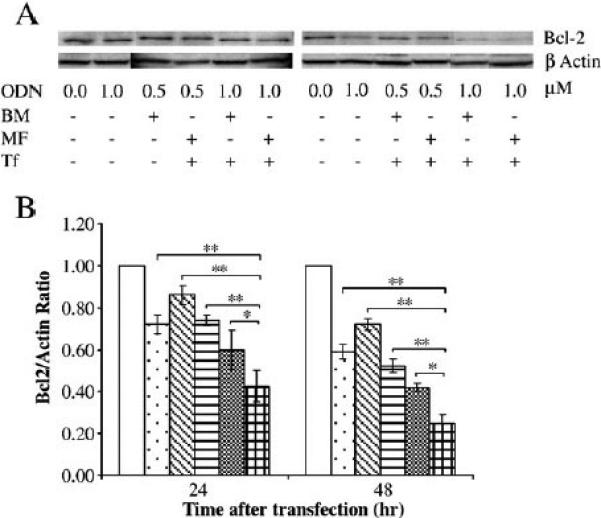
Effect of ODN concentration on Bcl-2 down-regulation. A representative Western blot of Bcl-2 protein expression (A) and its corresponding densitometry data (B) at 24 and 48 h following treatment with free ODN and ODN-containing formulations are shown. K562 cells were treated with BM Tf-LP and MF Tf-LP at ODN concentration of either 0.5 μM or 1.0 μM. p<0.05 and p<0.01 indicated by * and ** symbols, respectively, as compared to MF Tf-LP sample (n=3). For free ODN, 1.0 μM was used. □ Untreated control;  Free ODN, 1.0 μM ODN;
  BM Tf-LP, 0.5 μM ODN;
  MF Tf-LP, 0.5 μM ODN;
  BM Tf-LP, 1.0 μM ODN; and
  MF Tf-LP, 1.0 μM ODN.
3.5. Induction of apoptosis by ODN analyzed with FCM
For normal cells, phosphatidylserine (PS) is located in the inner leaflet of the cell membrane. However, when cells are in the early phase of apoptosis, PS translocates to the exterior of the cell membrane and can be recognized by Annexin V-FITC staining. The cells were simultaneously stained with viability dye propidium iodide (PI) where viable cells would exclude both the PI and the AV-FITC from the interior of the cell. In this analysis, the cell debris was excluded by gating the region believed to be containing cells in the Forward versus Side Scatter dot plot. At 24 h post transfection, the percentage of untreated control, free G3139, BM Tf-LP, MF LP, and MF Tf-LP treated cells undergoing apoptosis were 6.0, 6.8, 13.4, 12.5, and 19.5%, respectively. While at 48 h post transfection the percentage of cells undergoing apoptosis were 18.1, 25.5, 9.7, 6.0, and 7.0%, respectively.
4. Discussion
We have designed and fabricated a 5-inlet polymeric microfluidic hydrodynamic focusing (MF) system for producing lipid-polymer-DNA nanoparticles (lipopolyplex or LP) of smaller size, narrower size distribution and possibly more uniform structure. The MF system can precisely control the flow conditions and mixing process of reagents at the micrometer scale by using syringe pumps to independently control the flow rate of the fluid streams. Since the Reynolds number in the microchannel is typically less than 1, the flow is strictly laminar which allows well-defined mixing to be controlled solely by interfacial diffusion between the multiple flow streams in a single microchannel. In contrast, current BM is a heterogeneous and uncontrolled chemical and/or mechanical process which can result in a heterogeneous population of LPs. In addition, an important distinction between our system and the others [4,6,7] is that lipopolyplex (LP) nanoparticles, i.e. liposomes containing DNA, are assembled in a microfluidic device specifically for delivery into cancer cells. Further, our device is made of poly(methyl methacrylate) (PMMA) which is low-cost, easy to mass produce, and disposable for point-of-care applications. To the best of our knowledge, this is the first report on the transfection efficiency of microfluidic hydrodynamic focusing assembled lipopolyplex ODN for cancer cell targeting and protein down-regulation.
There are several factors that govern the successful application of LPs in vitro and in vivo including particle size and size distribution, surface charge or zeta potential, ODN encapsulation efficiency, particle structure, and colloidal stability. In this study, the lipids used in the formulation included DC-Chol, egg PC, and PEG–DSPE. DCChol is a cationic lipid with a tertiary amine headgroup. This allows for assembly of LPs at pH=4, where DC-Chol is fully ionized, and reduction of positive charge of the LPs upon returning the pH to 7.4, where DC-Chol is partially deprotonated. A similar strategy has been previously established with DODAP, another cationic lipid with a tertiary amine headgroup in synthesis of SALP [14]. The amount of cationic lipid (DC-Chol) was kept relatively low to produce a zeta potential close to zero. PEG–DSPE was added to the bilayer to reduce plasma protein binding and to provide enhanced particle colloidal stability. Protamine was also incorporated to stabilize the ODN in serum and increases delivery efficiency.
For targeting, transferrin (Tf) was conjugated with DSPE–PEG into Tf–DSPE–PEG micelles which was then post-inserted into the LPs to obtain Tf-LPs. Tf is an iron transport protein that, when associated with ferric ion binds with high affinity to transferrin receptor (TfR), is overexpressed frequently on leukemia cells [24]. Transferrin receptor (TfR) targeted lipoplexes have been shown to improve the delivery of ODN to human erythroleukemia K562 cells, which over-express TfR [15]. Both the non-targeted and transferrin-receptor targeted nano-particles carrying ODN produced by BM (BM Tf-LP) and MF (MF Tf-LP) were applied to the K562 leukemia cells to evaluate efficacy of Bcl-2 down-regulation. Bcl-2 is an antiapoptotic protein associated with resistance to chemotherapy and frequently overexpressed in numerous tumors. Antisense-mediated Bcl-2 down-regulation has been shown to reverse chemoresistance and better delivery strategies always play a pivotal role in successful knockdown of Bcl-2 protein.
We have characterized particle size, size distribution and zeta potential of the nanoparticles prepared by the MF and BM methods. For the first flow configuration, the protamine binds to the ODN via electrostatic interactions between negatively charged ODN and positively charged protamine to form a compact ODN/protamine nanoparticles or “proticles” with a solid core. The lipids streams which were introduced sequentially would then sandwich the proticles. Since the proticles are negatively charge (−29.8 mV) at an ODN/protamine ratio of 1/0.3 (wt/wt), their sizes are dominated by their solid cores. In fact, increasing the flow rate of the lipids stream did not significantly decrease the size of the proticles even though a higher Flow Rate Ratio results in a narrower ODN/protamine streams width, i.e. a shorter diffusion length. Proticles have a size range of 100– 300 nm when mixed in DI water [25,26], however, when mixed in sodium citrate buffer, proticles tend to aggregate almost instantly. Therefore, protamine was premixed with lipids before addition of the ODN solution for subsequent experiments in the second flow configuration.
For the second flow configuration, the MF LP nanoparticles were slightly smaller in size and slightly narrower in size distribution than the BM particles in all the processing steps as shown in Table 2. The surface charge (zeta potential) of the nanoparticles can influence the stability and cellular uptake of the nanoparticles. The zeta potential of the MF LP nanoparticles was slightly lower than that of the BM particles. Since the particle size between the MF and BM LPs is statistically significant but small, we believe the structural uniformity may be a more important factor to determine the performance of LP nanoparticles.
Both BM and MF LPs consist of diverse morphologies such as multilamellar vesicles, onion-like complexes, amorphous protamine/ ODN aggregates and multilamellar nanostructure in which protamine/ODN aggregate coats lipid bilayers as shown in Fig. 3. In general, BM and MF prepared LP nanoparticles have similar bilayers structures. However, MF LP nanoparticles may have more multi-lamellar vesicles and onion-like complexes and less large aggregates than BM LP nanoparticles because the lipid solution and the ODN (or polyplex) solution are brought in contact with each other under a much better controlled microenvironment. Since cryo-TEM cannot provide any quantitative comparison and other analytical techniques such as X-ray and neutron scattering are even less sensitive, this explanation needs be verified by more in-depth analysis in the future.
For targeting, transferrin (Tf) was used and incorporated into Tf– DSPE–PEG micelles for post insertion. Transferrin receptor (TfR) targeted lipopolyplexes (LPs) have been shown to improve the delivery of ODN to human erythroleukemia K562 cells, which over-express TfR [15]. In this study, both the non-targeted and transferrin-receptor targeted nanoparticles carrying ODN, i.e. LP and Tf-LP, respectively, produced by BM and MF were applied to K562 leukemia cells. The uptake of FITC-labeled ODN by K562 cells analyzed using flow cytometry (Fig. 5) showed that more MF Tf-LPs were uptaken as indicated by the higher and narrower fluorescence signal as compared to BM Tf-LPs. As shown in Figs. 6 and 7, MF Tf-LP nanoparticles were more effective than BM Tf-LP nanoparticles in Bcl-2 down-regulation. Greater down-regulation was observed in 48 h than in 24 h for both BM and MF LP nanoparticles.
Apoptosis is the programmed cell death in the cell's life cycle. ODN has been shown to enhance apoptosis when encapsulated in liposomes. In this study, we found that MF LP and MF Tf-LP treated cells had higher percentage of cells undergoing late stages apoptosis than BM Tf-LP treated cells. Therefore, the different methods of preparing the LPs do influence apoptosis.
In conclusion, we have successfully developed a novel 5-inlet MF system and produced LP nanoparticles with smaller size, narrower size distribution, lower zeta potential, and possibly more uniform structure than those produced by the conventional BM method. Consequently, the MF ODN Tf-LP nanoparticles exerted greater down-regulation effect on Bcl-2 in K562 cells. This technology can be extended to condense other antisense oligonucleotides (AS ONs), small interfering RNA (siRNA) and micro-RNA (miRNA) to overcome the challenge of limited transfection efficiency faced by “naked delivery” used in current clinical trials.
Supplementary Material
Acknowledgements
We thank Le-Nguyen Huynh and Jiuxia Pang for helpful discussion on real-time RT-PCR and Western blots. We are grateful to NSF NSECCANPBD (Award No. EEC-0425626) and NIH for financial support (R01: CA135243 and R21: 131832).
Footnotes
Appendix A. Supplementary data
Supplementary data associated with this article can be found, in the online version, at doi:10.1016/j.jconrel.2009.08.019.
References
- 1.Gewirtz AM. Antisense oligonucleotide therapeutics for human leukemia. Curr. Opin. Hematol. 1998;5:59–71. doi: 10.1097/00062752-199801000-00011. [DOI] [PubMed] [Google Scholar]
- 2.Iversen P. In vivo studies with phosphorothioate oligonucleotides. Pharmacokinet. Prologue. 1991;6(6):531–538. [PubMed] [Google Scholar]
- 3.Seymour LW. Passive tumor targeting of soluble macromolecules and drug conjugates. Crit. Rev. Ther. Drug Carr. Syst. 1992;9(2):135–187. [PubMed] [Google Scholar]
- 4.Jahn A, Vreeland WN, DeVoe DL, Locascio LE, Gaitan M. Microfluidic directed formation of liposomes of controlled size. Langmuir. 2007;23(11):6289–6293. doi: 10.1021/la070051a. [DOI] [PubMed] [Google Scholar]
- 5.Stone HA, Stroock AD, Ajdari A. Engineering flows in small devices: microfluidics toward a lab-on-a-chip. Annu. Rev. Fluid Mech. 2004;36:381–411. [Google Scholar]
- 6.Jahn A, Vreeland WN, Gaitan M, Locascio LE. Controlled vesicle self-assembly in microfluidic channels with hydrodynamic focusing. J. Am. Chem. Soc. 2004;126(9):2674–2675. doi: 10.1021/ja0318030. [DOI] [PubMed] [Google Scholar]
- 7.Otten A, Koster S, Struth B, Snigirev A, Pfohl T. Microfluidics of soft matter investigated by small-angle X-ray scattering. J. Synchrotron Radiat. 2005;12:745–750. doi: 10.1107/S0909049505013580. [DOI] [PubMed] [Google Scholar]
- 8.Dootz R, Otten A, Koster S, Struth B, Pfohl T. Evolution of DNA compaction in microchannels. J. Phys.-Condes. Matter. 2006;18(18):S639–S652. [Google Scholar]
- 9.Thorsen T, Roberts RW, Arnold FH, Quake SR. Dynamic pattern formation in a vesicle-generating microfluidic device. Phys. Rev. Lett. 2001;86(18):4163–4166. doi: 10.1103/PhysRevLett.86.4163. [DOI] [PubMed] [Google Scholar]
- 10.Anna SL, Bontoux N, Stone HA. Formation of dispersions using “flow focusing” in microchannels. Appl. Phys. Lett. 2003;82(3):364–366. [Google Scholar]
- 11.Link DR, Anna SL, Weitz DA, Stone HA. Geometrically mediated breakup of drops in microfluidic devices. Phys. Rev. Lett. J1 - PRL. 2004;92(5):054503. doi: 10.1103/PhysRevLett.92.054503. [DOI] [PubMed] [Google Scholar]
- 12.Dias N, Stein CA. Potential roles of antisense oligonucleotides in cancer therapy. The example of Bcl-2 antisense oligonucleotides. Eur. J. Pharm. Biopharm. 2002;54(3):263–269. doi: 10.1016/s0939-6411(02)00060-7. [DOI] [PubMed] [Google Scholar]
- 13.Koh CG, Tan W, Zhao MQ, Ricco AJ, Fan ZH. Integrating polymerase chain reaction, valving, and electrophoresis in a plastic device for bacterial detection. Anal. Chem. 2003;75(17):4591–4598. doi: 10.1021/ac0343836. [DOI] [PubMed] [Google Scholar]
- 14.Jeffs LB, Palmer LR, Ambegia EG, Giesbrecht C, Ewanick S, MacLachlan I. A scalable, extrusion-free method for efficient liposomal encapsulation of plasmid DNA. Pharm. Res. 2005;22(3):362–372. doi: 10.1007/s11095-004-1873-z. [DOI] [PubMed] [Google Scholar]
- 15.Chiu SJ, Liu SJ, Perrotti D, Marcucci G, Lee RJ. Efficient delivery of a Bcl-2-specific antisense oligodeoxyribonucleotide (G3139) via transferrin receptor-targeted liposomes. J. Control. Release. 2006;112(2):199–207. doi: 10.1016/j.jconrel.2006.02.011. [DOI] [PubMed] [Google Scholar]
- 16.Liu SJ, Liu ZF, Xie ZL, Pang JX, Yu JH, Lehmann E, Huynh L, Vukosavljevic T, Takeki M, Klisovic RB, Baiocchi RA, Blum W, Porcu P, Garzon R, Byrd JC, Perrotti D, Caligiuri MA, Chan KK, Wu L-C, Marcucci G. Bortezomib induces DNA hypomethylation and silenced gene transcription by interfering with Sp1/NF-{kappa}B-dependent DNA methyltransferase activity in acute myeloid leukemia. Blood. 2008;111(4):2364–2373. doi: 10.1182/blood-2007-08-110171. [DOI] [PMC free article] [PubMed] [Google Scholar]
- 17.Xu LA, Pirollo KF, Tang WH, Rait A, Chang EH. Transferrin-liposome-mediated systemic p53 gene therapy in combination with radiation results in regression of human head and neck cancer xenografts. Hum. Gene Ther. 1999;10(18):2941–2952. doi: 10.1089/10430349950016357. [DOI] [PubMed] [Google Scholar]
- 18.Weisman S, Hirsch-Lerner D, Barenholz Y, Talmon Y. Nanostructure of cationic lipid-oligonucleotide complexes. Biophys. J. 2004;87(1):609–614. doi: 10.1529/biophysj.103.033480. [DOI] [PMC free article] [PubMed] [Google Scholar]
- 19.Webb A, Cunningham D, Cotter F, Clarke PA, diStefano F, Ross P, Corbo M, Dziewanowska Z. BCL-2 antisense therapy in patients with non-Hodgkin lymphoma. Lancet. 1997;349(9059):1137–1141. doi: 10.1016/s0140-6736(96)11103-x. [DOI] [PubMed] [Google Scholar]
- 20.Banerjee D. Technology evaluation: G-3139. Curr. Opin. Mol. Ther. 1999;1(3):404–408. [PubMed] [Google Scholar]
- 21.Putaux JL, Buléon A, Borsali R, Chanzy H. Ultrastructural aspects of phytoglycogen from cryo-transmission electron microscopy and quasi-elastic light scattering data. Int. J. Biol. Macromol. 1999;26(2–3):145–150. doi: 10.1016/s0141-8130(99)00076-8. [DOI] [PubMed] [Google Scholar]
- 22.Yang XJ, Koh CG, Liu SJ, Pan XG, Santhanam R, Yu B, Peng Y, Pang JX, Golan S, Talmon Y, Jin Y, Muthusamy N, Byrd JC, Chan K, Lee LJ, Marcucci G, Lee RJ. Transferrin Receptor-Targeted Lipid Nanoparticles for Delivery of an Antisense Oligodeoxyribonucleotide Against Bcl-2. Mol. Pharmacol. 2009;6(1):221–230. doi: 10.1021/mp800149s. [DOI] [PMC free article] [PubMed] [Google Scholar]
- 23.Maurer N, Wong KF, Stark H, Louie L, McIntosh D, Wong T, Scherrer P, Semple SC, Cullis PR. Spontaneous entrapment of polynucleotides upon electrostatic interaction with ethanol-destabilized cationic liposomes. Biophys. J. 2001;80(5):2310–2326. doi: 10.1016/S0006-3495(01)76202-9. [DOI] [PMC free article] [PubMed] [Google Scholar]
- 24.Sato Y, Yamauchi N, Takahashi M, Sasaki K, Fukaura J, Neda H, Fujii S, Hirayama M, Itoh Y, Koshita Y, Kogawa K, Kato J, Sakamaki S, Niitsu Y. In vivo gene delivery to tumor cells by transferrin–streptavidin–DNA conjugate. FASEB J. 2000;14(13):2108–2118. doi: 10.1096/fj.99-1052com. [DOI] [PubMed] [Google Scholar]
- 25.Junghans M, Kreuter J, Zimmer A. Antisense delivery using protamineoligonucleotide particles. Nucleic Acids Res. 2000;28(10):e45. doi: 10.1093/nar/28.10.e45. [DOI] [PMC free article] [PubMed] [Google Scholar]
- 26.Kerkmann M, Lochmann D, Weyermann J, Marschner A, Poeck H, Wagner M, Battiany J, Zimmer A, Endres S, Hartmann G. Immunostimulatory properties of CpG-oligonucleotides are enhanced by the use of protamine. Nanoparticles. 2006;16:313–322. doi: 10.1089/oli.2006.16.313. [DOI] [PubMed] [Google Scholar]
Associated Data
This section collects any data citations, data availability statements, or supplementary materials included in this article.