

Abstract
Purpose:
Perfluorocarbon (PFC) microdroplets, called phase-change contrast agents (PCCAs), are a promising tool in ultrasound imaging and therapy. Interest in PCCAs is motivated by the fact that they can be triggered to transition from the liquid state to the gas state by an externally applied acoustic pulse. This property opens up new approaches to applications in ultrasound medicine. Insight into the physics of vaporization of PFC droplets is vital for effective use of PCCAs and for anticipating bioeffects. PCCAs composed of volatile PFCs (with low boiling point) exhibit complex dynamic behavior: after vaporization by a short acoustic pulse, a PFC droplet turns into a vapor bubble which undergoes overexpansion and damped radial oscillation until settling to a final diameter. This behavior has not been well described theoretically so far. The purpose of our study is to develop an improved theoretical model that describes the vaporization dynamics of volatile PFC droplets and to validate this model by comparison with in vitro experimental data.
Methods:
The derivation of the model is based on applying the mathematical methods of fluid dynamics and thermodynamics to the process of the acoustic vaporization of PFC droplets. The used approach corrects shortcomings of the existing models. The validation of the model is carried out by comparing simulated results with in vitro experimental data acquired by ultrahigh speed video microscopy for octafluoropropane (OFP) and decafluorobutane (DFB) microdroplets of different sizes.
Results:
The developed theory allows one to simulate the growth of a vapor bubble inside a PFC droplet until the liquid PFC is completely converted into vapor, and the subsequent overexpansion and damped oscillations of the vapor bubble, including the influence of an externally applied acoustic pulse. To evaluate quantitatively the difference between simulated and experimental results, the L2-norm errors were calculated for all cases where the simulated and experimental results are compared. These errors were found to be in the ranges of 0.043–0.067 and 0.037–0.088 for OFP and DFB droplets, respectively. These values allow one to consider agreement between the simulated and experimental results as good. This agreement is attained by varying only 2 of 16 model parameters which describe the material properties of gaseous and liquid PFCs and the liquid surrounding the PFC droplet. The fitting parameters are the viscosity and the surface tension of the surrounding liquid. All other model parameters are kept invariable.
Conclusions:
The good agreement between the theoretical and experimental results suggests that the developed model is able to correctly describe the key physical processes underlying the vaporization dynamics of volatile PFC droplets. The necessity of varying the parameters of the surrounding liquid for fitting the experimental curves can be explained by the fact that the parts of the initial phospholipid shell of PFC droplets remain on the surface of vapor bubbles at the oscillatory stage and their presence affects the bubble dynamics.
Keywords: ultrasound imaging, ultrasound contrast agent, acoustic droplet vaporization, perfluorocarbon, theoretical model
1. INTRODUCTION
Conventional ultrasound contrast agents consist of encapsulated micrometer-scale bubbles (or microbubbles) that interact with an acoustic wave propagating in tissue. The unique nonlinear cavitation properties of microbubbles in response to an acoustic pulse have led to methods of contrast-specific imaging1,2 and have enabled new approaches to ultrasound-mediated therapy.3–6 Although microbubbles have proven successful as diagnostic and therapeutic agents, the encapsulating shells and size distributions that are designed to maximize scattering and resonance activity within the ultrasound beam inherently restrict agents to intravascular passage and relatively short circulation time.7 These properties limit success in applications where longer circulation times and small size are essential, such as particle deposition in solid tumors. Researchers have increasingly investigated phase-change perfluorocarbon (PFC) droplets in order to overcome these limitations.8–11 These phase-change contrast agents (PCCAs) can be activated by a reduction in pressure and/or an increase in heat delivered from an ultrasound transducer (or, alternatively, from a laser light source12,13), causing a transition from the liquid state to the gas state.8 Due to the drastic difference in particle size, density, and compressibility between the two states, PCCAs have been proposed as a solution to many emerging problems in medical ultrasound.8–11
Most studies have explored superheated microscale and nanoscale PCCAs formed from dodecafluoropentane (DDFP, C5F12), which remain in the liquid state upon exposure to physiologic temperatures by a combination of Laplace pressure and boiling delay until vaporized by an ultrasonic pulse.8,11,14 Understanding the underlying physics of vaporization and bubble expansion is vital to the development of PCCAs that are ideal for specific applications—not only in predicting basic properties (such as expansion rates and final particle size) but also in anticipating potential biological effects caused by interaction between the resulting bubbles and the ultrasound vaporization pulse. Experimental studies have shown that microscale droplets of DDFP evolve in a monotonic fashion over the course of a few microseconds to hundreds of microseconds following the vaporization pulse, depending on encapsulation.15–19
The first theoretical investigations into the behavior of a bubble produced by acoustic vaporization of a PFC droplet were conducted by Ye and Bull.20,21 They performed direct numerical simulations of bubble expansion inside rigid20 and flexible21 tubes, implying gas embolotherapy techniques where PCCAs are used for occluding blood flow to tumors. The aim of their work was to estimate shear stresses induced by the expanding bubbles on the walls of blood vessels.
An analytical approach has been first applied by Qamar et al.22,23 They derived a Rayleigh–Plesset like equation describing bubble evolution inside a superheated PFC droplet located at the center of a rigid tube. Numerical simulations performed by the use of this model showed good agreement with the experimental results obtained by Wong et al.15 for DDFP droplets. Interestingly, the simulations by Qamar et al. suggested that under certain conditions, droplet evolution may follow a pattern of overexpansion and oscillatory settling to a final diameter although no published experimental results with microscale or nanoscale DDFP droplets have exhibited this behavior to date. A drawback of the model of Qamar et al. is that it is based on the assumption that the evaporation rate is constant over the entire process of vaporization, which is a strong simplification, especially when the ambient pressure is changed in response to an imposed acoustic pulse. Moreover, our calculations show (see Sec. 2) that there are discrepancies in the resulting equations of Qamar et al., and these equations do not provide expected limiting cases.
More recently, Shpak et al.18 have proposed a simple model to describe the growth of a vapor bubble inside a perfluoropentane (PFP) droplet. Their model is based on the assumption that the vapor temperature inside the bubble is constant and equal to the saturation temperature for PFP (29 °C at atmospheric pressure), and the bubble growth is governed by heat transfer from the surrounding liquid which has a higher temperature than that inside the bubble. To calculate the heat transfer, Shpak et al. used a well-known approximation that assumes that the temperature gradient exists only within a thin (relative to the bubble radius) thermal boundary layer whose thickness increases proportionally to the square root of time.24,25 To take into account the influence of ultrasound, they also included an effect called rectified heat transfer.26 In another paper, also dedicated to PFP droplets, Shpak et al.19 modeled the growth of a vapor bubble by numerically solving the Keller–Miksis equation27 in combination with the standard partial differential equations describing the temperature field in the surrounding liquid, the heat transfer between the bubble and the liquid, and the gas diffusion through the bubble surface.28 As far as the thermal processes are concerned, their model reproduces the approach used by Hao and Prosperetti for vapor bubbles in ordinary liquids.29 Both models of Shpak et al. assume that a vapor bubble is in an infinite medium of liquid PFP. Therefore, such effects as the complete conversion of the droplet into the bubble and the subsequent overexpansion and damped oscillations of the bubble are beyond the scope of these models.
Finally, mention may be made of a model developed by Pitt et al.30 In contrast to the models described above, the model of Pitt et al. considers a situation where a vapor bubble is formed around a PFC droplet immersed in water, i.e., the bubble arises as a spherical vapor layer between the droplet surface and water and is a mixture of PFC and water vapor. We will not dwell on this model because this case is beyond the scope of our study.
Recent studies have shown that it is possible to develop PCCAs from volatile perfluorocarbons, such as decafluorobutane (DFB, C4F10) and octafluoropropane (OFP, C3F8), that remain metastable at physiologic temperatures and can be vaporized with less ultrasound energy than similarly sized droplets of DDFP.31–33 Though use of much more volatile compounds reduces general particle stability, perfluorocarbon mixing can be used to arrive at an ideal balance of ultrasonic vaporization thresholds and emulsion stability.33–35 In high-speed video microscopy experiments evaluating vaporization thresholds,36 it was noted that when relatively short pulses were used to vaporize PCCAs, the droplet-to-bubble transition occurred in a much more complex manner than observed in other studies with droplets based on DDFP. Microdroplets of OFP and DFB produced a characteristic overexpansion and oscillation to a final diameter not explained by the monotonic expansion expected from previous models (although similar to the simulations by Qamar et al.22). The experimentally observed bubble oscillation matched expected unforced damped resonance frequency relationships and was shown to be acoustically detectable.37
The purpose of our study is (i) to develop an improved theoretical model free from limitations of the existing models and (ii) to validate this model by comparison with in vitro experimental data. In particular, our approach does not use the simplifications that the evaporation rate is constant, as in the model of Qamar et al.,22 and that the droplet size is infinite, as in the models of Shpak et al.18,19 The development of our model is specifically aimed at exploring the complex vaporization behavior which is demonstrated by volatile PFC droplets experimentally but has not been well described theoretically so far. Our model describes the growth of a vapor bubble inside a PFC droplet until the liquid PFC is completely converted into vapor, and the subsequent overexpansion and damped oscillations of the vapor bubble, including the influence of an externally applied acoustic pulse. The validation of the model is carried out by directly comparing theoretical results with experimental data acquired by ultrahigh speed video microscopy for OFP and DFB microdroplets of different sizes.
2. METHODS
2.A. Derivation of model
The derivation of the model is based on applying the mathematical methods of fluid dynamics and thermodynamics to the process of the acoustic vaporization of PFC droplets.
The geometry of the model is shown in Fig. 1. It is assumed that a spherical vapor bubble with radius R1(t) is located at the center of a spherical PFC droplet with radius R2(t), which is surrounded by an unbounded liquid. The inside of the vapor bubble will be designated as medium 1, the PFC droplet as medium 2, and the liquid surrounding the PFC droplet (host liquid) as medium 3. Our purpose is to derive an equation that describes the evolution of the bubble radius. To do this, it is first necessary to obtain equations that describe the motion of media 2 and 3. We assume that these media are incompressible viscous liquids which obey the equation of continuity and the Navier–Stokes equation,38
| (1) |
| (2) |
where i = 2 or 3 and vi, pi, ρi, and ηi are the velocity, the pressure, the density, and the dynamic viscosity of the ith medium, respectively. It should be emphasized that ρ2 and ρ3 are assumed to be constant.
FIG. 1.

Schematic of the model.
Assuming that the bubble evolution is spherically symmetric, solutions to Eqs. (1) and (2) can be written as
| (3) |
| (4) |
where r is the radial coordinate of a spherical coordinate system originated at the center of the bubble, er is the unit vector along r, φi is the scalar velocity potential, and ai and bi are unknown time functions.
By using the condition that p3 → p0 + pac(t) as r → ∞, where p0 is the hydrostatic pressure in the host liquid and pac is the pressure of an imposed acoustic field, one finds b3 to be
| (5) |
To calculate a2, a3, and b2, the boundary conditions at the droplet–host liquid interface and at the bubble surface are used. At the droplet–host liquid interface, one has
| (6) |
| (7) |
where σ23 is the surface tension at the droplet–host liquid interface. From Eq. (6), it follows that
| (8) |
Substituting Eqs. (3) and (4) into Eq. (7) and using Eqs. (5) and (8), one obtains
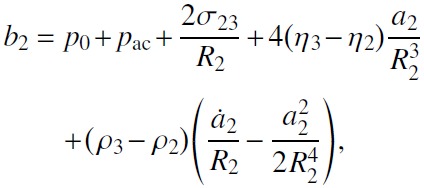 |
(9) |
where the dot over a2 denotes the time derivative. The condition of conservation of mass at the bubble surface gives the following equations:28,29
| (10) |
where v1 is the vapor velocity inside the bubble, ρ1 is the vapor density, and ξ is the evaporation rate, i.e., the density of the mass flux through the bubble surface. Comparing the expression for v2 given by Eq. (3) at r = R1(t) with that given by Eq. (10), one finds
| (11) |
Substitution of Eq. (11) into Eq. (9) yields
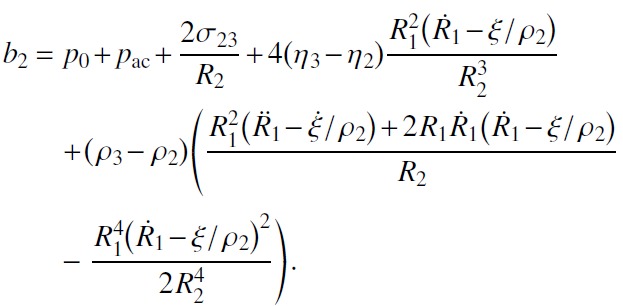 |
(12) |
The equations obtained above can now be used to derive an equation for the bubble radius R1(t). To this end, we use the equation of momentum conservation at the bubble surface, given by28
| (13) |
where p1 is the pressure within the bubble and σ12 is the surface tension at the bubble–droplet interface. Note that Eq. (13) takes account of mass transfer between the bubble and the droplet which is caused by evaporation (ξ > 0) and condensation (ξ < 0). Substitution of Eqs. (3), (4), and (10)–(12) into Eq. (13) yields the following equation for R1(t):
| (14) |
Equation (14) contains four quantities to be determined: R2, p1, ρ1, and ξ. The droplet radius R2 can be calculated by applying the condition of conservation of mass to the droplet. This condition is written as
| (15) |
From Eq. (15), it follows that
| (16) |
Note that this equation includes within the brackets as opposed to as suggested in the model of Qamar et al.22,23
To calculate the other unknown quantities, equations of heat transfer for the bubble and the droplet should be used. These are partial differential equations of second order which govern temperature fields within the bubble and the droplet.28 Calculations can be considerably simplified assuming that the temperature field within the bubble is spatially uniform.19,29 As a result, we get the following equations:28,29
| (17) |
| (18) |
| (19) |
| (20) |
where Rg1 = Rg/mv is the gas constant of the vapor, Rg is the universal gas constant, mv is the molar mass of the vapor, T1 is the temperature inside the bubble, γ = cp1/(cp1−Rg1) is the ratio of the specific heats of the vapor, cp1 is the specific heat of the vapor at constant pressure, κ2 is the thermal conductivity of the droplet, q is the latent heat of evaporation, T2(r, t) is the temperature field inside the droplet, χ2 = κ2/(ρ2c2) is the thermal diffusivity of the droplet, and c2 is the specific heat of the droplet. Equations (17) and (18) are based on the assumption that the vapor inside the bubble behaves as an ideal gas. This is a common assumption used in all models for PCCAs18,19,22,23,30 and its justification can be found in Refs. 28 and 39. Equation (19) follows from the equation for heat flux which goes through the bubble surface as a result of the evaporation of the droplet liquid. Equation (20) describes the temperature distribution inside the droplet. This equation is solved under the following conditions:
| (21) |
where T0 is the temperature in the host liquid at infinity. In addition to the above equations, it is conventional to assume that T1 is equal to the saturation temperature corresponding to the pressure p1 inside the bubble.29 This assumption allows one to use the Clapeyron–Clausius equation,
| (22) |
where Ts0 is the saturation temperature at the reference pressure ps0. Equation (22) closes the system of equations.
When the PFC droplet completely turns into a vapor bubble, the oscillation of the bubble is described by the Keller–Miksis equation,27
| (23) |
where Rb is the instantaneous bubble radius, c is the sound speed in the host liquid, σ13 is the surface tension at the vapor–host liquid interface, and pb0 and Rb0 are the pressure inside the bubble and the bubble radius at the moment when the droplet completely turns into vapor. The values of pb0 and Rb0, as well as at Rb = Rb0, are set equal to the values of p1, R1, and at the moment when the droplet turns into vapor.
Finally, from Eq. (4), it follows that the scattered pressure in the host liquid is given by
| (24) |
Note that when the droplet is completely converted into vapor, R1 in Eq. (24) should be set equal to Rb and ξ = 0.
2.B. Validation of model
The validation of the model is carried out by comparing simulated results with experimental measurements.
The numerical simulations are performed by solving Eq. (14) simultaneously with Eqs. (16)–(22). These equations, except Eq. (20), are ordinary differential equations so their numerical solution is straightforward. The numerical solution to Eq. (20) is found by a spectral collocation method using Chebyshev polynomials. A detailed description of this method as applied to the equation of heat transfer is given by Kamath and Prosperetti;40 see also Refs. 41 and 42.
The experimental data used for the validation of the model were acquired during the study described in detail in Ref. 37. In brief, phospholipid-encapsulated droplets of superheated perfluorocarbons were generated by a microbubble condensation method wherein precursor microbubbles are reverted to the liquid state by reducing ambient temperature and increasing ambient pressure.32,33 The phospholipid shell was composed of a 9:1 M dissolution of 1,2-distearoyl-sn-glycero-3-phosphocholine and 1,2-distearoyl-sn-glycero-3-phosphoethanolamine-N-methoxy(polyethylene-glycol)-2000. High-speed video microscopy was used to capture sequences of bubble activity after droplets were vaporized by short pulses (8 MHz, two cycles) at the acoustic and optical focus. Vaporization of the droplets within the microvessel-mimicking cellulose tube provided up to 24 measurements of the unique overexpansion and oscillation produced by volatile droplets; see Fig. 2. The comparison of the simulated and experimental results is carried out for OFP and DFB droplets of different sizes.
FIG. 2.
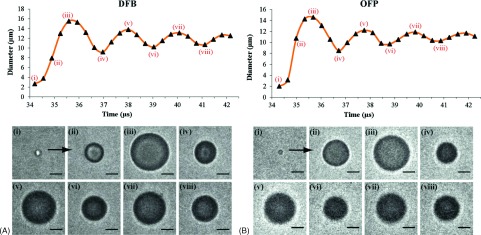
Examples of experimental measurements. (A) A DFB droplet near 2.7 μm in diameter vaporizes and expands to a maximum near 15.5 μm in diameter and eventually settles to a smaller resting diameter. (B) An OFP droplet near 2 μm in diameter expands to a maximum near 14.6 μm in diameter and settles to a smaller resting diameter. Scale bar represents 5 μm. Reprinted with permission from P. S. Sheeran, T. O. Matsunaga, and P. A. Dayton, Phys. Med. Biol. 59, 379–402 (2014). Copyright 2014, Institute of Physics and Engineering in Medicine.
3. RESULTS
Figure 3 illustrates the results obtained for OFP droplets. It shows the evolution of the bubble diameter with time for four droplets with the initial diameters D0 = 2.0, 2.7, 3.7, and 5.9 μm. The circles correspond to the experimental data and the solid lines show the simulated results. The parameters of media 1 and 2 used in the simulations are given in Table I. They correspond to gaseous and liquid OFPs at 37 °C. The parameters of medium 3 were set to be the following: p0 = 101.3 kPa, ρ3 = 993.25 kg/m3, σ23 = 0.0035 N/m, and c = 1520 m/s. They correspond to water at T0 = 37 °C. As an excitation, a two-cycle, 8 MHz, 500 kPa Gaussian pulse was used. The initial bubble radius R10 was set to be equal to 0.1 μm in all cases shown in Fig. 3. The simulated results were fitted to the experimental data by the least squares method using the program package mathematica (Wolfram Research, Inc., Champaign, IL). The fitting was carried out by varying two parameters: the viscosity η3 of the host liquid and the surface tension σ13 between the PFC vapor and the host liquid. All other model parameters were kept invariable. As starting values for η3 and σ13, we used the value of viscosity for water (0.001 Pa s) and the value of surface tension for the air–water interface (0.07 N/m). The resulting best-fit values of η3 and σ13 are provided in the caption of Fig. 3.
FIG. 3.

Comparison of simulated and experimental results for OFP droplets. The best-fit values of η3 and σ13 are (a) η3 = 0.006 Pa s, σ13 = 0 N/m; (b) η3 = 0.0065 Pa s, σ13 = 0 N/m; (c) η3 = 0.009 Pa s, σ13 = 0 N/m; (d) η3 = 0.02 Pa s, σ13 = 0.25 N/m. The cross shows the moment when the droplet completely turns into vapor.
TABLE I.
Material properties of different PFCs used in simulations.
| mv (kg/mol) | cp1 [J/(kg K)] | Ts0(°C) | ps0 (kPa) | σ12 (mN/m) | ρ2(kg/m3) | η2 (μPa s) | c2 [J/(kg K)] | κ2 [W/(m K)] | q (kJ/kg) | |
|---|---|---|---|---|---|---|---|---|---|---|
| OFP | 188.02 × 10⁻³ | 1028.5 | −36.79 | 101.3 | 2.629 | 1601 | 108.25 | 1268.5 | 0.0385 | 242.85 |
| DFB | 238.03 × 10⁻³ | 892 | −2.081 | 101.3 | 6.025 | 1594 | 188.9 | 1113.5 | 0.04095 | 239.7 |
| DDFP | 288.03 × 10⁻³ | 852.31 | 29 | 101.3 | 8.54 | 1590 | 652 | 1089.4 | 0.0556 | 116.8 |
To quantify the difference between the experimental data and the simulations, the L2-norm error is calculated, which is defined as43
| (25) |
where and are the experimental and simulated values of the bubble diameter, respectively. For Figs. 3(a)–3(d), the L2-norm errors were found to be ε = 0.062, 0.043, 0.058, and 0.067, respectively.
The simulated and experimental results for DFB droplets are shown in Fig. 4. They were obtained for four droplets with the initial diameters D0 = 2.2, 3.6, 4.4, and 6.7 μm. The parameters of media 1 and 2 used in the simulations are given in Table I. They correspond to gaseous and liquid DFBs at 37°C. The parameters of medium 3 and the acoustic pulse were as in Fig. 3. The L2-norm errors for Figs. 4(a)–4(d) are ε = 0.088, 0.069, 0.058, and 0.037, respectively.
FIG. 4.

Comparison of simulated and experimental results for DFB droplets. The best-fit values of η3 and σ13 are (a) η3 = 0.004 Pa s, σ13 = 0 N/m; (b) η3 = 0.0105 Pa s, σ13 = 0.065 N/m; (c) η3 = 0.007 Pa s, σ13 = 0 N/m; (d) η3 = 0.025 Pa s, σ13 = 0 N/m. The cross shows the moment when the droplet completely turns into vapor.
The results presented in Figs. 5–7 were obtained in order to demonstrate the capabilities of the proposed model. Since these results are discussed in Sec. 4, here we only briefly point out the meaning of the presented plots and conditions under which they were calculated.
FIG. 5.
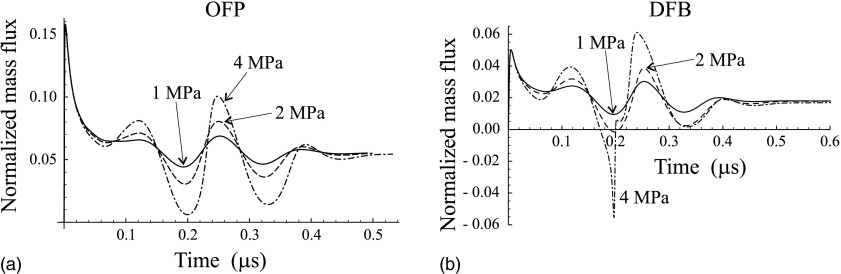
Normalized mass flux through the surface of the vapor bubble for (a) the OFP droplet shown in Fig. 3(c) and (b) the DFB droplet shown in Fig. 4(c) at three values of the amplitude of the ultrasound pulse: 1, 2, and 4 MPa.
FIG. 7.

Bubble evolution inside droplets composed of different PFCs. The cross shows the moment when the droplet is completely converted into vapor.
Figure 5 shows the normalized mass flux, ξ/(ωR10ρ2), calculated by our model for the OFP droplet shown in Fig. 3(c) and for the DFB droplet shown in Fig. 4(c) at three values of the amplitude of the ultrasound pulse: 1, 2, and 4 MPa.
Figure 6 shows the evolution of a vapor bubble inside a DDFP droplet. Since we do not have our own experimental data for such droplets, we used data from the work of Shpak et al.;19 see Fig. 3 in their paper. These data were obtained for a 5.4 μm radius droplet which was activated by a six-cycle, 3.5 MHz, 4.5 MPa pulse at the temperature of the surrounding liquid (water) T0 = 44 °C, i.e., with a superheat of 15 °C. The parameters of media 1 and 2 used in the simulations are given in Table I. They correspond to the material properties of gaseous and liquid DDFPs. The parameters of medium 3 were set to be the following: p0 = 101.3 kPa, σ23 = 0.0035 N/m, and ρ3 = 993 kg/m3. Shpak et al. suggested using R10 = 1 μm in simulations. We used a slightly larger value, R10 = 1.2 μm. The reason is the following. Shpak et al. have showed that, for such driving pulses as those applied in their experiments, it is necessary to take into account the presence of gas fraction inside the initial vapor bubble. Otherwise, the bubble does not survive the first cycles of the driving pulse. As our model ignores the presence of gas fraction, we had to use a slightly larger initial radius to avoid complete condensation of the bubble during the first driving cycles. The L2-norm error for Fig. 6 is ε = 0.107.
FIG. 6.

Comparison of simulated (solid line) and experimental (circles) results obtained for a 5.4 μm radius DDFP droplet activated by a six-cycle, 3.5 MHz, 4.5 MPa pulse at 15 °C superheating.
Finally, Fig. 7 shows the simulation of bubble evolution inside three droplets composed of different PFCs: OFP, DFB, and DDFP. The droplets have the same initial diameter (4 μm) and are excited by the same driving pulse (two cycles, 8 MHz, 1 MPa) at the ambient temperature T0 = 37 °C. The aim of Fig. 7 is to demonstrate the effect of the material properties of different PFCs on the droplet vaporization when all other parameters are equal.
4. DISCUSSION
Before the discussion of the results presented in Sec. 3, it is appropriate to make a few remarks about the equations derived in Sec. 2.
Our derivation treats the density of the droplet ρ2 and the density of the host liquid ρ3 as constants. Physically, this means that radiation losses due to the compressibility of the above media are assumed to be negligible in the course of vaporization. This simplification is acceptable since the liquid velocity caused by the motion of the surfaces of the bubble and the droplet in the course of vaporization is small compared to the speed of sound in the droplet liquid and the host liquid.28 Note, however, that when the droplet completely turns into vapor, the velocity of the bubble oscillation can be non-negligible as compared to the speed of sound in the host liquid. Therefore, we describe the bubble oscillation by the Keller–Miksis equation27 which is known to take account of radiation losses.
It is interesting to compare Eq. (14) with the model of Qamar et al.; see Eq. (7) in Ref. 22 or Eq. (3) in Ref. 23. To do this comparison, the tube diameter in their model should be set to be infinite. It is found that an equation that results from the passage to this limit differs from Eq. (14). More specifically, the terms with ρ3 are absent from that equation and the term with ξ2 has the opposite sign. Another test is the transformation to the Rayleigh–Plesset equation at R1 = R2 and ξ = 0. Equation (14) reduces to the Rayleigh–Plesset equation under these conditions, whereas the model of Qamar et al. does not. These disagreements suggest that there are inaccuracies in the approach of Qamar et al. Unfortunately, the lack of detailed calculations in their papers makes it impossible to clarify this issue.
Let us proceed to the results presented in Sec. 3. The purpose of these results is to validate the developed model by comparison with experimental data and to demonstrate the ability of the model to describe physical processes which occur in the course of vaporization.
One important point to notice is the crosses in Figs. 3 and 4. They show the moment when, as our model predicts, the droplet completely turns into vapor. As one can see, the stage of vaporization is relatively short but this stage is very important because it provides input data (pb0, Rb0, and ) for the next oscillatory stage. At the stage of vaporization, there was no necessity to vary any model parameters to attain good agreement between the simulated and experimental results. To obtain agreement between the simulated and experimental results at the oscillatory stage, the values of η3 and σ13 were varied, keeping all other model parameters invariable. The necessity of varying η3 and σ13 for fitting the experimental curves can be explained by the following hypothesis. It is known from investigations into the dynamics of phospholipid-coated microbubble contrast agents that even after the phospholipid shell is broken down, the oscillation of the bubble remains different from what is observed for an equivalent nonencapsulated bubble. It is believed that this occurs because of the remnants of the shell on the bubble surface.44 It is reasonable to assume that vapor bubbles resulting from phospholipid-coated PFC droplets undergo a similar influence, namely, the parts of the phospholipid shell of the droplets remain on the surface of the vapor bubbles at the oscillatory stage and their presence manifests itself through the parameters η3 and σ13. It should be noted that in most cases it was sufficient to vary only η3, keeping σ13 = 0. This result does not mean that the real value of σ13 is 0. Most likely it means that the value of σ13 is relatively small in some cases, so the effect of σ13 on the bubble oscillation is insignificant in comparison with the effect of the viscosity η3, which allows one to set σ13 = 0 when these cases are modeled. The zero value of σ13 may also be a confirmation of the fact that the shell remnants are present on the bubble surface, as supposed above, because studies on encapsulated microbubbles show that the effect of a phospholipid shell can manifest itself in theoretical models as zero surface tension.44
As stated in Sec. 3, to evaluate quantitatively agreement between the theoretical and experimental results, the L2-norm errors were calculated for the results presented in Figs. 3 and 4. The fact that these errors are sufficiently small suggests that agreement between the numerical and experimental results can be considered as good. It should be emphasized that the model contains 16 physical parameters describing the material properties of media 1–3. However, in most cases tested, varying only one of them, η3, was sufficient to attain good agreement with the experimental data. This result suggests that the proposed theoretical model is able to correctly describe the key physical processes underlying the dynamics of volatile phase-change contrast agents.
Equations (17)–(20), (22), and (24) show that the developed theory allows one to simulate not only the evolution of the bubble radius but also the behavior of such quantities as the pressure and the temperature inside the bubble, the mass flux through the bubble surface, the temperature inside the droplet, and the scattered pressure in the host liquid. As an example, Fig. 5 demonstrates the mass flux calculated for an OFP droplet and for a DFB droplet at increasing values of the amplitude of the ultrasound pulse. As one can see, the mass flux is not constant contrary to the assumption of Qamar et al.22 It should be admitted, however, that it tends to become constant when the ultrasound pulse ends. It is also interesting to note that, as Fig. 5(b) shows, both evaporation and recondensation (negative mass flux) can occur if the pulse amplitude is large enough.
Figure 6 demonstrates that our model can be also used to describe the dynamics of PFC droplets with higher boiling points, such as DDFP droplets (29 °C at atmospheric pressure). As one can see, the model is capable of reproducing the behavior of DDFP droplets observed in experiments. It should be noted that in the case shown in Fig. 6, the moment when the droplet is completely converted into vapor is not reached. The fitting of the simulated curve to the experimental data was carried out by varying the viscosity η3 of the host liquid. The final value is η3 = 0.00955 Pa s. This value can be explained by the fact that the droplet has an encapsulating shell. We have also found that the simulation of the bubble growth at the initial stage is very sensitive to the form of the driving pulse. Since the form of the driving pulse used by Shpak et al. is unknown, we assumed that the pulse is Gaussian. The fact that the real pulse could be different, as well as the neglect of gas fraction in our model, is likely to cause the discrepancies between the experimental and theoretical results at the initial stage of the bubble growth.
Finally, Fig. 7 allows one to compare the bubble evolution inside equivalent droplets composed of different PFCs which have different boiling points. The crosses on the curves show the moment when each droplet completely turns into vapor. As one can see, the magnitude of superheating is an important factor. The stronger the superheating, the shorter the time necessary for the droplet to turn into vapor. The shorter this time, the stronger the overexpansion of the vapor bubble and its subsequent oscillation. It is also interesting to note that although the difference between the boiling points for the DFB and OFP droplets is close to that for the DDFP and DFB droplets, the difference in the time of complete vaporization for the DDFP and DFB droplets is much larger than that for the DFB and OFP droplets. This observation suggests that the vaporization dynamics of PFC droplets is an essentially nonlinear process.
5. CONCLUSION
A theoretical model has been developed that describes the growth of a vapor bubble inside an acoustically activated perfluorocarbon droplet until the droplet completely turns into vapor, and the subsequent overexpansion and damped oscillations of the vapor bubble until settling to a final diameter. The model was validated by comparing simulated results with experimental data acquired by ultrahigh speed video microscopy for decafluorobutane and octafluoropropane microdroplets of different sizes. It was shown that there is good agreement between the theoretical and experimental results, which suggests that the developed model is able to correctly reproduce the key physical processes underlying the vaporization dynamics of volatile phase-change contrast agents.
ACKNOWLEDGMENTS
Acquisition of the experimental data was supported in part by the National Institutes of Health (Grant No. EB-008733) as well as pilot funds from National Science Foundation (DMR#1122483) and the Focused Ultrasound Foundation. The high-speed imaging system was purchased through National Institutes of Health shared instrumentation Grant No. S10 RR025594. The authors would like to thank Ali Dhanaliwala and Professor John Hossack at the University of Virginia for assistance with the high-speed imaging system.
REFERENCES
- 1.Simpson D. H., Chien Ting C., and Burns P. N., “Pulse inversion Doppler: A new method for detecting nonlinear echoes from microbubble contrast agents,” IEEE Trans. Ultrason. Ferroelectr. Freq. Control 46, 372–382 (1999). 10.1109/58.753026 [DOI] [PubMed] [Google Scholar]
- 2.Whittingham T. A., “Contrast-specific imaging techniques: Technical perspective,” in Contrast Media in Ultrasonography. Basic Principles and Clinical Applications, edited by Bart A. L. and Sartor K. (Springer, Berlin, 2005), pp. 43–76. [Google Scholar]
- 3.Hernot S. and Klibanov A. L., “Microbubbles in ultrasound-triggered drug and gene delivery,” Adv. Drug Deliv. Rev. 60, 1153–1166 (2008). 10.1016/j.addr.2008.03.005 [DOI] [PMC free article] [PubMed] [Google Scholar]
- 4.Hynynen K., “Ultrasound for drug and gene delivery to the brain,” Adv. Drug Deliv. Rev. 60, 1209–1217 (2008). 10.1016/j.addr.2008.03.010 [DOI] [PMC free article] [PubMed] [Google Scholar]
- 5.Ferrara K., Pollard R., and Borden M., “Ultrasound microbubble contrast agents: Fundamentals and application to gene and drug delivery,” Ann. Rev. Biomed. Eng. 9, 415–447 (2007). 10.1146/annurev.bioeng.8.061505.095852 [DOI] [PubMed] [Google Scholar]
- 6.Mullin L. B., Phillips L. C., and Dayton P. A., “Nanoparticle delivery enhancement with acoustically activated microbubbles,” IEEE Trans. Ultrason. Ferroelectr. Freq. Control 60, 65–77 (2013). 10.1109/TUFFC.2013.2538 [DOI] [PMC free article] [PubMed] [Google Scholar]
- 7.Mullin L., Gessner R., Kwan J., Kaya M., Borden M. A., and Dayton P. A., “Effect of anesthesia carrier gas on in vivo circulation times of ultrasound microbubble contrast agents in rats,” Contrast Media Mol. Imaging 6, 126–131 (2011). 10.1002/cmmi.414 [DOI] [PMC free article] [PubMed] [Google Scholar]
- 8.Kripfgans O. D., Fowlkes J. B., Miller D. L., Eldevik O. P., and Carson P. L., “Acoustic droplet vaporization for therapeutic and diagnostic applications,” Ultrasound Med. Biol. 26, 1177–1189 (2000). 10.1016/S0301-5629(00)00262-3 [DOI] [PubMed] [Google Scholar]
- 9.Sheeran P. S. and Dayton P. A., “Phase-change contrast agents for imaging and therapy,” Curr. Pharm. Des. 18, 2152–2165 (2012). 10.2174/138161212800099883 [DOI] [PMC free article] [PubMed] [Google Scholar]
- 10.Rapoport N., “Phase-shift, stimuli-responsive perfluorocarbon nanodroplets for drug delivery to cancer,” WIREs Nanomed. Nanobiotechnol. 4, 492–510 (2012). 10.1002/wnan.1176 [DOI] [PMC free article] [PubMed] [Google Scholar]
- 11.Lin C.-Y. and Pitt W. G., “Acoustic droplet vaporization in biology and medicine,” Biomed. Res. Int. 2013, 1–13 10.1155/2013/404361 [DOI] [PMC free article] [PubMed] [Google Scholar]
- 12.Strohm E., Rui M., Gorelikov I., Matsuura N., and Kolios M., “Vaporization of perfluorocarbon droplets using optical irradiation,” Biomed. Opt. Express 2, 1432–1442 (2011). 10.1364/BOE.2.001432 [DOI] [PMC free article] [PubMed] [Google Scholar]
- 13.Wilson K., Homan K., and Emelianov S., “Biomedical photoacoustics beyond thermal expansion using triggered nanodroplet vaporization for contrast-enhanced imaging,” Nat. Commun. 3, 618 (2012). 10.1038/ncomms1627 [DOI] [PubMed] [Google Scholar]
- 14.Rapoport N., Gao Z., and Kennedy A., “Multifunctional nanoparticles for combining ultrasonic tumor imaging and targeted chemotherapy,” J. Natl. Cancer Inst. 99, 1095–1106 (2007). 10.1093/jnci/djm043 [DOI] [PubMed] [Google Scholar]
- 15.Wong Z. Z., Kripfgans O. D., Qamar A., Fowlkes J. B., and Bull J. L., “Bubble evolution in acoustic droplet vaporization at physiological temperature via ultra-high speed imaging,” Soft Matter 7, 4009–4016 (2011). 10.1039/c1sm00007a [DOI] [Google Scholar]
- 16.Reznik N., Williams R., and Burns P. N., “Investigation of vaporized submicron perfluorocarbon droplets as an ultrasound contrast agent,” Ultrasound Med. Biol. 37, 1271–1279 (2011). 10.1016/j.ultrasmedbio.2011.05.001 [DOI] [PubMed] [Google Scholar]
- 17.Reznik N., Seo M., Williams R., Bolewska-Pedyczak E., Lee M., Matsuura N., Gariepy J., Foster F. S., and Burns P. N., “Optical studies of vaporization and stability of fluorescently labelled perfluorocarbon droplets,” Phys. Med. Biol. 57, 7205–7217 (2012). 10.1088/0031-9155/57/21/7205 [DOI] [PubMed] [Google Scholar]
- 18.Shpak O., Kokhuis T., Luan Y., Lohse D., de Jong N., Fowlkes J. B., Fabiilli M. L., and Versluis M., “Ultrafast dynamics of the acoustic vaporization of phase-change microdroplets,” J. Acoust. Soc. Am. 134, 1610–1621 (2013). 10.1121/1.4812882 [DOI] [PubMed] [Google Scholar]
- 19.Shpak O., Stricker L., Versluis M., and Lohse D., “The role of gas in ultrason-ically driven vapor bubble growth,” Phys. Med. Biol. 58, 2523–2535 (2013). 10.1088/0031-9155/58/8/2523 [DOI] [PubMed] [Google Scholar]
- 20.Ye T. and Bull J. L., “Direct numerical simulations of micro-bubble expansion in gas embolotherapy,” J. Biomech. Eng. 126, 745–759 (2004). 10.1115/1.1824131 [DOI] [PubMed] [Google Scholar]
- 21.Ye T. and Bull J. L., “Microbubble expansion in a flexible tube,” J. Biomech. Eng. 128, 554–563 (2006). 10.1115/1.2206200 [DOI] [PubMed] [Google Scholar]
- 22.Qamar A., Wong Z. Z., Fowlkes J. B., and Bull J. L., “Dynamics of acoustic droplet vaporization in gas embolotherapy,” Appl. Phys. Lett. 96, 143702 (2010). 10.1063/1.3376763 [DOI] [PMC free article] [PubMed] [Google Scholar]
- 23.Qamar A., Wong Z. Z., Fowlkes J. B., andBull J. L., “Evolution of acoustically vaporized microdroplets in gas embolotherapy,” J. Biomech. Eng. 134, 031010 (2012). 10.1115/1.4005980 [DOI] [PMC free article] [PubMed] [Google Scholar]
- 24.Plesset M. S. and Zwick S. A., “A nonsteady heat diffusion problem with spherical symmetry,” J. Appl. Phys. 23, 95–98 (1952). 10.1063/1.1701985 [DOI] [Google Scholar]
- 25.Plesset M. S. and Zwick S. A., “The growth of vapor bubbles in superheated liquids,” J. Appl. Phys. 25, 493–500 (1954). 10.1063/1.1721668 [DOI] [Google Scholar]
- 26.Wang T., “Rectified heat transfer,” J. Acoust. Soc. Am. 56, 1131–1143 (1974). 10.1121/1.1903397 [DOI] [Google Scholar]
- 27.Keller J. B. and Miksis M., “Bubble oscillations of large amplitude,” J. Acoust. Soc. Am. 68, 628–633 (1980). 10.1121/1.384720 [DOI] [Google Scholar]
- 28.Nigmatulin R. I., Dynamics of Multiphase Media (Hemisphere, New York, NY, 1991), Vol. 1. [Google Scholar]
- 29.Hao Y. and Prosperetti A., “The dynamics of vapor bubbles in acoustic pressure fields,” Phys. Fluids 11, 2008–2019 (1999). 10.1063/1.870064 [DOI] [Google Scholar]
- 30.Pitt W. G., Singh R. N., Perez K. X., Husseini G. A., and Jack D. R., “Phase transitions of perfluorocarbon nanoemulsion induced with ultrasound: A mathematical model,” Ultrason. Sonochem. 21, 879–891 (2014). 10.1016/j.ultsonch.2013.08.005 [DOI] [PubMed] [Google Scholar]
- 31.Sheeran P. S., Wong V. P., Luois S., McFarland R. J., Ross W. D., Feingold S., Matsunaga T. O., and Dayton P. A., “Decafluorobutane as a phase-change contrast agent for low-energy extravascular ultrasonic imaging,” Ultrasound Med. Biol. 37, 1518–1530 (2011). 10.1016/j.ultrasmedbio.2011.05.021 [DOI] [PMC free article] [PubMed] [Google Scholar]
- 32.Sheeran P. S., Luois S., Dayton P. A., and Matsunaga T. O., “Formulation and acoustic studies of a new phase-shift agent for diagnostic and therapeutic ultrasound,” Langmuir 27, 10412–10420 (2011). 10.1021/la2013705 [DOI] [PMC free article] [PubMed] [Google Scholar]
- 33.Sheeran P. S., Luois S. H., Mullin L. B., Matsunaga T. O., and Dayton P. A., “Design of ultrasonically-activatable nanoparticles using low boiling point perfluorocarbons,” Biomaterials 33, 3262–3269 (2012). 10.1016/j.biomaterials.2012.01.021 [DOI] [PMC free article] [PubMed] [Google Scholar]
- 34.Kawabata K., Sugita N., Yoshikawa H., Azuma T., and Umemura S., “Nano-particles with multiple perfluorocarbons for controllable ultrasonically induced phase shifting,” Jpn. J. Appl. Phys., Part 1 44, 4548–4552 (2005). 10.1143/JJAP.44.4548 [DOI] [Google Scholar]
- 35.Phillips L. C., Sheeran P. S., Puett C., Timbie K. F., Price R. J., Miller G. W., and Dayton P. A., “Dual perfluorocarbon nanodroplets enhance high intensity focused ultrasound heating and extend therapeutic window in vivo,” J. Acoust. Soc. Am. 134, 4049 (2013). 10.1121/1.4830779 [DOI] [PMC free article] [PubMed] [Google Scholar]
- 36.Sheeran P. S., Matsunaga T. O., and Dayton P. A., “Phase-transition thresholds and vaporization phenomena for ultrasound phase-change nanoemulsions assessed via high-speed optical microscopy,” Phys. Med. Biol. 58, 4513–4534 (2013). 10.1088/0031-9155/58/13/4513 [DOI] [PMC free article] [PubMed] [Google Scholar]
- 37.Sheeran P. S., Matsunaga T. O., and Dayton P. A., “Phase change events of volatile liquid perfluorocarbon contrast agents produce unique acoustic signatures,” Phys. Med. Biol. 59, 379–402 (2014). 10.1088/0031-9155/59/2/379 [DOI] [PMC free article] [PubMed] [Google Scholar]
- 38.Landau L. D. and Lifshitz E. M., Fluid Mechanics (Pergamon, Oxford, 1987). [Google Scholar]
- 39.Yang B. and Prosperetti A., “Vapor bubble collapse in isothermal and non-isothermal liquids,” J. Fluid Mech. 601, 253–279 (2008). 10.1017/S0022112008000670 [DOI] [Google Scholar]
- 40.Kamath V. and Prosperetti A., “Numerical integration methods in gas-bubble dynamics,” J. Acoust. Soc. Am. 85, 1538–1548 (1989). 10.1121/1.397356 [DOI] [Google Scholar]
- 41.Kamath V., Prosperetti A., and Egolfopoulos F. N., “A theoretical study of sonoluminescence,” J. Acoust. Soc. Am. 94, 248–260 (1993). 10.1121/1.407083 [DOI] [Google Scholar]
- 42.Stricker L., Prosperetti A., and Lohse D., “Validation of an approximate model for the thermal behavior in acoustically driven bubbles,” J. Acoust. Soc. Am. 130, 3243–3251 (2011). 10.1121/1.3626132 [DOI] [PubMed] [Google Scholar]
- 43.Horn R. A. and Johnson C. R., Norms for Vectors and Matrices (Cambridge University Press, Cambridge, 1990). [Google Scholar]
- 44.Marmottant P., van der Meer S., Emmer M., Versluis M., de Jong N., Hilgenfeldt S., and Lohse D., “A model for large amplitude oscillations of coated bubbles accounting for buckling and rupture,” J. Acoust. Soc. Am. 118, 3499–3505 (2005). 10.1121/1.2109427 [DOI] [Google Scholar]