Abstract
We show, via three-dimensional immersed-boundary-finite-element-lattice-Boltzmann simulations, that deformability-based red blood cell (RBC) separation in deterministic lateral displacement (DLD) devices is possible. This is due to the deformability-dependent lateral extension of RBCs and enables us to predict a priori which RBCs will be displaced in a given DLD geometry. Several diseases affect the deformability of human cells. Malaria-infected RBCs, for example, tend to become stiffer than their healthy counterparts. It is therefore desirable to design microfluidic devices which can detect diseases based on the cells' deformability fingerprint, rather than preparing samples using expensive and time-consuming biochemical preparation steps. Our findings should be helpful in the development of new methods for sorting cells and particles by deformability.
I. INTRODUCTION
Particle separation is important for a wide range of clinical and analytical processes such as the analysis of unknown suspensions of biological particles. Blood, for example, is a complex mixture, comprised of cells with widely differing function, size, and mechanical properties; these include platelets, erythrocytes (red blood cells, RBCs), and leukocytes (e.g., neutrophils, lymphocytes, monocytes, basophils, eosinophils). Depending on physiological state or condition, all these cells can undergo distinct morphological alterations. These changes in a cell's biophysical or biomechanical properties can arise as a result of a vast array of biological, chemical, and physical stimuli. Changes in cell deformability are known to influence many disease pathologies.
Metastatic cancer cells have been shown to have a “softer” phenotype to that of their healthy counterparts.1 Diseases such as sickle cell anemia, and malaria,2 as well as hereditary blood disorders exhibit erythrocyte “stiffening” with onset and progression of the pathological state. In malaria (e.g., Plasmodium falciparum infection), membrane stiffness of the parasitised erythrocytes has been shown to increase by almost two orders of magnitude as the intracellular parasite matures.3
Conventional cell separation strategies typically rely on intrinsic properties of the cells (e.g., density) or external labels to distinguish between cell types. For example, fluorescence-activated cell sorting (FACS) and magnetic-activated cell sorting (MACS) use fluorescent or magnetic conjugated antibodies in order to label the cells of interests; and either trigger an active sorting process or sort passively via interaction of the label with an applied force field. Centrifugation allows separation of blood into its cellular components based on the differential densities of the different cell types. These methods have been refined over the years and allow for very high resolution sorting.
Microfluidic separation methods4–9 allow for novel sorting modalities and can take advantage of smaller scales of microfluidic devices (i.e., dimensions similar to that of the cells). As such, a number of label-free microfluidic platforms have been proposed that use non-traditional biomarkers; these include cell size, shape, electrical properties (e.g., polarisability), density, deformability, and hydrodynamic properties.
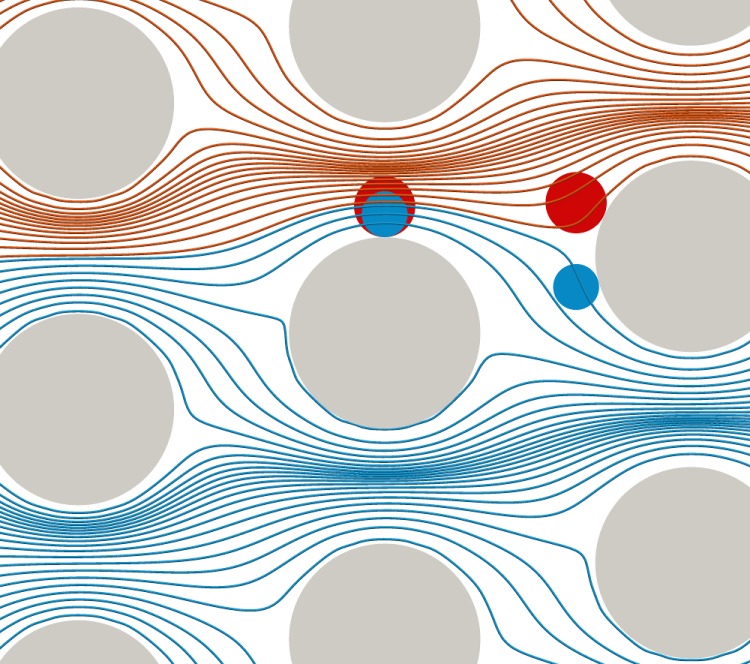
Only ten years ago, Huang et al.10 proposed a simple and effective microfluidic design to separate particles by size: deterministic lateral displacement (DLD). These devices have been used for label-free particle sorting, i.e., separation based on intrinsic properties rather than (bio)chemical pretreatment or external fields. DLD devices consist of arrays of pillars positioned within a flow channel and are capable of high-resolution continuous sorting of cells and other microscopic particles. The underlying idea is the steric interaction between the flowing particles and those pillars (Fig. 1). Depending on their size, some particles collide with the obstacles, which leads to irreversible trajectories and cross-streamline motion, even in Stokes flow. Objects smaller than a critical size move in the direction of flow (i.e., along the length of the channel), while objects larger than the critical size move in a direction defined by the pillar arrangement (i.e., they are laterally displaced). Different particle species can therefore be collected at different outlets of the device. As the mechanism behind DLD is based on deterministic (non-diffusive) separation, it can be scaled up to higher flow rates.11
FIG. 1.
Geometry of our DLD setup. An array of micron-sized pillars is set at an angle to the direction of fluid flow (from left to right) through a microfluidic channel. As described previously,12 the total fluid flux (shown as streamlines) through the pillar gap can be divided into a number of flow streams, each carrying equal fluid flux. Depending on their size, particles flowing in the device follow different paths. Particles (blue) which are smaller than a critical diameter can pass below the downstream obstacle, while larger particles (red) are forced to follow another set of streamlines and pass above the downstream obstacle. The larger particles are successively displaced while the smaller ones essentially move horizontally on zigzag trajectories.
Several groups investigated how to improve the performance of DLD devices. Clogging is always a problem for most mechanical filtration methods because the typical particle size is usually of the order of the gaps between obstacles. DLD devices typically work well with a gap size three times that of the largest particles, thus reducing issues related to clogging. Loutherback et al.13 proposed a combination of triangular posts and an oscillating flow and later14 showed that equilateral triangular pillars with sharp vertices (rather than polygons with more vertices, rounded triangluar or even circular pillars) improve the performance due to their enhanced ability to separate particles of a defined size using devices with larger gap sizes.
High throughput is generally desired as it permits the analysis of more fluid volume in less time. This can be achieved by parallelisation or increasing the flow rate. Loutherback et al.15 and later Liu et al.16 performed high-throughput experiments showing that cancer cell separation from diluted whole blood is possible at flow rates of up to several . However, increasing the flow rate leads to larger viscous stresses which in turn affect the behaviour of biological objects which are often compliant. While DLD devices function in a straightforward manner for rigid spherical particles, deformability and non-sphericity of such objects can have a large influence on the particle trajectories within these devices.
Davis et al.11 were the first to use DLD devices to separate blood components by size. The authors briefly addressed the issue of possible particle deformation due to local stresses but did not investigate this further. Holm et al.17 used DLD to separate RBCs from Trypanosoma cyclops parasites. Inglis et al.18 proposed parallelised DLD devices to enrich leukocytes in undiluted whole blood, but did not consider blood cell deformation. Al-Fandi et al.19 emphasised that deformable and non-spherical particles are usually more difficult to separate in DLD devices since their trajectories are irratic due to flow-induced deformation and tumbling. In order to minimise these undesired effects, the authors proposed novel pillar shapes such as diamond or airfoil.
Inglis et al.20 mentioned the potential impact of leukocyte deformability on their apparent size in DLD devices. Although Quek et al.21 performed simulations of deformable particles and Beech et al.22 proposed particle deformability as an additional marker for separation, Quek et al.21 did not study the role of particle deformability in DLD devices systematically. In particular, the authors did not investigate the underlying mechanism for deformability-based separation, and they considered a relatively simple system (initially circular particles in two dimensions). Only recently, Zhu et al.23 proposed a microfluidic setup to sort capsules by deformability while Ye et al.24 investigated the trajectories of deformable particles in DLD devices via 2D simulations.
Rather than avoiding or ignoring RBC deformability, we aim to understand the effect of deformability on the RBC behaviour in DLD devices. To this end, we have developed (Sec. II) and benchmarked (Sec. III) a model for deformable RBCs in DLD devices. In this study, we have restricted ourselves to one free DLD geometry parameter, the row shift d (Fig. 2). The RBC deformability is described in terms of the capillary number Ca which is the ratio of viscous, deforming stresses to the intrinsic, restoring stress of an RBC. Our analysis of the deformation characteristics of a single RBC during its passage (Sec. IV) shows that deformability-based RBC separation in a DLD device is possible. We present a Ca-d diagram (“phase space”) for the particle trajectories and rationalise the separation characteristics in terms of the apparent lateral RBC diameter. We further suggest a way to predict the observed trajectory type (displaced or undisplaced) based only on properties of the RBC and the known critical separation diameter of the device.
FIG. 2.
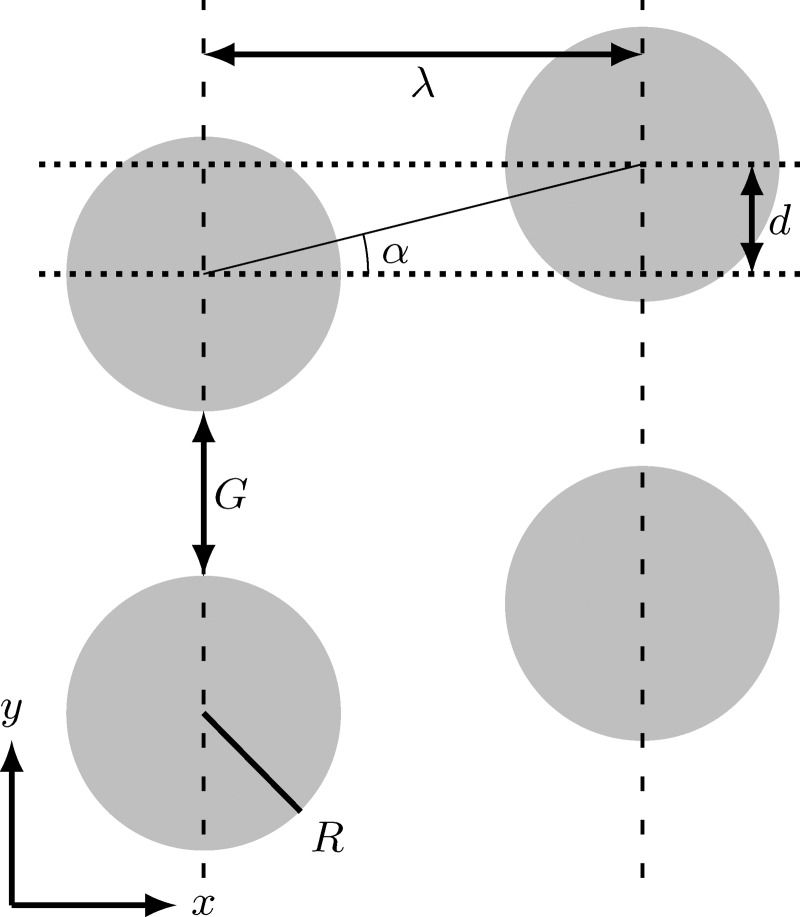
Our DLD geometry. The geometry is defined by the pillar radius R, the centre-to-centre distance λ and the row shift d. The gap size G and shift angle α are then uniquely determined. The critical diameter is a function of these geometrical parameters.
Our work should contribute to the development of future DLD devices for deformability-based particle separation. This could be applied, for example, to the mechanical detection of malaria-infected RBCs.
II. NUMERICAL METHOD AND GEOMETRY
In the following, we briefly present the employed numerical model (Sec. II A) and define the chosen flow geometry and parameters (Sec. II B).
A. Numerical model
We employ a combination of lattice-Boltzmann method (LBM)25,26 for the fluid phase, finite-element method (FEM)27,28 for the membrane dynamics and immersed-boundary method (IBM)29 for the bidirectional fluid-membrane coupling as previously described and benchmarked.30–32,38 For the IBM we use the trilinear two-point interpolation stencil. The flow is driven by a pressure gradient along the x-axis, mimicked by a constant force density. The RBC membranes are characterised by three elastic moduli: shear elasticity , local area dilation resistance , and bending modulus . Additionally, we have implemented a viscosity contrast between the RBC interior and exterior regions.33 The interior and exterior viscosities are and in lattice units, respectively. The numerical fluid density is unity in the entire domain.
We use the bounce-back boundary condition34 to describe the confining walls and the obstacles in the simulated DLD geometry. The confining walls are located at where H is the height of the DLD device. A short-range repulsion is applied between the RBC and the obstacle surfaces to avoid overlap. The repulsion force points away from the wall and decays with , where δ is the distance of a membrane node to the closest wall node, and continuously becomes zero for where is the lattice constant. RBC surface nodes which come closer than one lattice constant to the obstacle are repelled, which leads to a thin lubrication layer.
In order to reduce the simulation domain to a single obstacle unit cell, we use shifted periodicity conditions in the flow direction. Fluid and particles leaving the computational domain along the flow axis (x-axis) re-enter the domain from the other side but are displaced by the row shift d (Fig. 2) along the y-direction. We only allow integer shifts in lattice units to avoid additional interpolations. The flow is periodic along the y-axis. Fig. 2 therefore shows four identical replications of the same unit cell, each containing only one obstacle.
The present model is athermal with no fluctuations or intrinsic cell diffusion. The Péclet number is, therefore, infinite and the flow is fully deterministic. In realistic DLD devices the Péclet number is always finite and thermal diffusion may reduce the separation efficiency of very small particles.11 RBCs, however, are sufficiently large that thermal diffusion is negligible in most applications.
B. Geometry and parameters
The chosen geometry is shown in Fig. 2. The DLD device is characterised by pillars with a circular cross-section (radius R) and a centre-to-centre distance λ (both along the x- and the y-axis). This results in a gap size . Neighbouring pillar rows are shifted by a displacement (row shift) d, which in turn defines the dimensionless displacement parameter and the shift angle α via .
In our simulations, we have fixed and therefore . Moreover, we choose a fixed device height: . We emphasise the need for a relatively small height in the present investigation: this way, we force the RBCs to move parallel to the confining bottom and top walls. In practical applications, however, larger values of H are desired to reduce the flow resistance and risk of clogging. We will investigate the effect of H in a forthcoming publication. In the current work, the row shift d is the only free geometrical parameter. Thus, for rigid spheres, the critical diameter is a function of d only.17 Real-world applications will require a more thorough parameter study to optimise the RBC separation characteristics. Our intention here is not to provide such an investigation; we are rather interested in the understanding of the basic mechanism responsible for deformability-based RBC separation.
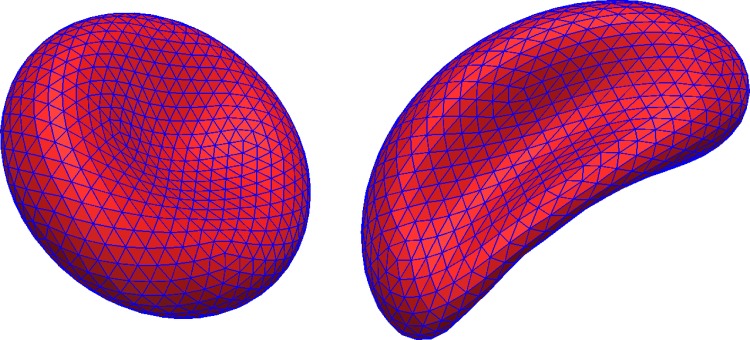
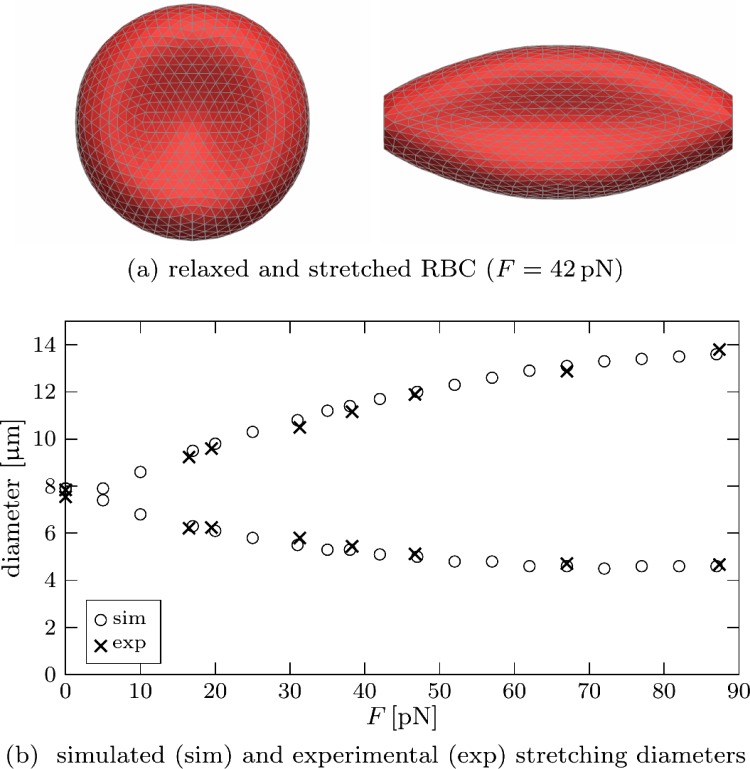
The shape of the modelled RBCs corresponds to the parametrisation first reported by Evans and Fung.35 All RBCs in our simulations have the same in-plane radius, , and we use triangular elements to describe the RBC surface as shown in Fig. 3. The RBC is assumed to be stress-free in its equilibrium state.
FIG. 3.
Mesh of an undeformed (left) and deformed (right) RBC. The cell surface is approximated by flat triangular elements.
It is convenient to introduce a dimensionless parameter denoting the RBC deformability. Since cell deformation in Stokes flow is caused by viscous stresses, the capillary number, which is the ratio of viscous stress to characteristic membrane stress, is a suitable parameter. The latter is defined by where is the in-plane shear elasticity. The typical viscous stress is given by the applied pressure gradient and the gap length scale as geometric average of gap width and height. We therefore define the capillary number as
| (1) |
The bending modulus does not enter the capillary number since and are two independent elastic properties of an RBC. For the sake of simplicity, we fix the ratio which is the physiological value for healthy RBCs.
The shear elasticity of malaria infected RBCs increases progressively as the parasite matures within the host RBC, and can grow by an order of magnitude or more over that of healthy RBCs.2 We note that, for realistic applications, it will not be sufficient to describe the health state of an RBC with a capillary number only. Diseased cells generally change their shape, which has an additional effect on the separation characteristics. Also, our model does not currently support membrane viscosity. The effects of shape changes and membrane dissipation will be investigated in the future.
Inertial effects in DLD devices are usually negligible and the Reynolds number
| (2) |
defined via the average flow velocity and the kinematic viscosity ν, is of the order of (except for some high-throughput experiments with Re up to 40).15 We will therefore not consider Re as an additional free parameter; rather we will demonstrate in Sec. III A that the chosen simulation parameters correspond to Stokes flow.
III. SIMULATIONS
In this section we describe the simulation setup and the results of the benchmark tests. We have used as the lattice constant for all simulations in this work. In particular, the size of a DLD array unit cell is , and the RBC diameter is .
A. Stokes flow assumption and flow resistance
We have run a series of simulations without particles to validate the Stokes flow assumption which predicts the following observations: (i) The average flow velocity should be strictly proportional to the applied pressure gradient . (ii) The shape of the streamlines should be the same when the geometry is mirrored: .
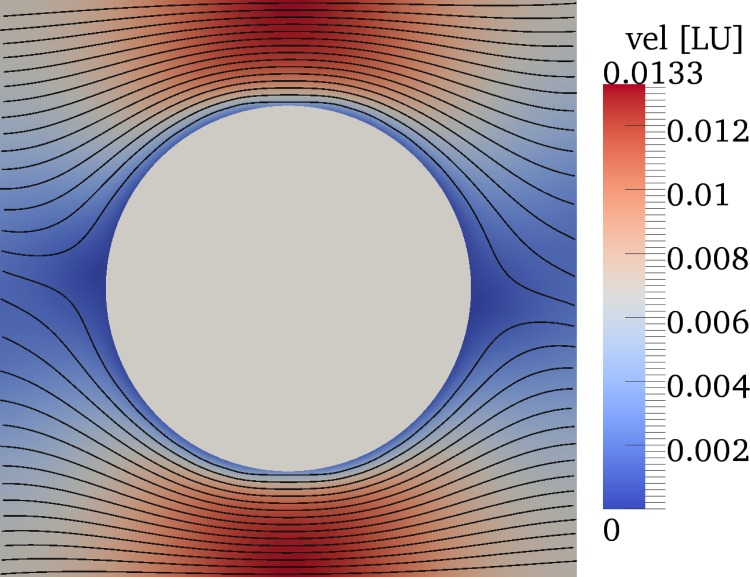
The tested parameters are , 13/80, and 20/80 (corresponding to d = 2.0, 5.2, and ), each for and 0.76. This is achieved by setting the numerical viscosity to and the force density to and , respectively (all quantities in lattice units). For all investigated values of ϵ, we have found that the ratio increases by less than upon a tenfold increase of Re. This indicates that, in the current parameter range, the Reynolds number is irrelevant. This interpretation is also supported by the shape of the streamlines (cf., Fig. 4) which are virtually identical under inversion of the coordinate system. We therefore choose for all subsequent simulations, which allows us to achieve shorter simulation times since the time step obeys and the total simulation runtime is thus proportional to .
FIG. 4.
Streamlines and colour-coded velocity magnitude (in lattice units) half-way between bottom and top walls in one unit cell of the pillar array for in the absence of particles at . The streamlines are virtually identical when the flow direction is reversed.
Furthermore, we define the flow resistance ϱ via . It denotes the required pressure gradient to achieve a desired average flow velocity. From the simulations, we find that . This value is the same for all tested displacements ϵ up to 1%. For a typical device length of about and an average flow velocity of , one would therefore require a pressure drop of about along the pillar array. Note that this result is only valid for the chosen geometry, in particular for a device depth of . Larger depths are usually desired to increase the throughput, but this would give the RBCs additional rotational degrees of freedom as they would not longer be in forced alignment with the bottom and top walls.22
B. Critical diameters
We have analysed the flow streamlines in our simulations without particles and obtained the streamline separation distance s in a plane parallel to and half-way between the walls. s is defined as the shortest distance between a pillar and the streamline which ends in a stagnation point in the next downstream pillar row. Since the streamline density is highest in the region between two laterally neighbouring pillars (Fig. 4), the point of closest proximity is located somewhere on the line connecting those two pillars (vertical dashed lines in Fig. 2). We then assume that the critical diameter of a rigid sphere is twice this separation distance s: .
The results obtained for as listed in Table I can be accurately captured by the simple scaling law,
| (3) |
in the range . Note that the prefactor and exponent will generally depend on the details of the system, e.g., the pillar shape and system depth.
TABLE I.
Streamline separation distances s as function of row shift d as predicted by simulations without particles. These data can be approximated by Eq. (3).
| Row shift | Displacement parameter | Separation distance |
|---|---|---|
| ϵ | ||
| 2.0 | 5/80 | 1.2 |
| 3.2 | 8/80 | 1.7 |
| 4.4 | 11/80 | 2.1 |
| 5.2 | 13/80 | 2.4 |
| 6.0 | 15/80 | 2.7 |
| 6.8 | 17/80 | 3.0 |
| 8.0 | 20/80 | 3.4 |
| 8.8 | 22/80 | 3.6 |
C. RBC mechanics benchmark
In order to check the validity of the RBC model, we have simulated the stretching of an RBC in an optical tweezer.2 Forces of equal magnitude and opposite direction are applied to the ends of an RBC as illustrated in Fig. 5. A stationary state is reached after some time when the tensions in the membrane balance the external forces. We then obtain the longitudinal and transversal diameters of the stretched RBC. The physical parameters used for these simulations are (shear modulus) and (bending modulus) which correspond to healthy RBCs.2,36 The results as shown in Fig. 5 reveal excellent agreement between experiment2 and our simulations. We conclude that the model can reliably predict RBC deformations up to stretching forces of about .
FIG. 5.
An RBC is stretched by applying a force F to opposite ends. The radius of the force contact area, which can be clearly seen in (a), is . The stationary longitudinal and transversal diameters are shown in (b) as a function of the applied force F. Experimental data for healthy RBCs have been taken from Fig. 7 in Suresh et al.2
D. Production simulations
We have performed simulations for a single RBC in DLD devices with various row shifts between and 22/80 (d between 2.0 and ) and capillary numbers between and 1.5. For healthy RBCs with and the chosen DLD device geometry, this corresponds to pressure gradients between and and average flow speeds between and .
The simulations provide access to cell trajectories, velocities, deformation details, and local stresses which are difficult, if not impossible, to obtain in state-of-the-art experiments. The results are presented and discussed in Sec. IV.
Additionally, we have run one of the simulations (Ca = 0.7, ) with two different initial RBC locations (centre of mass shifted by 0.4 and towards the bottom wall, respectively). Apart from a slightly different transient during which the RBC approached the centreplane, we observed the same behavior in all three simulations. This indicates that, at least for the confined geometry used here, RBCs prefer a symmetric configuration at the centreplane. A grid refinement study of the same simulation (Ca = 0.7, ) with a spatial refinement factor 1.5 revealed that the RBC is sufficiently well resolved.
IV. RESULTS AND DISCUSSION
We first characterise the cell trajectories (Sec. IV A) before we analyse the deformation and apparent diameter of the cells (Sec. IV B).
A. Cell trajectories
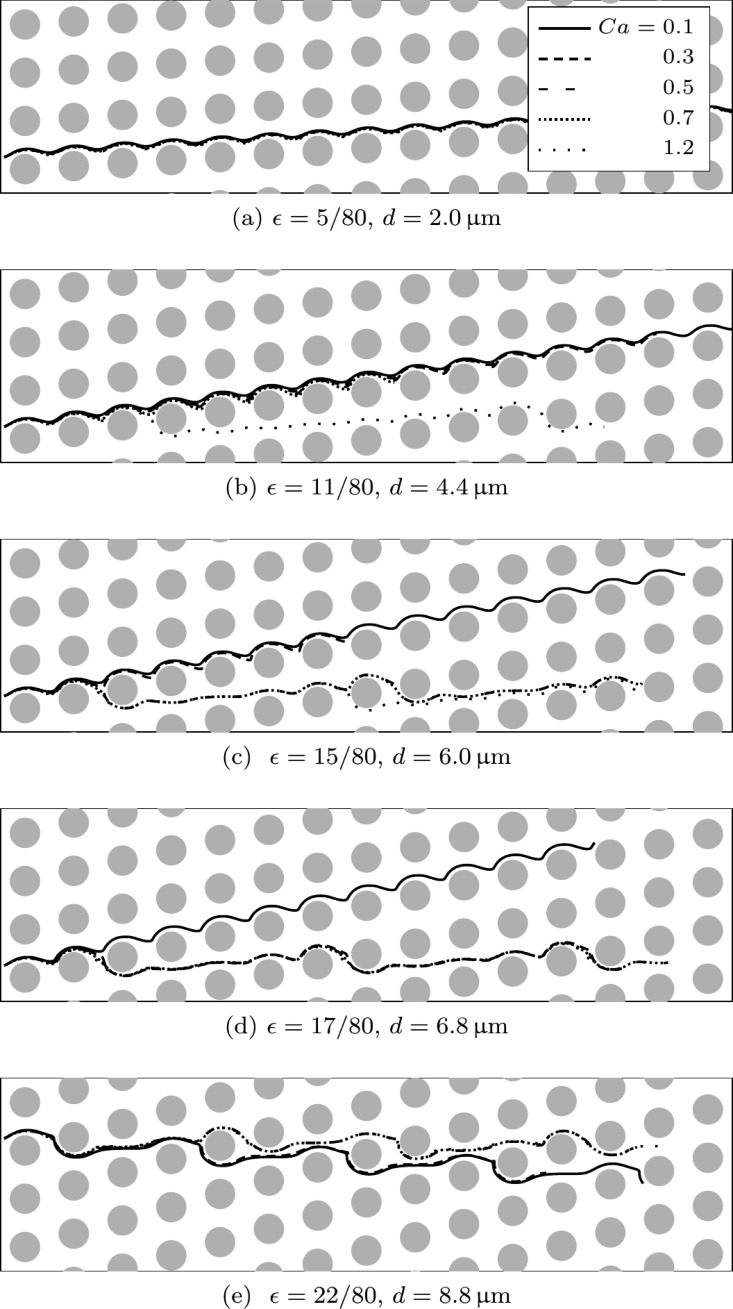
In Fig. 6, we show some trajectories of RBCs for different row shifts d and Ca-values. Two extreme cases can be observed. First, when the row shift is small (), all particles are displaced. Second, for a much larger displacement (), all particles move horizontally on average (with a zigzag motion). However, one recognises that intermediate row shifts lead to a deformability-dependent displacement. For example, only the softest RBCs (Ca > 1) show zigzag motion for , whereas for all RBCs with move on zigzag trajectories. For only the most rigid RBC (Ca = 0.1) is displaced.
FIG. 6.
RBC trajectories for five different capillary numbers (, 0.3, 0.5, 0.7, and 1.2 as indicated by solid, dashed and dotted lines in the legend of (a)) in five geometries with different row shifts (, 11/80, 15/80, 17/80, and 22/80 according to d = 2.0, 4.4, 6.0, 6.8, and ). For a small row shift () in (a), all cells are displaced. Increasing the shift (up to ) in (b)–(d) initially leads to the zigzag motion of the most supple and later also of more rigid particles. For the largest shift () in (e), all particles move on zigzag trajectories.
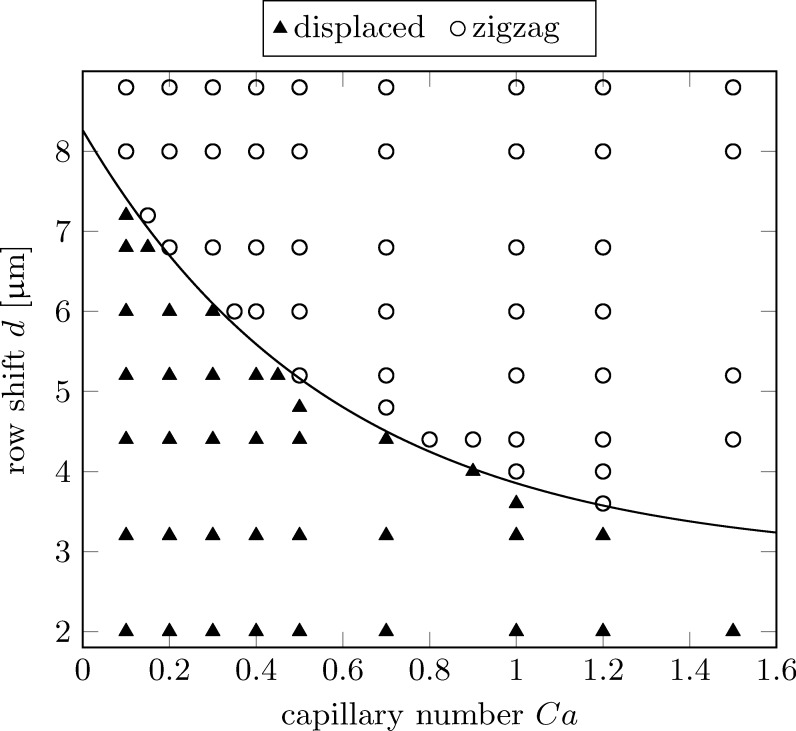
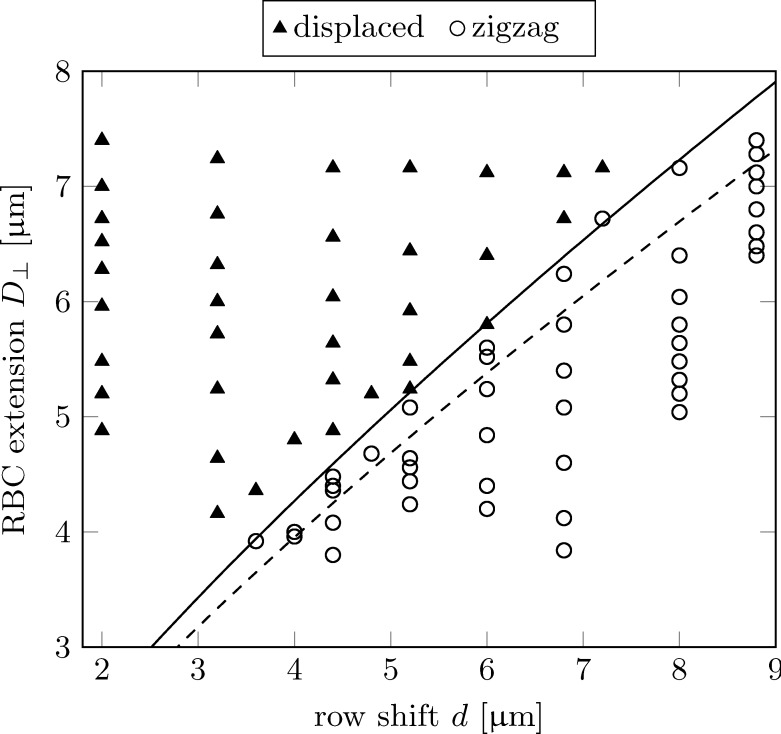
The displacement “phase space” is shown in Fig. 7. It characterises the shape of the trajectories (displaced or zigzag) as a function of chosen row shift d and capillary number Ca. In particular, this figure reveals how d has to be chosen in order to separate particles below and above a specified Ca threshold. The boundary between displaced and zigzag trajectories can be very well approximated by the simple exponential function,
| (4) |
as shown by the solid line in Fig. 7.
FIG. 7.
Separation characteristics in deformability-row shift space. Solid triangles indicate displaced cells, open circles correspond to cells on zigzag trajectories, i.e., cells moving horizontally on average. The solid line corresponds to the function in Eq. (4), which is an excellent approximation for the boundary between displaced and zigzag trajectories.
For example, assuming that two populations of RBCs with a factor of three difference in their shear modulus exist in a given sample (which is a typical value for malaria-infected versus healthy cells), the pressure gradient could be selected such that the softer and more rigid RBCs yield and 1.2, respectively. A row shift between 4.0 and should therefore be chosen to separate these two RBC species.
We would like to point out that Ca does not only have an effect on the trajectories. The average velocity of the RBCs also depends on the capillary number, even if the cells follow similar trajectories. This can be seen in Fig. 6(c) where the RBC with follows the same path as the cell with , but the velocity of the former is 50% smaller than that of the latter. The reason is that, when Ca is close to its critical value, particles experience head-on collisions with the downstream pillar as they essentially follow a streamline which ends in a stagnation point. Consequently, it takes a long time for the particle to roll either to the left or the right, which in turn reduces the average flow velocity. In principle, the RBC may even get stuck for a very long time if Ca is sufficiently finely adjusted. We discuss this observation more thoroughly in a different work.37
Concluding the discussion of the trajectories, we note that we do not observe a lubrication effect as described by Ye et al.24 The most likely explanation for this discrepancy is that the present simulations are 3D compared to the 2D numerical experiments of Ye et al.24 We expect that lubrication effects are less relevant in 3D where the fluid has one additional spatial axis along which it can flow when a RBC is approaching or leaving a nearby pillar.
B. Cell deformation and apparent diameter
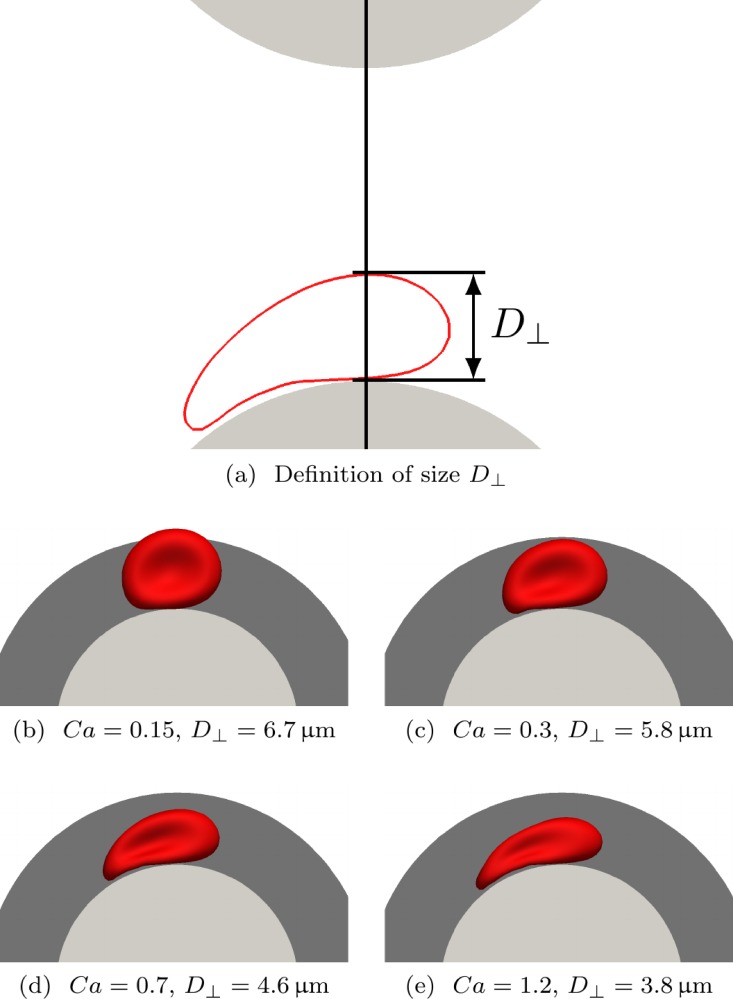
We obtained Eq. (3) based on the idea that particle trajectories are controlled by the shape of the streamlines of the ambient fluid. We now assume that the separation characteristics of the RBCs are dominated by their instantaneous size during passage between two pillars. For this reason, we define the streamline size of an RBC as its largest lateral extension along the line connecting the neighbouring pillars the RBC is currently passing, as illustrated in Fig. 8(a).
FIG. 8.
Effect of deformability on lateral RBC extension. The flow is from left to right. (a) The streamline size of the RBC (cross-section shown as red line) is defined as its maximum lateral extension during its passage between two pillars (grey circle segments). (b)–(e) Particle shapes during passage around the pillar (light grey) for () and different capillary numbers Ca at the moment when the perpendicular extension is maximum. For this particular row shift d, the critical separation diameter is , as illustrated by the dark grey region. Only the cell in (b) is laterally displaced; the others in (c)–(e) have sufficiently small perpendicular extensions to follow the zigzag trajectories.
Due to the expected dependence of on Ca, RBCs at various values of Ca should experience different streamlines and may therefore follow different trajectories in the same geometry. We show the configuration of an RBC during its passage between neighbouring pillars for four different capillary numbers in Figs. 8(b)–8(e). The row shift is . We observe that decreases upon an increase of . Initially, for small Ca in Fig. 8(b), the RBC size is larger than the critical diameter of a sphere in this geometry (, Eq. (3)). In fact, this RBC turns out to be displaced. For the remaining examples in Figs. 8(c)–8(e), is smaller than , and those RBCs actually follow the zigzag trajectories.
We have analysed the shapes of all RBCs during their passage between the pillars. Fig. 9 shows for each RBC as a function of row shift d. Depending on the capillary number, there are multiple values for each row shift where generally decreases for increasing Ca. One can clearly see a sharp separation between the displaced and the zigzag trajectories, which can be described relatively well by the empirical law in Eq. (3) (dashed line). This supports the above idea that the extension of a deformed RBC at the moment it passes the region of highest streamline density determines which trajectory to follow afterwards.
FIG. 9.
Separation characteristics in row shift-RBC extension (d-) space. The symbols are the same as in Fig. 7. The dashed line corresponds to the function in Eq. (3) while the solid line is the same function multiplied by a correction factor of 1.08.
The prediction can be significantly improved by multiplying Eq. (3) by a correction factor of 1.08 (solid line in Fig. 9). It is not surprising that the actual separation characteristics are not perfectly captured by Eq. (3). First, the particles are extended in the third dimension as well. Second, the presence of the RBC changes the shape of the streamlines compared to the situation without particles, which in turn has an effect on the motion of the RBC. This effect is expected to be significantly more important for denser RBC suspensions.
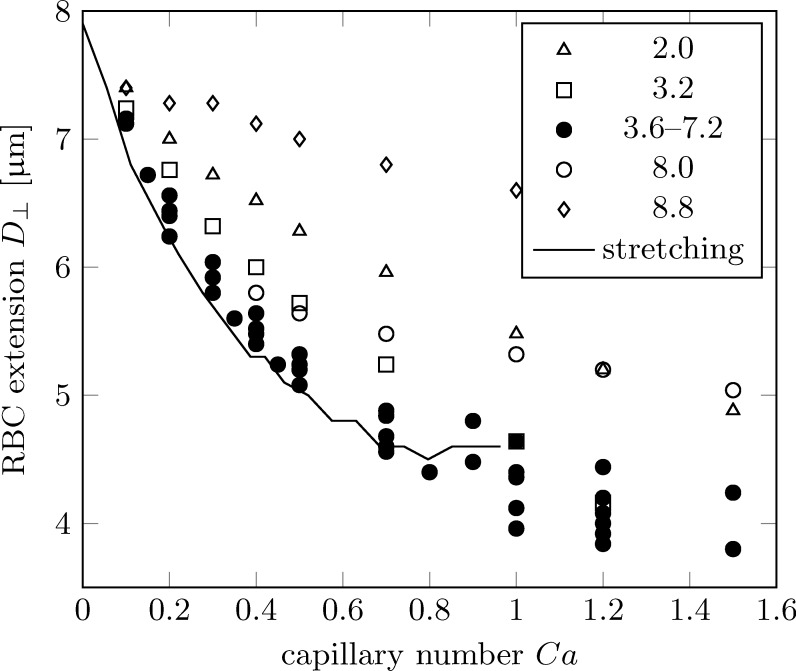
We now investigate the deformation behaviour of the RBCs as a function of the capillary number. Fig. 10 shows the same data as Fig. 9, but plotted versus Ca rather than row shift d. The first observation is that all data for basically collapse on a single line (filled symbols). RBC sizes for small () or large () row shifts do not follow this trend (open symbols). Interestingly, these extreme cases are those for which no Ca-dependent trajectories have been observed (Fig. 7). The reason is that for , the critical diameter is so small that even strongly deformed RBC are large enough to be displaced. Similarly, for , even nearly rigid RBCs are too small to be displaced; they all follow zigzag trajectories. Therefore, only intermediate row shifts are suitable for a Ca-dependent separation of RBCs anyway. We will therefore exclude the extreme row shifts (all open symbols in Fig. 10) from the following discussion. We note that the row shift range for which separation is possible will generally depend on other device parameters such as pillar shape and size. We also find that those RBCs which are shown with open symbols in Fig. 10 do not come in close contact with pillars during their passage, i.e., there is always an appreciable fluid layer between the RBC and the pillar. Due to the absence of direct collisions with the pillar, the deformation characteristics are different so that the curves do not collapse on the master curve. It is therefore possible that direct collisions of RBCs with obstacles actually increase the separation sensitivity; this should be taken into account in future DLD designs.
FIG. 10.
Cell extension during passage between two pillars as a function of capillary number Ca. Data for relevant row shifts () are shown as filled symbols, the remaining data are shown as open symbols. The simulated small cell diameters from Fig. 5 are plotted as a solid line where the stretching force F has been converted to a capillary number according to Eq. (5).
RBCs in geometries with are in close contact with the pillar during their passage. The cells therefore move through a region of large viscous stresses. A simple shear flow can be represented as a superposition of a rotational and an extensional component. We now hypothesise that the extensional stress during the passage between the pillars has qualitatively the same effect as the stretching force in an optical tweezer (Fig. 5). The rotational component is suppressed by the presence of the pillar as a rigid obstacle.
We define a stretching capillary number for the optical tweezer setup
| (5) |
where 2F is the total stretching force acting on the RBC surface area A (which is for an RBC). Associated with this is the average surface stretching stress scale . The simulation data of the small RBC diameter from Fig. 5(b) can now be plotted as a function of rather than F. It is shown as a solid line in Fig. 10. Note that there are no free parameters involved. The agreement of the stretching data and the simulated RBC extensions in the DLD device is remarkable.
We can therefore conclude that the stretching component of the viscous stress in the DLD geometry has qualitatively and quantitatively a similar effect on RBC deformation as the stretching force in an optical tweezer. In particular, the extension of the RBC along its shortest diameter behaves nearly identically, at least for those RBCs which come in close contact during their passage between pillars (). This is interesting because the actual RBC shape is not exactly the same in both situations.
Based on these findings, it is possible to predict for which row shift d and capillary number Ca an RBC will be displaced or follow the zigzag trajectories. For this, we need
-
1.
the known stretching curve in Fig. 5(b) to relate the small RBC diameter to the stretching force and therefore to the capillary number;
-
2.
the critical diameter for a given DLD device which can be simply obtained by investigating the shape of the streamlines or performing experiments with rigid beads.
Our observations and results should help in the design of cell separation devices beyond simple trial and error. However, we emphasise again that the results reported here are only valid for a specific DLD device, in particular having a height of . The ability to better understand and accurately design DLD structures should lead to an expansion in their functionality and wider use for separation of biological mixtures of ever increasing complexity.
V. CONCLUSIONS
We have performed three-dimensional high resolution immersed-boundary-lattice-Boltzmann-finite-element simulations of single deformable RBCs in deterministic DLD devices. While keeping other geometrical parameters fixed, we have varied the row shift d of the DLD setup. Additionally, we have varied the RBC capillary number Ca, the ratio between deforming viscous stresses and restoring elastic stresses of the RBC membrane. For example, more rigid RBCs have a smaller Ca value than suppler cells in the same flow environment. Inertial effects are negligible in the current situation.
Investigating the cell trajectories and displacement characteristics in the –d diagram, we have shown that a deformability-based separation of RBCs in DLD devices is possible. We observe displaced trajectories, where the cells move diagonally on average, and zigzag trajectories, where the RBCs basically follow horizontal streamlines. In the past, RBC deformation was often considered an undesired effect in DLD geometries. On the contrary, our work shows how to take advantage of RBC deformation. For example, it could be used to separate early stage malaria-infected RBCs from healthy ones since the former are usually more rigid than the latter, although both have nearly identical undeformed shapes.
We have further identified the instantaneous lateral RBC extension as a key parameter for cell separation. Since the RBC size depends on Ca, for each row shift d there is a critical capillary number above which the RBC appears sufficiently small to follow the zigzag trajectories and below which it appears so large that it is laterally displaced. For the particular DLD device modelled here, we identified the relevant range of row shifts for RBC separation to be between 3.2 and . Below , all investigated RBCs are displaced and above , all move on zigzag trajectories.
Additionally, we have rationalised the lateral RBC extension, which eventually determines the fate of the cell trajectories, in terms of the extensional component of the shear flow in the region between the pillars. We showed that the lateral RBC extension behaves similarly for the same level of extensional stress, independent of whether this stress is caused by an optical tweezer or the viscous flow in the DLD device. This may help to predict the trajectories of RBCs in hitherto untested DLD geometries and therefore reduce the high level of trial and error involved in their design and calculation.
Our work should therefore help in the design of new DLD setups for deformability-based RBC separation and to understand the trajectories of RBCs in such devices. This may eventually facilitate the design of cheaper, faster and more robust diagnostic devices for the detection of malaria and other diseases.
Several interesting open questions remain which need to be explored before DLD devices become attractive for deformability-based separations. It is expected that the separation efficiency is reduced when the RBC volume fraction becomes large since the streamline distortion will be severe and particle-particle interactions become important. How can the advantages of the DLD design be maintained at large volume fraction? A limitation of the current work is the relatively small channel height H which forces the RBCs to stay aligned with the walls but also increases the flow resistance and risk of clogging. Can RBCs be separated even when H is larger and the RBCs have additional rotational degrees of freedom? How can the remaining device parameters (e.g., pillar shape, diameter, or distance) be optimised? What is the effect of the shape of late-stage malaria-infected or sickle cells? How do realistic RBC size and elasticity distributions affect the separation characteristics?
ACKNOWLEDGMENTS
This work was supported by the EPSRC grant “Large Scale Lattice Boltzmann for Biocolloidal Systems” (Grant No. EP/I034602/1) and the EC-FP7 project “CRESTA” (http://www.cresta-project.eu/; Grant No. 287703). T.K. thanks the University of Edinburgh for the award of a Chancellor's Fellowship. D.H. acknowledges the award of a UCL EPSRC Strategic Enterprise Award (GR/T11364/01) and thanks Professor Gabriel Aeppli and the late Professor Tom Duke for their support while at the London Centre for Nanotechnology. We thank Professor Stefano Guido, Dr. Dmitry Fedosov, and Dr. Prashant Valluri for stimulating discussions.
References
- 1.Guck J., Schinkinger S., Lincoln B., Wottawah F., Ebert S., Romeyke M., Lenz D., Erickson H. M., Ananthakrishnan R., Mitchell D., Käs J., Ulvick S., and Bilby C., Biophys. J. 88, 3689 (2005). 10.1529/biophysj.104.045476 [DOI] [PMC free article] [PubMed] [Google Scholar]
- 2.Suresh S., Spatz J., Mills J., Micoulet A., Dao M., Lim C., Beil M., and Seufferlein T., Acta Biomater. 1, 15 (2005). 10.1016/j.actbio.2004.09.001 [DOI] [PubMed] [Google Scholar]
- 3.Quinn D. J., Pivkin I., Wong S. Y., Chiam K.-H., Dao M., Karniadakis G. E., and Suresh S., Ann. Biomed. Eng. 39, 1041 (2011). 10.1007/s10439-010-0232-y [DOI] [PMC free article] [PubMed] [Google Scholar]
- 4.Pamme N., Lab Chip 7, 1644 (2007). 10.1039/b712784g [DOI] [PubMed] [Google Scholar]
- 5.Gossett D. R., Weaver W. M., Mach A. J., Hur S. C., Tse H. T. K., Lee W., Amini H., and Carlo D. D., Anal. Bioanal. Chem. 397, 3249 (2010). 10.1007/s00216-010-3721-9 [DOI] [PMC free article] [PubMed] [Google Scholar]
- 6.Lenshof A. and Laurell T., Chem. Soc. Rev. 39, 1203 (2010). 10.1039/b915999c [DOI] [PubMed] [Google Scholar]
- 7.Karimi A., Yazdi S., and Ardekani A. M., Biomicrofluidics 7, 021501 (2013). 10.1063/1.4799787 [DOI] [PMC free article] [PubMed] [Google Scholar]
- 8.Chen Y., Li P., Huang P.-H., Xie Y., Mai J. D., Wang L., Nguyen N.-T., and Huang T. J., Lab Chip 14, 626 (2014). 10.1039/c3lc90136j [DOI] [PMC free article] [PubMed] [Google Scholar]
- 9.Karabacak N. M., Spuhler P. S., Fachin F., Lim E. J., Pai V., Ozkumur E., Martel J. M., Kojic N., Smith K., Chen P.-i., Yang J., Hwang H., Morgan B., Trautwein J., Barber T. A., Stott S. L., Maheswaran S., Kapur R., Haber D. A., and Toner M., Nat. Protoc. 9, 694 (2014). 10.1038/nprot.2014.044 [DOI] [PMC free article] [PubMed] [Google Scholar]
- 10.Huang L. R., Cox E. C., Austin R. H., and Sturm J. C., Science 304, 987 (2004). 10.1126/science.1094567 [DOI] [PubMed] [Google Scholar]
- 11.Davis J. A., Inglis D. W., Morton K. J., Lawrence D. A., Huang L. R., Chou S. Y., Sturm J. C., and Austin R. H., P. Natl. Acad. Sci. U.S.A. 103, 14779 (2006). 10.1073/pnas.0605967103 [DOI] [PMC free article] [PubMed] [Google Scholar]
- 12.Inglis D. W., Davis J. A., Austin R. H., and Sturm J. C., Lab Chip 6, 655 (2006). 10.1039/b515371a [DOI] [PubMed] [Google Scholar]
- 13.Loutherback K., Puchalla J., Austin R. H., and Sturm J. C., Phys. Rev. Lett. 102, 045301 (2009). 10.1103/PhysRevLett.102.045301 [DOI] [PubMed] [Google Scholar]
- 14.Loutherback K., Chou K. S., Newman J., Puchalla J., Austin R. H., and Sturm J. C., Microfluid. Nanofluid. 9, 1143 (2010). 10.1007/s10404-010-0635-y [DOI] [Google Scholar]
- 15.Loutherback K., D'Silva J., Liu L., Wu A., Austin R. H., and Sturm J. C., AIP Adv. 2, 042107 (2012). 10.1063/1.4758131 [DOI] [PMC free article] [PubMed] [Google Scholar]
- 16.Liu Z., Huang F., Du J., Shu W., Feng H., Xu X., and Chen Y., Biomicrofluidics 7, 011801 (2013). 10.1063/1.4774308 [DOI] [PMC free article] [PubMed] [Google Scholar]
- 17.Holm S. H., Beech J. P., Barrett M. P., and Tegenfeldt J. O., Lab Chip 11, 1326 (2011). 10.1039/c0lc00560f [DOI] [PubMed] [Google Scholar]
- 18.Inglis D. W., Lord M., and Nordon R. E., J. Micromech. Microeng. 21, 054024 (2011). 10.1088/0960-1317/21/5/054024 [DOI] [Google Scholar]
- 19.Al-Fandi M., Al-Rousan M., Jaradat M. A., and Al-Ebbini L., Rob. Comput. Integr. Manuf. 27, 237 (2011). 10.1016/j.rcim.2010.06.003 [DOI] [Google Scholar]
- 20.Inglis D. W., Davis J. A., Zieziulewicz T. J., Lawrence D. A., Austin R. H., and Sturm J. C., J. Immunol. Methods 329, 151 (2008). 10.1016/j.jim.2007.10.004 [DOI] [PubMed] [Google Scholar]
- 21.Quek R., Le D. V., and Chiam K.-H., Phys. Rev. E 83, 056301 (2011). 10.1103/PhysRevE.83.056301 [DOI] [PubMed] [Google Scholar]
- 22.Beech J. P., Holm S. H., Adolfsson K., and Tegenfeldt J. O., Lab Chip 12, 1048 (2012). 10.1039/c2lc21083e [DOI] [PubMed] [Google Scholar]
- 23.Zhu L., Rorai C., Mitra D., and Brandt L., Soft Matter 10, 7705 (2014). 10.1039/C4SM01097C [DOI] [PubMed] [Google Scholar]
- 24.Ye S., Shao X., Yu Z., and Yu W., J. Fluid Mech. 743, 60 (2014). 10.1017/jfm.2014.22 [DOI] [Google Scholar]
- 25.Succi S., The Lattice Boltzmann Equation for Fluid Dynamics and Beyond ( Oxford University Press, 2001). [Google Scholar]
- 26.Aidun C. K. and Clausen J. R., Annu. Rev. Fluid Mech. 42, 439 (2010). 10.1146/annurev-fluid-121108-145519 [DOI] [Google Scholar]
- 27.Charrier J. M., Shrivastava S., and Wu R., J. Strain Anal. Eng. 24, 55 (1989). 10.1243/03093247V242055 [DOI] [Google Scholar]
- 28.Shrivastava S. and Tang J., J. Strain Anal. Eng. 28, 31 (1993). 10.1243/03093247V281031 [DOI] [Google Scholar]
- 29.Peskin C. S., Acta Numerica 11, 479 (2002) 10.1017/S0962492902000077. [DOI] [Google Scholar]
- 30.Krüger T., Varnik F., and Raabe D., Comput. Math. Appl. 61, 3485 (2011). 10.1016/j.camwa.2010.03.057 [DOI] [Google Scholar]
- 31.Krüger T., Gross M., Raabe D., and Varnik F., Soft Matter 9, 9008 (2013). 10.1039/c3sm51645h [DOI] [PubMed] [Google Scholar]
- 32.Gross M., Krüger T., and Varnik F., Soft Matter 10, 4360 (2014). 10.1039/C4SM00081A [DOI] [PubMed] [Google Scholar]
- 33.Frijters S., Krueger T., and Harting J., “Parallelised Hoshen-Kopelman algorithm for lattice-Boltzmann simulations,” e-print arXiv:1405.1931 [cond-mat, physics.comp-ph].
- 34.Ladd A. J. C., J. Fluid Mech. 271, 285 (1994). 10.1017/S0022112094001771 [DOI] [Google Scholar]
- 35.Evans E. and Fung Y.-C., Microvasc. Res. 4, 335 (1972). 10.1016/0026-2862(72)90069-6 [DOI] [PubMed] [Google Scholar]
- 36.Lipid Bilayers and Red Blood Cells, edited by Gompper G. and Schick M. ( Wiley-VCH, 2008), Vol. 4. [Google Scholar]
- 37.Krüger T., Holmes D., and Coveney P. V., Micro and Nano Flows Conference, 2014. [Google Scholar]
- 38.Krüger T., Kaoui B., and Harting J., J. Fluid Mech. 751, 725 (2014). 10.1017/jfm.2014.315 [DOI] [Google Scholar]


