Abstract
This paper reports a method to control the fluid flow in paper-based microfluidic devices simply by pressing over the channel surface of paper, thereby decreasing the pore size and permeability of a non-woven polypropylene sheet. As a result, fluid resistance is increased in the pressed region and causes flow rate to decrease. We characterize the decrease of flow rate with respect to different amounts of pressure applied, and up to 740% decrease in flow velocity was achieved. In addition, we demonstrate flow rate control in a Y-shaped merging paper and sequential delivery of multiple color dyes in a three-branched paper. Furthermore, sequential delivery of multiple fluid samples is performed to demonstrate its application in multi-step colorimetric immunoassay, which shows a 4.3-fold signal increase via enhancement step.
INTRODUCTION
Conventional lateral flow tests and paper-based assays offer many advantages, including low cost, portability, easy fabrication, and simple operation that involves loading of a liquid sample. Capillary force-activated flow of the liquid through a porous network of the paper eliminates the need for active pumping system, and the test results can be interpreted with the naked eye. By controlling the direction of fluid flow through the paper, multiplexed assays have been demonstrated on paper-based microfluidic devices.1–3 Although the assays provide signals that are visible with the naked eye, further signal amplification can enhance the detection sensitivity.4–6 However, such amplification process usually requires additional steps for the delivery of multiple reagents in a sequential manner for incubation and washing steps, which makes it difficult to design a device that can perform sequential delivery of real samples with a simple one-step procedure.
Recently, several approaches for sequential delivery of fluids in paper-based devices were demonstrated by performing controlled flow rate and timed fluid delivery. For example, paper-based device's channel widths and fluid path lengths were configured to program delivery sequence;7,8 multiple pads were arranged in specific orientation;6,9,10 electromagnet and fluidic diodes were used for timed valving;11,12 paper channel was sandwiched between two films to increase the velocity in the channel;13 and dissolvable barriers were applied for fluidic delays.14,15 However, increasing the width or fluidic path length to decrease flow velocity can result in increased sample consumption and may not be appropriate when dealing with small volume samples such as blood. Moreover, adding multiple pads, installing fluidic valves, covering films over channels, and applying dissolvable barriers resulted in complicated manufacturing processes of paper fluidic devices.
Here, we report a facile method to control the flow rate by applying pressure over a fluidic channel surface made of non-woven polypropylene sheet. Despite being hydrophobic, non-woven polypropylene sheet can be treated with surfactant and has been widely used as a material for wipes and diapers with high absorbency and toughness. A melt-blown fabrication process also allows mass production of the sheet, which is cheaply sold in hundreds of meters in length. In this study, we exploited polypropylene's deformability and the ability to maintain its compressed shape to manipulate the fluid flow through the sheet. By pressing the non-woven sheet, its porous network collapses and thus pore sizes decrease at the compressed area, creating resistance and lowering the flow rate in the pressed channel surface. In addition, we characterized the change of flow velocity due to the applied pressure on the channel surface of paper and demonstrated its application in flow rate control and sequential delivery of multiple fluids in a paper-based microfluidic device. Furthermore, progesterone receptor (PR) was used as a model analyte for one-step colorimetric immunoassay with a signal enhancement step.
DESIGN PRINCIPLE
Assuming infinite sample volume at the source and infinite absorbent pad capacity, flow in a paper of constant cross sectional area can be described by Darcy's law,16
| (1) |
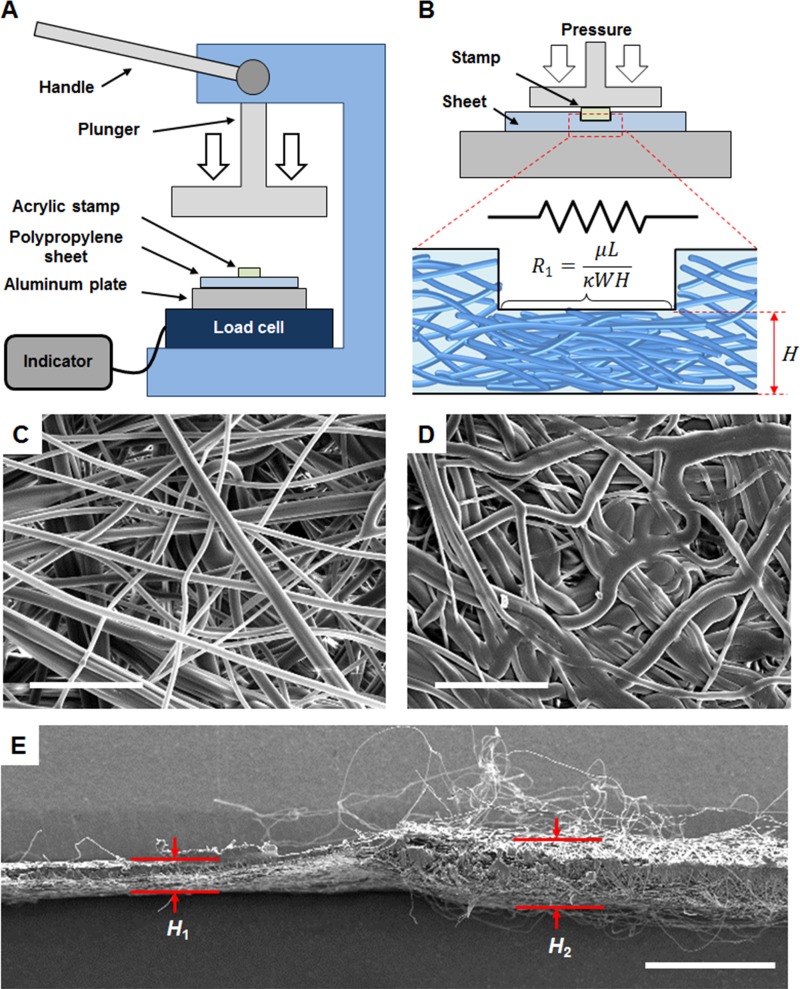
where Q is the volumetric flow rate, κ is the permeability of the porous network, W is the width of the channel, H is the thickness (cross sectional height) of the paper, μ is the viscosity of fluid, L is the length of the pressed region, and ΔP is the pressure difference. By using the analogy to electrical circuits, Q can be considered as the electrical current, ΔP the voltage, and μL/κWH term can be considered as the resistance. The resistance term shows that decrease in the pore size, which translates to the decrease in permeability, results in increased resistance. The decrease in the cross sectional area of the paper, described as WH, also increases the resistance. Thus, by pressing over the channel surface of paper, thereby decreasing the pore size and the cross sectional area, the resistance can increase and the flow rate can be controlled. The pressure plastically deformed the fibers that were originally cylindrical and flattened them, resulting in the collapse of the fibrous network in the sheet pressed with 19.62 MPa pressure (Figure 1). As shown in Figure 1(e), there was a noticeable difference in heights at the pressed (H1 = 153 μm) and the unpressed region (H2 = 285 μm).
FIG. 1.
(a) Schematic setup for making a pressurized paper using a hand press. (b) Schematic of pressed area interpreted as a resistor that controls the fluid flow due to the reduced pore size and the height of the sheet. Scanning electron microscope (SEM) images of (c) top view of an unpressed polypropylene sheet, and (d) top view of polypropylene sheet pressed with 19.62 MPa pressure (scale bars = 50 μm). (e) Cross-section of SEM image of melt-blown polypropylene sheet, when the left side of sheet was pressed with 13.08 MPa and the right side was left unpressed (scale bar = 500 μm).
EXPERIMENTAL
Materials
A melt-blown polypropylene sheet (Sunjin Industry, Nonsan, Korea), which was pretreated with surfactant, was cut into strips, two-branched channels, and three-branched channels with a CO2 laser cutter (Xcut 1610; LASER PIX, Hanam, Korea). 3 mm thick acrylic sheet was also cut with a CO2 laser cutter into a 5 × 5 mm (width and length) square shaped stamp for pressing over the channel surface. The combination of glass fiber conjugate pads (G041; Millipore, Billerica, MA, USA) and sample pads (Grade 319; Ahlstrom, Finland) was used as the inlet for flow rate control experiment. An absorbent pad (Grade 222; Ahlstrom) was used as a wicking pad (outlet) for flow rate experiment and sequential delivery experiments. PR was used as a model analyte for colorimetric immunoassay. All assay materials, including capture antibody, biotin-conjugated detection antibody, and PR, were obtained from the human total progesterone R/NR3C3 ELISA development kit (DYC5415-2; R&D Systems, Minneapolis, MN, USA). 1 μl of PR capture antibody solution (360 μg/ml) was dispensed on nitrocellulose (NC) membrane (CNPC-SS12, 15 μm; Advanced Microdevices Pvt. Ltd, India) and dried for an hour. 5 μl of biotin-conjugated detection antibodies (biotinylated anti-PR antibodies) (18 μg/ml) were interacted with 50 μl of streptavidin-labeled 20 nm diameter gold nanoparticles (AuNPs) (53134; Sigma–Aldrich, St. Louis, MO, USA). Antibody-modified AuNPs were prepared through streptavidin–biotin interaction by incubating the biotinylated antibodies with AuNP for 30 min. Unbound antibodies were washed by removing the supernatant after 30 min centrifugation at 8700 rpm. To prevent nonspecific binding of analytes, PR was prepared using a PBS buffer solution containing 3% BSA (A6003; Sigma–Aldrich) and 0.5% Tween 20 (P9416; Sigma–Aldrich). The signal of gold nanoparticles was enhanced with gold enhancement (GE) solution (2112; Nanoprobes, Inc., Yaphank, NY, USA).
Fabrication of pressed paper
Figure 1(a) shows a schematic of a home-made setup for making a pressurized paper. A load cell (CLS-1 T; Curiosity Technology, Paju, Korea) was placed in the clamping part of the hand press machine, and an indicator (CTI-4100; Curiosity Technology) was connected to the load cell for force quantification. The indicator converts analog signal to digital signal via delta-sigma modulation with 500 s−1 sampling rate. Paper was sandwiched between the acrylic stamp and an aluminum plate, which was placed on top of the load cell. An acrylic stamp was placed on the region of the paper that needs to be pressed (Figure 1(b)). The amount of force delivered using a current setup is accurate to the tenths place (Figure S1 in the supplementary material),17 which showed no significant problem regarding repeatability of the experimental data.
Microfluidic experimental setup
To eliminate any biased effect of fluid interaction with surfaces that may alter the flow velocity, all paper devices were suspended by using a custom made supporting structure (Figure S2 in the supplementary material),17 which is composed of acryl and poly(dimethylsiloxane) (PDMS), so that the fluids flowing through the channel do not interact with any of the surfaces nearby.
Image analysis
The signal intensity at the capture region was measured at the same spot for all time-lapse pictures using ImageJ program. A circle with a diameter of 210 pixels (area = 34 664 pixels) was drawn to enclose the capture region of the NC membrane and the average greyscale value was measured within the circle. Reference intensity was also measured with the same method at 225 pixels upstream of the capture region for each picture and was subtracted from the capture region's intensity for normalization.
RESULTS AND DISCUSSION
Characterization of delayed fluid flow on a pressurized paper
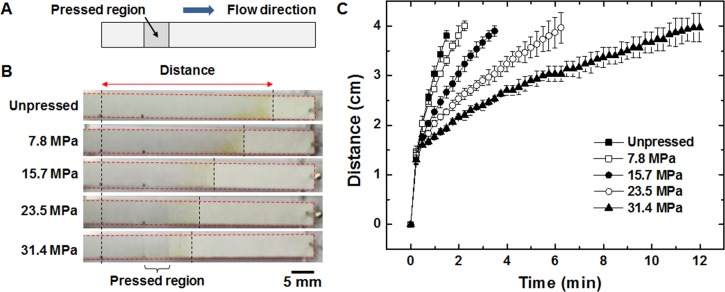
To characterize the effect of applied pressure on flow velocity, the paper strips were partly pressed (Figures 2(a) and 2(b)) with different pressure levels and 300 μl of water was loaded on left end of the strip. Figure 2(b) shows the difference in wetted areas of each strips at 30 s after loading and it is apparent that the water flows slower in the strips that are pressed with higher pressure. The distance between the beginning of pressed region and the water front was measured over time and plotted until water travelled 4 cm. Figure 2(c) shows that the time required for water to reach a given distance increases as the induced pressure increases. As larger amount of pressure is applied, the resistance becomes larger and results in decreased flow rate. This result is in accordance with previous theory18 and an experimental result in which flow rate is decreased in a paper with smaller pore size.19 By pressing the paper strips with 31.4 MPa, the average time required for water to reach 4 cm increased by 740% compared to that in the unpressed paper strips. The curves in Figure 2(c) also reflect Washburn's equation of liquids into a porous body, which describes an inverse relationship between the liquid volume penetrated to the square root of time ().20
FIG. 2.
(a) Schematic of the paper strip with a pressed region. (b) Pictures of water flowing through polypropylene strips that are pressed with varying amounts of pressure. Each picture is taken at 30 s after loading and wetted area appears darker. Fluid front in each strip is at different location due to altered flow rate. (c) The location of fluid front plotted with respect to time for all strips (n = 3).
Effect of pressurized paper in a Y-shaped merging paper
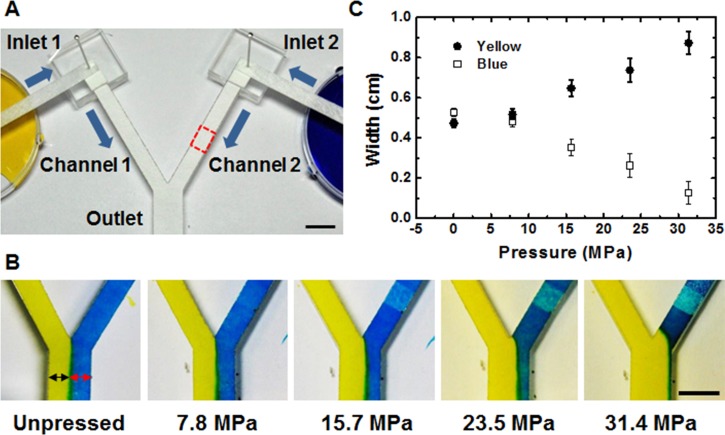
To demonstrate the flow rate control, Y-shaped channel as shown in Figure 3(a) was designed and one of its channels (part of channel 2, indicated by red box) was pressed with varying pressure. Yellow and blue dye solutions were loaded by dipping each inlet branches and the controlled flow was visualized by observing the laminar flow profile. The difference in length between the dye source and the junction of the two inlets can cause a difference in flow rate,16 thus the lengths and widths of the inlets and channels of both sides are designed to be equal. By pressing the part of channel 2 and creating resistance in the channel, blue dye's flow rate was effectively decreased. The effect of the controlled flow was quantified by comparing the width of each color in the laminar flow profile (indicated by arrows in Figure 3(b)) at the conjoined channel. As more pressure is applied on channel 2, more resistance is created and the corresponding decreased flow rate of blue dye is shown by the decreased width of the dye. Figure 3(c) shows an inverse relationship of the thickening yellow dye and thinning blue dye with increasing pressure.
FIG. 3.
(a) Setup of Y-shaped strip showing dye reservoir for passive, capillary force-based loading and pressed region indicated by red box. (b) Laminar flow profile of the dyes with increasing pressure. (c) Graph showing the width of yellow and blue dyes observed at the conjoined channel with respect to the pressure applied on channel 2 (n = 3). All scale bars = 10 mm.
Sequential delivery of multiple fluids on a three-branched paper
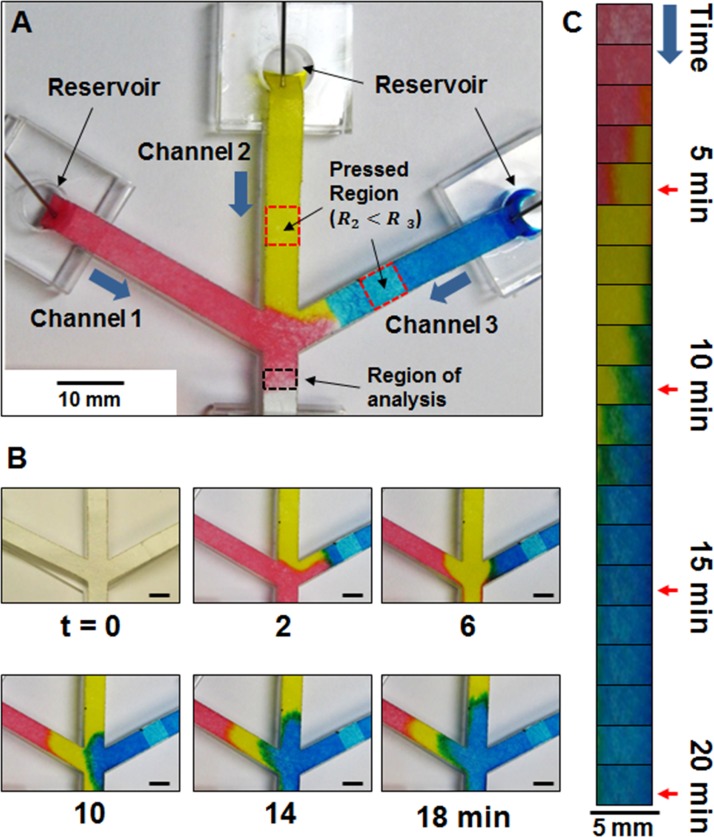
Furthermore, to demonstrate its application in controlled sequential delivery of multiple fluids, three-branched channel was designed with a conjoined channel (Figure 4(a)). In order to deliver multiple dye solutions in desired order, channels 2 and 3 were pressed with 15.7 and 31.4 MPa, respectively, and channel 1 was left unpressed. The PDMS portion of the support was modified (punctured with biopsy punch) to include a dye reservoir. The device was pinned so that the tip of each branch touches the bottom of the reservoir and all reservoirs were loaded simultaneously by using three separate pipettes. Each pipette was loaded with different color dyes and the volume of dye solution loaded to each reservoir was the same (70 μl) in order to eliminate any biased effect of sample depletion. Pictures were taken every 1 min and Figure 4(b) shows that the red dye flows out first, then the yellow dye flow out afterwards. Red dye is able to reach the region of analysis first by flowing through channel 1, which has relatively low resistance compared to channel 2 (pressed with 15.7 MPa). Yellow dye begins to reach the region of analysis around 5th min and cuts off the red dye's flow. The blue dye then starts to reach the region of analysis around 10th min due to the largest resistance created by pressing the channel with the highest pressure (31.4 MPa).
FIG. 4.
(a) Setup of three-branched channel with their ends dipped in dye reservoirs. Pressed regions are indicated by red box. Channels 2 and 3 are pressed with 15.7 and 31.4 MPa, respectively. (b) Time-lapse pictures of the dyes flowing through the channels (scale bars = 5 mm). (c) Images of “the region of analysis” (see panel (a)) cropped and arranged in series with respect to time.
Images at the region of analysis indicated in Figure 4(a) were arranged in series to show the color change over time. As shown in Figure 4(c), the color at the region of analysis changes sequentially in the intended order (from red, to yellow, to blue), and the duration at which each dye spent time in the region increases with increasing pressure. It is interesting to note that the total time, which takes for each color dye to enter the region of analysis and disappear, is 5 min for red dye, 9 min for yellow dye, and 15 min for blue dye. Thus, the resistance created by pressing the channel not only controls the order at which dyes are delivered but also increases the time spent in the paper channel by decreasing the volumetric flow rate.
Demonstration of one-step signal enhancement based on sequential sample delivery
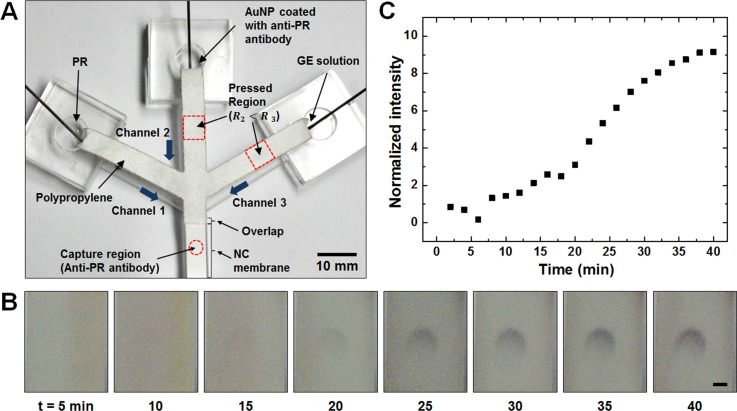
An experiment was performed to observe an enhanced immunoassay signal by sequentially delivering simultaneously loaded antigen, AuNP, and GE solution. To demonstrate an immunoassay and signal enhancement, PR was used as a model analyte and anti-PR antibody coated AuNP was used for detection and its signal was enhanced by using GE solution. Anti-PR capture antibody was immobilized on NC membrane, which was then attached to the bottom part of the polypropylene device as shown in Figure 5(a). NC membrane was chosen for its wide use in current lateral flow immunoassay systems and its high binding capacity for proteins. The membranes were taped from the back side and overlapped like the layering configuration of multiple pads in a typical lateral flow immunoassay strip. A desirable sequence of immunoreaction is to have PR analytes captured first, then be labeled by AuNP, and then have the detection signal increase via gold enhancement. The labeled AuNP, whose absorption wavelength is 520 nm, appears red at the capture region of the NC membrane in the presence of captured antigen. Gold ions in the enhancer solution then aggregate onto the AuNP, which acts as a nucleation site, and increase the size of the nanoparticle. The increase in nanoparticle size shifts the absorbed wavelength to longer wavelengths (towards red), which results in darker blue or purple color due to the reflection of shorter wavelengths. Thus, the AuNP alone appears as faint red signal, and the signal turns into darker blue color with enhancer solution treatment.
FIG. 5.
(a) Setup of three-branched channel for immunoassay demonstration. Channels 2 and 3 are pressed with 15.7 and 31.4 MPa, respectively, as was done for the device in Figure 4. (b) Time-lapse pictures showing color change at the capture antibody region (scale bar = 1 mm). (c) Graph showing the change in average greyscale value at the capture region.
To perform the assay in the desired order, channels 2 and 3 were pressed with 15.7 and 31.4 MPa, respectively, and channel 1 was left unpressed to allow sequential fluid delivery (Figure 5(a)). PR (50 ng/ml), AuNP, and GE solution (the same volume for all) were loaded into their respective individual reservoirs simultaneously using three pipettes. Figure 5(b) shows the change in the intensity of the detection signal over time. Fifteen minute after the assay, AuNP signal is barely visible by the naked eye and it is difficult to determine the presence of PR. The signal turns more vivid after GE solution starts to flow. The capture region's intensity is greater at the top of the circle as the antigens are first contacted with the antibodies that are located near the upstream. A similar pattern was observed in a previous study.10 The intensity at the capture region was analyzed with ImageJ program and plotted as shown in Figure 5(c). The plot shows that there is no increase in the signal during antigen binding (the first 6 min). As AuNP starts to label the captured antigens (7–14 min), the average greyscale intensity increases. The signal is then further intensified as the enhancer solution flows (15–40 min) due to enlargement of the AuNPs. The intensity of enhanced signal appears to saturate near 40 min after loading and the intensity observed at 40th min was about 4.3 times stronger compared to the intensity observed at 14th min. This result shows that multi-step assay can be used to clarify ambiguous signal intensity and helps determine the presence of target antigens that exist in low amount just as it was difficult to determine the presence of PR from AuNP signal alone (Figure 5(b)). Further optimizations of parameters such as capture antibody amount, AuNP amount, and channel dimension are expected to shorten the time required for the assay and signal enhancement.
CONCLUSIONS
In this work, we have described a method to control flow rate in a paper-based microfluidic device by simply applying pressure over the channel surface. The effect of pressure on flow velocities in non-woven polypropylene sheets was characterized, then its application in flow rate control was demonstrated by visualizing the laminar flow of two dye solutions. The delayed fluid flow due to increased channel resistance was applied to demonstrate sequential delivery of multiple fluids in a three-branched channel with color dyes. Furthermore, a multi-step colorimetric immunoassay that can perform signal enhancement was carried out by one-step loading of multiple reagents and demonstrated its potential application in bioassay and detection. The result shows that construction of paper-based device is possible by using pressed polypropylene branches as a module that controls flow rate and a nitrocellulose membrane for color display. Further studies include assessment of colorimetric assays by immobilizing antibodies directly on polypropylene material and comparing its color display ability to that of NC membrane. Such experiments should be performed with well-established protocols to avoid any biased effect that may occur from differences in, for example, antibody immobilization mechanisms, paper thickness, and binding capacity of each substrate. Nevertheless, current results show facile fabrication method for paper-based device that can perform multi-step immunoassay with one-step loading of multiple reagents. We expect this technology to contribute to the field of paper-based microfluidics and facilitate the development of automated lateral flow tests and point-of-care testing.
ACKNOWLEDGMENTS
This research was supported by a Cooperative Research Program for Agricultural Science and Technology Development (Grant No. PJ009842) supported by the Rural Development Administration of Korea, and by a National Leading Research Laboratory Program (Grant No. NRF-2013R1A2A1A05006378) through the National Research Foundation of Korea funded by the Ministry of Science, ICT and Future Planning.
References
- 1.Martinez A. W., Phillips S. T., Butte M. J., and Whitesides G. M., Angew. Chem., Int. Ed. 46, 1318 (2007). 10.1002/anie.200603817 [DOI] [PMC free article] [PubMed] [Google Scholar]
- 2.Martinez A. W., Phillips S. T., Nie Z., Cheng C.-M., Carrilho E., Wiley B. J., and Whitesides G. M., Lab Chip 10, 2499 (2010). 10.1039/c0lc00021c [DOI] [PubMed] [Google Scholar]
- 3.Martinez A. W., Phillips S. T., and Whitesides G. M., Proc. Natl. Acad. Sci. U.S.A. 105, 19606 (2008). 10.1073/pnas.0810903105 [DOI] [PMC free article] [PubMed] [Google Scholar]
- 4.Zhang C., Zhang Y., and Wang S., J. Agric. Food Chem. 54, 2502 (2006). 10.1021/jf0531407 [DOI] [PubMed] [Google Scholar]
- 5.Cho I.-H., Seo S.-M., Paek E.-H., and Paek S.-H., J. Chromatogr. B 878, 271 (2010). 10.1016/j.jchromb.2009.07.016 [DOI] [PubMed] [Google Scholar]
- 6.Fu E., Liang T., Houghtaling J., Ramachandran S., Ramsey S. A., Lutz B., and Yager P., Anal. Chem. 83, 7941 (2011). 10.1021/ac201950g [DOI] [PMC free article] [PubMed] [Google Scholar]
- 7.Fu E., Lutz B., Kauffman P., and Yager P., Lab Chip 10, 918 (2010). 10.1039/b919614e [DOI] [PMC free article] [PubMed] [Google Scholar]
- 8.Apilux A., Ukita Y., Chikae M., Chailapakul O., and Takamura Y., Lab Chip 13, 126 (2013). 10.1039/c2lc40690j [DOI] [PubMed] [Google Scholar]
- 9.Joung H.-A., Oh Y. K., and Kim M.-G., Biosens. Bioelectron. 53, 330 (2014). 10.1016/j.bios.2013.10.004 [DOI] [PubMed] [Google Scholar]
- 10.Park S., Kim Y. T., and Kim Y.-K., BioChip J. 4, 110 (2010). 10.1007/s13206-010-4204-y [DOI] [Google Scholar]
- 11.Li X., Zwanenburg P., and Liu X., Lab Chip 13, 2609 (2013). 10.1039/c3lc00006k [DOI] [PubMed] [Google Scholar]
- 12.Chen H., Cogswell J., Anagnostopoulos C., and Faghri M., Lab Chip 12, 2909 (2012). 10.1039/c2lc20970e [DOI] [PubMed] [Google Scholar]
- 13.Jahanshahi-Anbuhi S., Chavan P., Sicard C., Leung V., Hossain S. Z., Pelton R., Brennan J. D., and Filipe C. D., Lab Chip 12, 5079 (2012). 10.1039/c2lc41005b [DOI] [PubMed] [Google Scholar]
- 14.Jahanshahi-Anbuhi S., Henry A., Leung V., Sicard C., Pennings K., Pelton R., Brennan J. D., and Filipe C. D., Lab Chip 14, 229 (2014). 10.1039/c3lc50762a [DOI] [PubMed] [Google Scholar]
- 15.Lutz B., Liang T., Fu E., Ramachandran S., Kauffman P., and Yager P., Lab Chip 13, 2840 (2013). 10.1039/c3lc50178g [DOI] [PMC free article] [PubMed] [Google Scholar]
- 16.Osborn J. L., Lutz B., Fu E., Kauffman P., Stevens D. Y., and Yager P., Lab Chip 10, 2659 (2010). 10.1039/c004821f [DOI] [PMC free article] [PubMed] [Google Scholar]
- 17.See supplementary material at http://dx.doi.org/10.1063/1.4899773E-BIOMGB-8-026405 for a detailed description of the experimental setup (Figs. S1 and S2).
- 18.Katz A. and Thompson A., Phys. Rev. B 34, 8179 (1986). 10.1103/PhysRevB.34.8179 [DOI] [Google Scholar]
- 19.Hwang H., Kim S.-H., Kim T.-H., Park J.-K., and Cho Y.-K., Lab Chip 11, 3404 (2011). 10.1039/c1lc20445a [DOI] [PubMed] [Google Scholar]
- 20.Washburn E. W., Phys. Rev. 17, 273 (1921). 10.1103/PhysRev.17.273 [DOI] [Google Scholar]
Associated Data
This section collects any data citations, data availability statements, or supplementary materials included in this article.
Data Citations
- See supplementary material at http://dx.doi.org/10.1063/1.4899773E-BIOMGB-8-026405 for a detailed description of the experimental setup (Figs. S1 and S2).


