Abstract
Measurement and control of pressure-driven flow (PDF) has a great potential to enhance the performance of chemical and biological experiments in Lab on a Chip technology. In this paper, we present an optofluidic flow sensor for real-time measurement and control of PDF. The optofluidic flow sensor consists of an on-chip micro Venturi and two optical Fabry-Pérot (FP) interferometers. Flow rate was measured from the fringe shift of FP interferometers resulted from movement fluid in the on-chip micro Venturi. The experimental results show that the optofluidic flow sensor has a minimum detectable flow change of 5 nl/min that is suitable for real time monitoring and control of fluids in many chemical and biological experiments. A Finite Element Method is used to solve the three dimensional (3D) Navier–Stokes and continuity equations to validate the experimental results.
I. INTRODUCTION
Over the last decade, research in microfluidic devices has grown dramatically and led to the rapid development of Lab-On a Chip (LOC) and Micro Total Analysis systems (μTAS) due to the unique advantages of microfluidic devices such as very short analysis time, dramatic reduction in sample consumption, high throughput, automation, and portability compared with macroscopic fluidic processes.1,2 On the other hand, integrating microfluidic systems with optics has led to the emergence of optofluidic field that can incorporate novel functionalities into LOC platforms such as measurement and control of fluids in real-time.3–5
Pressure driven flow (PDF) is the most important transport mechanism of fluid in the microfluidic devices. On the other hand, real time measurement and control of PDF rate are a vital requirement in LOC and μTAS6 for precise loading and handling of biological or chemical samples,7 particle sorting and separation,8–10 air and liquid droplet-based system,11 mixing,12,13 chemical synthesis,14,15 and flow cytometry.16 Various flow sensors have been studied by a large number of research groups who integrated micro-electro-mechanical systems (MEMS) with microfluidic devices.
Thermal flow sensors are the most common ones and work based on heat transfer detection.17–20 The complex structure of thermal flow sensors has limited their integration with microfluidic systems. Non-thermal or mechanical flow sensors have a moving mechanical structure such as cantilever, spring and membrane.5,21–23 Detection and working principle in the mechanical flow sensors can be obtained by many effects such as piezoresistivity and piezoelectricity. Optical methods have been studied by several groups. Lien and Vollmer fabricated a tapered fiber to measure the flow rates ranging from 0 to 1500 ml/min. Drag force of laminar flow causes displacement of the tapered fiber and decreases the light intensity transmitted through the fiber taper into a multi-mode fiber. The authors offered the flow sensor for high throughput applications such as flow cytometry and particle sorting/counting.24 Song and Psaltis demonstrated a micro Venturi air flow sensor based on image processing of Newtonian rings for measuring the air flow rate in the range of 0–2 mg/s.25 Lee et al. proposed an air gap fiber Fabry–Pérot Interferometer (AG-FFPI) for highly sensitive micro-air flow sensing in the range of 0–1.2 m/s.26 Recently, our group has presented a cantilever-based optofluidic flow sensor for real-time measurement of flow rate in micro fluidic devices with 1.3 μl/min resolution.13
In this paper, we present the integration of an on-chip micro Venturi channel with two optical fibers as an effective solution to provide accurate detection of flow rate and real-time control of PDF rate in complex micro fluidic devices. The base of detection in our optofluidic flow sensor is interferometery of two FP's gaps during movement of flow through micro Venturi channel. According to the fact that the on-chip micro Venturi has been applied by researchers in electronically controlled pressure micro regulator,27 continuous glucose monitoring,28 precise liquid aspiration,29 and injection of micro-particles for epidermal vaccination,30 our on-chip micro Venturi not only is useful in sensing and control of flow rate in microfluidic devices, but also is appropriate for the mentioned applications.
II. THEORY AND DESIGN
A. On-chip micro Venturi
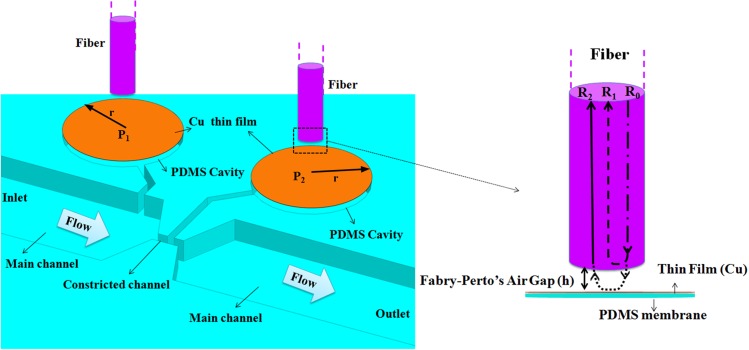
Figure 1(a) shows the basis of the on-chip PDMS (Polydimethylsiloxane) micro Venturi that consists of an inlet/outlet, main channel (550 μm width), constricted channel (50 μm width and 120 μm length), and two PDMS cavities (500 μm diameter). Two PDMS cavities were covered by two thin PDMS membranes (8 μm and 20 μm thickness) and were connected to the main and constricted channels by two microchannels (30 μm width). The distance between inlet and outlet is 1 cm. As the fluid moves from inlet to outlet, pressure magnitude considerably changes.
FIG. 1.
The schematic of (a) on-chip mico Venturi including the main/constricted channels, two PDMS micro cavities in front of which two optical fibers have been placed (b) lateral view of FP interferometer which includes the optical fiber and PDMS membrane with thin film coating (Cu).
According to Bernoulli's equation, the square root of the produced pressure difference between the main channel (P1) and the constricted channel (P2) of the micro Venturi is proportional to the inlet flow rate31
| (1) |
where ΔP = P1 − P2 is pressure difference, and α is a coefficient which depends on the cross section of the channel and fluid density. Equation (1) is obtained from energy conservation. In the micro scale, there is a pressure drop due to viscous energy dissipation between the main and the constricted channels. This pressure drop is directly proportional to the inlet flow rate, the distance between the main and the constricted channels and is inversely proportional to the hydraulic diameter of the main and the constricted channels. Pressures P1 and P2 in the main and constricted channels are applied to two micro cavities through two micro channels and therefore deflect two PDMS membranes as follows:32
| (2) |
where r and t are the radius and thickness of PDMS membrane, and ν, E are the Poisson's ratio and Young's modulus of PDMS, respectively. Equation (2) is valid only when the deflection of the PSMS membrane is no more than 30% of its thickness.
B. The principle of FP operation
We measure the deflection of two PDMS membranes (Δh) using interferometery of Fabry-perot air gap (FPAG). Two optical fibers were placed in front of two PDMS membranes (Fig. 1(a)). The air gap between the two optical fibers and PDMS membranes forms a FP interferometer. Figure 1(b) shows the working principle of FPAG. Deflection of PDMS membranes changes the distance of air gap and therefore changes interferometeric spectrum of FPAG.
The source light (R0) in the fiber (dash-dot line) is partially reflected (R1) at the end face of the fiber (dash line). The rest of the source light enters the air gap (dot line) and after passing the air gap reaches PDMS membrane and is reflected back from the membrane and then a portion of it (R2) is coupled with the optical fiber (solid Line). From the interference of R1 and R2, an interferometric spectrum with intensity of R can be obtained as follows:5,21
| (3) |
where nd, λ0, and φ0 are optical path difference (air gap), the central wavelength of the source light, and the initial phase difference, respectively. The maxima or minima of the interferometeric spectrum in Eq. (3) occur when an integer number of half-wavelength (n) fits with distance of air gap namely h = n(λn/2). Therefore, the spectral shift (Δλ) of a given minimum in the interferometeric spectrum is proportional to the change of the air gap or deflection's membrane Δh = n (Δλn/2). Therefore, pressure in the two cavities is proportional to spectral shift
| (4) |
According to Eqs. (1) and (2), flow rate is proportional to the square root of fringe shift resulted from the deflection of two PDMS membranes,
| (5) |
The distance of air gap is calculated from the wavelengths (λ1 > λ2) of two adjacent minima (maxima) in the interferometeric spectrum as5,21
| (6) |
III. MATERIALS AND METHODS
A. Fabrication of optofluidic flow sensor
Soft lithography technique was used to fabricate the optofluidic flow sensor. The master mold of the micro Venturi was made on a 40 μm thick SU-8 photoresist (MicroChem Corporation 2050) using a standard photolithographic technique. A PDMS (Dow Corning Corp., USA) solution with a weight ratio of 10:1 (base: hardener) was poured, after degassing, on the master mold. PDMS was cured at 90 °C for 30 min in oven. The replicated PDMS micro Venturi was obtained by its being peeled off from the master mold. Two PDMS membrane pairs with thicknesses 8 μm and 20 μm were fabricated by spin coating method. Each fabricated membrane pair, after being backed in the oven, was coated with an ultra thin layer copper with thickness 80 nm by physical vapor deposition (PVD) method to improve their surface reflectivity. Each coated membrane pair was bounded to the PDMS micro Venturi using oxygen plasma. The inlet and outlet were also punched on the chip.
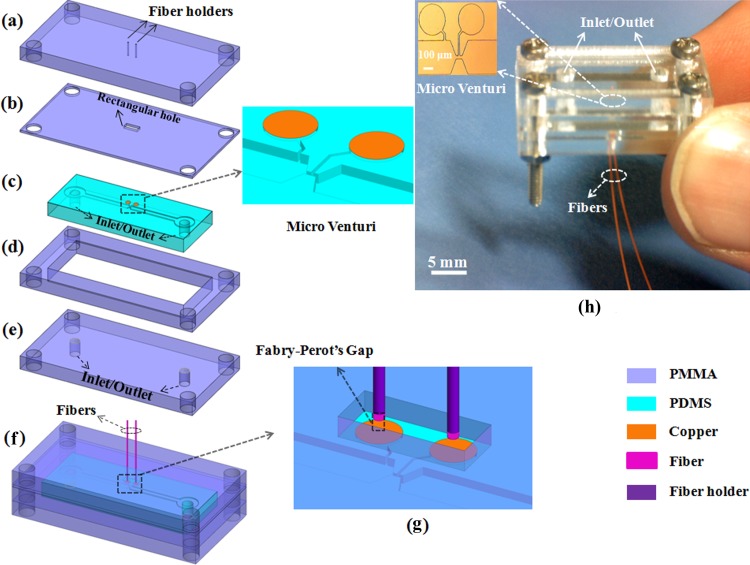
We designed and fabricated a jig composed of four tailored PMMA (Poly (methyl methacrylate)) pieces to facilitate the optical measurement of the microflows and to improve the robustness of the optofluidic flow sensor. Figures 2(a), 2(b), 2(d), and 2(e) show the exploded view of the jig. The PMMA pieces along with inlet/outlet (Figs. 2(a), 2(b), 2(d), and 2(e)) were cut using a CO2 laser (SYNRAD 48-series) and cleaned by lens tissue and IPA (isopropyl alcohol) solution. The PDMS micro Venturi (Fig. 2(c)) was placed between the two PMMA pieces (Figs. 2(b) and 2(d)).
FIG. 2.
The optofluidic flow sensor (a)–(e) exploded view of the optofluidic flow sensor including four tailored PMMA pieces and PDMS micro Venturi; (f) schematic view of the assembled optofluidic flow sensor; (g) closed view of FP gap; (h) photograph of the fabricated optofluidic flow sensor. (The inset is the optical microscope image of on-chip micro Venturi).
Two holes as fiber holder with 130 μm diameter and 80 μm distance separation were drilled on the PMMA piece by the CO2 laser (Fig. 2(a)) to ensure easy and precise alignment of two optical fibers with two PDMS membranes. The PMMA piece in Fig. 1(b) only allows the deflection of the two membrane regions (rectangular hole) and is also used as a spacer for adjustment of the air gap distance. The air gap distance is controlled by the movement of two optical fibers in Z-direction by a motorized stage with 100 nm resolution in real time by a LabVIEW program.
The custom LabVIEW program reads out the interferometric spectrum and calculates the air gap distance using Eq. (2) and by giving feedback to the motorized stage adjusts the air gap distance. After adjusting the air gap distance, the fibers were secured to the fiber holder (Fig. 2(f)) by UV curing adhesive. The tailored PMMA pieces along with PDMS micro Venturi were packed by four bolts to prevent fluid leakage. Figs. 2(f) and 2(h) show the schematic and the fabricated optofluidic flow sensor. The inset in Fig. 2(h) is the optical microscope image of the fabricated on-chip micro Venturi.
B. Experimental set up
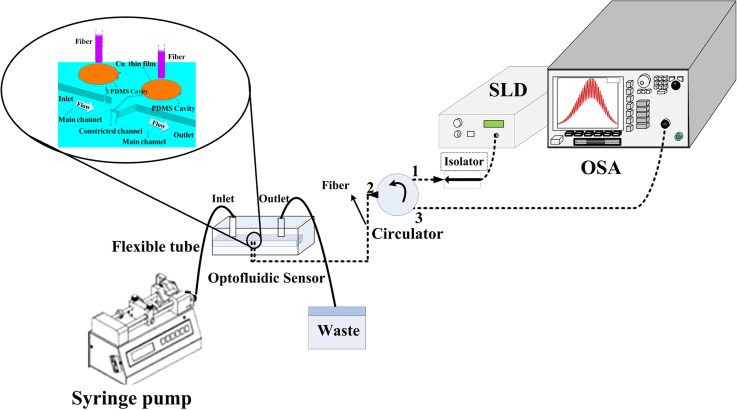
Fig. 3 shows the experimental setup used for real-time measurement of PDF rate. The light of the SLD (Super luminescent diode, Thorlabs S5FC1005SXL) source was coupled with the optofluidic flow sensor using a single-mode optical fiber and a circulator. In order to measure and analyze the fringe shift, the light reflected from the membrane deflection was sent through the circulator to an optical spectrum analyzer (OSA, Agilent 86143B) with the resolution of 10 pm. The fluid entered the optofluidic flow sensor by a programmable syringe pump (New Era Pump NE-4000) and then exited toward waste. The experiments were performed at two flow ranges for two optofluidic flow sensors.
FIG. 3.
Experimental setup.
Flow range 0–1 μl/min with step 0.05 μl/min was selected for micro Venturi with membrane pair of 8 μm thickness, and flow range 0.5–10 μl/min with step 0.5 μl/min was selected for micro Venturi with membrane pair of 20 μm thickness.
The custom LabVIEW program measured the fringe shift of two air gaps (pressure difference) resulted from PDF. The LabVIEW program can give feedback to the syringe pump in order to control the flow rate in the micro channel with high resolution.
IV. RESULTS AND DISCUSSIONS
A. Numerical results
In order to investigate the behavior of the fluid and the membrane deflection in the channel, three dimensional Navier-Stokes, continuity (Eq. (7)) equations were solved,
| (7) |
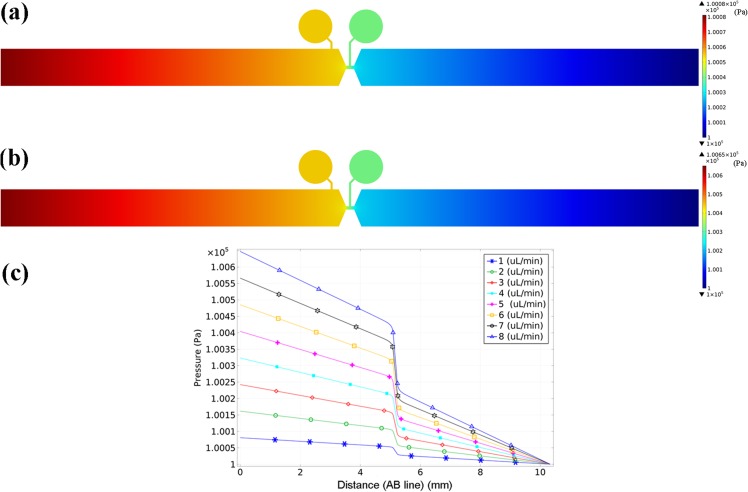
In these equations, ρ, u, p, and η are fluid density, velocity, pressure, and dynamic viscosity, respectively. A finite element analysis (FEA) based solver (Comsol Multiphysics) was applied for simulating pressure distribution in the sensor. Boundary conditions are laminar flow in the inlet, atmosphere pressure in the outlet and no slip boundary on the inside walls. Simulation parameters for PDMS and water are shown in Table I. Figure 4(a) shows the pressure distribution in the on-chip mico Venturi at flow rate 1 μl/min. Fig. 4(a) shows that the cavity close to the inlet (left cavity) has more pressure magnitude than the one near to the outlet (right cavity).
TABLE I.
Parameters for simulation of membrane and water in the channel (standard conditions of 20 °C and 1 atm).
| Parameters | PDMS (unit) | Water (unit) |
|---|---|---|
| Dynamic viscosity | … | 1.002 × 10⁻³ (Pa s) |
| Density | 970 (kg m−3) | 1000 (kg m−3) |
FIG. 4.
(a) and (b) Pressure distribution in the on-chip micoVenturi at flow rates of 1 μl/min and 8 μl/min, respectively. (c) Variation of pressure magnitude versus distance from inlet toward outlet at flow rates of 1, 2, 3, 4, 5, 6, 7, and 8 μl/min.
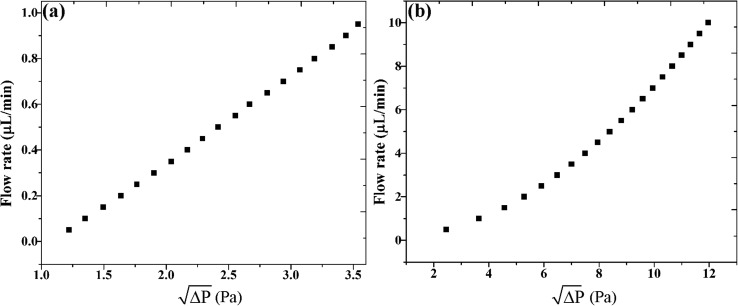
Figure 4(b) shows pressure magnitude variation versus distance from inlet toward outlet at flow rates 1, 2, 3, 4, 5, 6, 7, and 8 μl/min. The relation of flow rate versus the square root of pressure difference between the main and constricted channels is shown in Fig. 5. As can be seen, the flow rate variation versus pressure difference between the main and constricted channels has a linear behaviour for the low flow rate of 0.1–1 μl/min. For the flow rate of 0.5–10 μl/min, the relation of flow rate versus the square root of pressure difference is linear for 0.5–3 μl/min and is deviated from linear behaviour for flow rates of more than 3 μl/min. As mentioned in Theory and Design section, due to viscous energy dissipation between the main and the constricted channels, there is a pressure drop that is directly proportional to the inlet flow rate, the distance between the main and the constricted channels and is inversely proportional to the hydraulic diameter of the main and the constricted channels. For a constant geometry according to Fig. 5, in low flow rate of (0.5–10 μl/min), the relation of flow rate versus the square root of pressure difference between the main and constricted channels is linear. However, with an increase of the flow rate (more than 3 μl/min) and therefore increase of viscous energy dissipation, the relation of flow rate versus the square root of pressure difference is deviated from linear behaviour.
FIG. 5.
The relation of flow rate versus the square root of pressure difference of two cavities (a) for flow rate range of 0.5–1 μl/min and (b) for flow rate range of 0.5–10 μl/min.
B. Experimental results
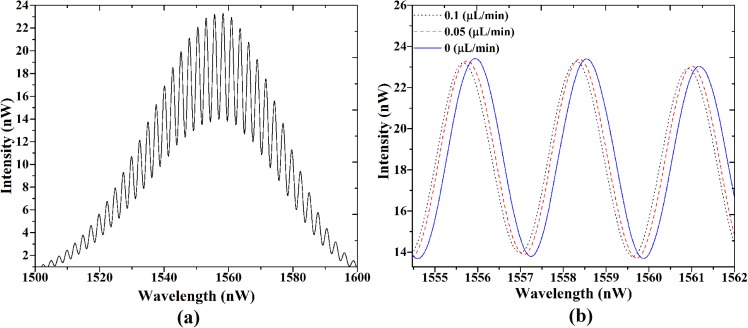
At first the optofluidic flow sensor was filled with DI water and the interferometeric spectrum was recorded as a reference spectrum. Figure 6(a) shows the Gaussian-shaped SLD spectrum, which is modulated by the FP's interference pattern (reference spectrum). By injecting various flow rates, the pressures of the main and constricted channels deflect the two PDMS membranes and therefore change the air gap distance (Δhi). As mentioned, this would cause a shift in the interferometeric spectrum.
FIG. 6.
(a) Interferometeric spectrum at zero flow rate (reference spectrum) and (b) the shift of one maximum of interferometeric spectrum at input flow rates of 0, 0.05, and 0.1 μl/min.
By increasing the flow rates, two membranes move more toward the optical fiber so that the air gap distance decreases. Consequently, the interferometeric spectrum shifts to smaller wavelengths according to Eq. (2). The three peaks of the interferometeric spectrum are shown in Fig. 6(b) at flow rates 0, 0.05, and 0.1 μl/min.
1. Sensitivity of the optofluidic flow sensor
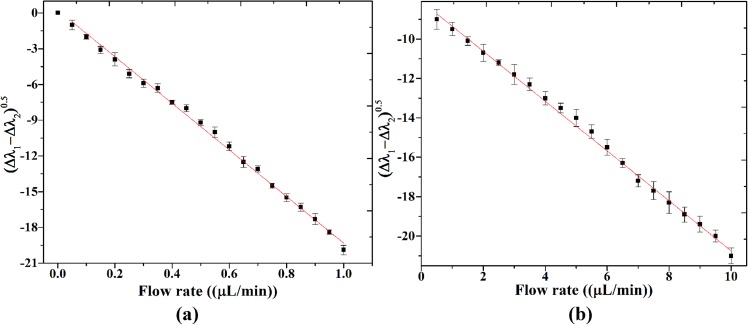
The calibration curves of the sensors are shown in Fig. 7. The interferometeric spectrum shift (Δλi) resulted from membrane deflection for each cavity is obtained by subtracting the reference spectrum at zero flow rate from new interferometeric spectra at flow rates of 0–1 μl/min and 0.5–10 μl/min. The Y-axis in Fig. 7 is difference of the interferometeric spectrum shift (Δλi) resulted from two cavities. As Fig. 7 shows the optofluidic flow sensor with thin 8 μm and thick 20 μm membranes has a linear sensitivity equal to 1.93 nm.(μl/min)−1 and 125 pm (μl/min)−1. The optofluidic flow sensor with the thin membrane has a better sensitivity than the optofluidic flow sensor with the thick one. In other words, the optofluidic flow sensor with the thin membrane is suitable for low flow rate ranges.
FIG. 7.
The calibration curves of two sensors (a) thin membrane for flow rate from 0.5 to 1 μl/min and (b) thick membrane for flow rate range from 0.5 to 10 μl/min.
2. Minimum detectable flow change
Minimum detectable flow change or resolution of the optofluidic flow sensor was determined from the resolution of the OSA and the sensitivity of the optofluidicflow sensor. Since the spectral resolution of the OSA was 10 pm and sensitivity of the optofluidic flow sensor are equal to 1.93 nm (μl/min)−1 (for the thin membrane) and 125 pm (μl/min)−1 (for the thick thin membrane), therefore the minimum detectable flow change is equal to 0.005 μl/min for the thin membrane and is equal to 0.08 μl/min for the thick one. These minimum detectable flow changes (resolutions) are comparable with Ref. 34 and are better than those of Refs. 5, 24, and 33 which were 1.3 μl/min, 6.1, 35 μl/min, respectively.
3. Control of flow rate
A custom LabVIEW program was used to measure and control the flow rate in the optofluidic flow sensor. At first a given flow rate was injected to the optofluidic flow sensor by programmable syringe pump. The interferometeric spectrum was recorded and using the obtained calibration curves the flow rate was measured in our optofluidic flow sensor. The flow rate was controlled by programmable syringe pump with resolution of 0.005 μl/min. The syringe pump performed the control was done by receiving feedback from the LabVIEW program. This capability is suitable for real-time feedback in complex lab-on-chip applications such as flow cytometry,35 particle sorting, separation,36 liquid droplet-based system,11 mixing,12 and chemical synthesis.14
V. CONCLUSION
An optofluidic flow sensor was presented for real-time measurement and control of PDF rate. The optofluidic flow sensor consists of two optical fibers, an on-chip micro Venturi including main and constricted microchannels and two PDMS cavities that are covered by two PDMS membranes. The air gap between optical fibers and membranes forms a FP interferometer. A numerical analysis based on FEA was performed to solve the three dimensional (3D) Navier–Stokes, and the results showed that the pressure difference resulted from the flow movement in on-chip micro Venturi causes deflection of two PDMS membranes. Pressure difference causes a change in liquid volume of two cavities connected to the main and constricted channels which in turn deflects the two PDMS membranes. The deflection of the two PDMS membranes is proportional to the flow rate and was measured from the fringe shift of FP's interferometric spectrum. A simple soft lithography along with a simple packing was used to fabricate the optofluidic flow sensor. The experimental results showed that our optofluidic flow sensor has a minimum detectable flow change of 5 nl/min and 80 nl/min at two flow rate ranges of 0.1 and 0.5–10 μl/min, respectively. In addition, a custom LabVIEW program was used to control and manipulate the flow rate by a programmable syringe pump.
ACKNOWLEDGMENTS
The authors would like to offer special thanks to Dr. Arash Moradi for his helpful editorial comments and discussions for improving the quality of the paper.
References
- 1.Mark D., Haeberle S., Roth G., von Stetten F., and Zengerle R., Chem. Soc. Rev. 39, 1153 (2010). 10.1039/B820557B [DOI] [PubMed] [Google Scholar]
- 2.Arora A., Simone G., Salieb-Beugelaar G. B., Kim J. T., and Manz A., Anal. Chem. 82, 4830 (2010). 10.1021/ac100969k [DOI] [PubMed] [Google Scholar]
- 3.Psaltis D., Quake S. R., and Yang C., Nature 442, 381 (2006). 10.1038/nature05060 [DOI] [PubMed] [Google Scholar]
- 4.Monat C., Domachuk P., and Eggleton B. J., Nat. photon. 1, 106 (2007). 10.1038/nphoton.2006.96 [DOI] [Google Scholar]
- 5.Cheri M. S., Latifi H., Sadeghi J., Moghaddam M. S., Shahraki H., and Hajghassem H., Analyst 139, 431 (2014). 10.1039/c3an01588b [DOI] [PubMed] [Google Scholar]
- 6.Shui L., Pennathur S., Eijkel J. C. T., and van den Berg A., Lab Chip 8, 1010 (2008). 10.1039/B808974B [DOI] [PubMed] [Google Scholar]
- 7.Sims C. E. and Allbritton N. L., Lab Chip 7, 423 (2007). 10.1039/b615235j [DOI] [PubMed] [Google Scholar]
- 8.Lenshof A. and Laurell T., Chem. Soc. Rev. 39, 1203 (2010). 10.1039/b915999c [DOI] [PubMed] [Google Scholar]
- 9.Yamada M., Nakashima M., and Seki M., Anal. Chem. 76, 5465 (2004). 10.1021/ac049863r [DOI] [PubMed] [Google Scholar]
- 10.Guan G., Wu L., Bhagat A. A., Li Z., Chen P. C., Chao S., Ong C. J., and Han J., Sci. Rep. 3, 1475 (2013). 10.1038/srep01475 [DOI] [PMC free article] [PubMed] [Google Scholar]
- 11.Tan Y. C., Fisher J. S., Lee A. I., Cristini V., and Lee A. P., Lab Chip 4, 292 (2004). 10.1039/b403280m [DOI] [PubMed] [Google Scholar]
- 12.Hessel V., Löwe H., and Schönfeld F., Chem. Eng. Sci. 60, 2479 (2005). 10.1016/j.ces.2004.11.033 [DOI] [Google Scholar]
- 13.Cheri M. Sadegh, Latifi H., Moghaddam M. Salehi, and Shahraki H., Chem. Eng. J. 234, 247 (2013). 10.1016/j.cej.2013.08.067 [DOI] [Google Scholar]
- 14.Günther A. and Jensen K. F., Lab Chip 6, 1487 (2006). 10.1039/b609851g [DOI] [PubMed] [Google Scholar]
- 15.Marre S. and Jensen K. F., Chem. Soc. Rev. 39, 1183 (2010). 10.1039/b821324k [DOI] [PubMed] [Google Scholar]
- 16.McKenna B. K., Evans J. G., Cheung M. C., and Ehrlich D. J., Nat. Methods 8, 401 (2011). 10.1038/nmeth.1595 [DOI] [PMC free article] [PubMed] [Google Scholar]
- 17.Caldas P., Jorge P. A., Rego G., Frazão O., Santos J. L., Ferreira L. A., and Araújo F., Appl. Opt. 50, 2738 (2011). 10.1364/AO.50.002738 [DOI] [PubMed] [Google Scholar]
- 18.Ahrens R. and Schlote-Holubek K., J. Micromech. Microeng. 19, 074006 (2009). 10.1088/0960-1317/19/7/074006 [DOI] [Google Scholar]
- 19.Dijkstra M., Boer M. J. de, Berenschot J. W., Lammerink T. S. J., Wiegerink R. J., and Elwenspoek M., Sens. Actuators A 143, 1 (2008). 10.1016/j.sna.2007.12.005 [DOI] [Google Scholar]
- 20.Kim S., Nam T., and Park S., Sens. Actuators, A 114, 312 (2004). 10.1016/j.sna.2003.12.019 [DOI] [Google Scholar]
- 21.Cheri M. S., Latifi H., Aghbolagh F., Naeini O. R., Taghavi M., and Ghaderi M., Appl. Opt. 52, 3420 (2013). 10.1364/AO.52.003420 [DOI] [PubMed] [Google Scholar]
- 22.Attia R., Pregibon D. C., Doyle P. S., Viovy J. L., and Bartolo D., Lab Chip 9, 1213 (2009). 10.1039/b813860e [DOI] [PubMed] [Google Scholar]
- 23.Kottapalli A. G. P., Tan C. W., Olfatnia M., Miao J. M., Barbastathis G., and Triantafyllou M., J. Micromech. Microeng. 21, 085006 (2011). 10.1088/0960-1317/21/8/085006 [DOI] [Google Scholar]
- 24.Lien V. and Vollmer F., Lab Chip 7, 1352 (2007). 10.1039/b706944h [DOI] [PubMed] [Google Scholar]
- 25.Song W. and Psaltis D., Opt. Express 18, 16561 (2010). 10.1364/OE.18.016561 [DOI] [PubMed] [Google Scholar]
- 26.Lee C. L., Hong W. Y., Hsieh H. J., and Weng Z. Y., IEEE Photon. Technol. Lett. 23, 905 (2011). 10.1109/LPT.2011.2142413 [DOI] [Google Scholar]
- 27.Chang D. S., Langelier S. M., and Burns M. A., Lab Chip 7, 1791 (2007). 10.1039/b708574e [DOI] [PubMed] [Google Scholar]
- 28.Yu H., Li D., Roberts R. C., Xu K., and Tien N. C., J. Micromech. Microeng. 22, 035010 (2012). 10.1088/0960-1317/22/3/035010 [DOI] [Google Scholar]
- 29.Perdigones F., Luque A., and Quero J. M., Microelectron. Eng. 87, 2103 (2010). 10.1016/j.mee.2010.01.006 [DOI] [Google Scholar]
- 30.Liu Y., Med. Eng. Phys. 29, 390 (2007). 10.1016/j.medengphy.2006.05.015 [DOI] [PubMed] [Google Scholar]
- 31.Baker R. C., An Introductory Guide to Flow Measurement ( John Wiley & Sons, 2002), p. 50. [Google Scholar]
- 32.Beeby S., MEMS Mechanical Sensors ( Artech House, 2004), p. 127. [Google Scholar]
- 33.Nezhad A. S., Ghanbari M., Agudelo C. G., Packirisamy M., Bhat R. B., and Geitmann A., IEEE Sens. J. 13, 601–609 (2013). 10.1109/JSEN.2012.2223667 [DOI] [Google Scholar]
- 34.Noeth N., Keller S. S., and Boisen A., J. Micromech. Microeng. 21, 015007 (2011). 10.1088/0960-1317/21/1/015007 [DOI] [Google Scholar]
- 35.Rosenauer M. and Vellekoop M. J., Biomicrofluidics 4, 043005 (2010). 10.1063/1.3502672 [DOI] [PMC free article] [PubMed] [Google Scholar]
- 36.Deng Y. L. and Juang Y. J., Biomicrofluidics 7, 014111 (2013). 10.1063/1.4793224 [DOI] [PMC free article] [PubMed] [Google Scholar]


