

Abstract
Background: Closed-loop control clinical research trials have been considerably accelerated by in silico trials using the Food and Drug Administration–accepted type 1 diabetes mellitus (T1DM) simulator. We have recently demonstrated that postprandial insulin sensitivity (SI) in T1DM subjects was lower at breakfast (B) than lunch (L) and dinner (D), but not significantly, because of the small population size. The goal of this study was therefore to incorporate this novel information into the University of Virginia/Padova T1DM simulator and to reproduce in silico the observed circadian variability.
Subjects and Methods: Twenty T1DM subjects received an identical mixed meal at B, L, and D. SI was calculated for each meal using the oral glucose minimal model. Seven SI daily patterns were identified, and their probabilities were estimated. Each in silico subject was linked to a time-varying SI profile, while random deviations of up to 40% were allowed.
Results: Simulations were compared with experimental data. The integrated area above the basal glucose curve values were 2.60±0.91 (B), 1.38±0.91 (L), and 1.44±1.07 (D) 104 min·mg/dL in silico versus 2.87±1.65 (B), 1.98±1.56 (L), and 2.16±2.00 (D) 104 min·mg/dL in vivo. Incremental peak glucose values were 109±33 (B), 80±29 (L), and 81±30 (D) mg/dL in silico versus 136±39 (B), 126±37 (L), and 125±48 (D) mg/dL in vivo.
Conclusions: The incorporation of a time-varying SI into the simulator makes this technology suitable for running multiple-meal scenarios, thus enabling a more robust design of artificial pancreas algorithms.
Introduction
Significant and rapid technological advances involving glucose sensing (continuous glucose monitors1) and insulin delivery systems (insulin pumps or continuous subcutaneous insulin infusion2), with control algorithms linking the two, have made closed-loop control for patients with type 1 diabetes mellitus (T1DM) an imminent reality. In the last few years there have been several reports of short-term clinical trials conducted for testing various artificial pancreas (AP) prototypes (see Cobelli et al.3 for a review).4–12 Most of these AP prototypes received the approval from the Food and Drug Administration or local ethical committees on the basis of in silico simulations of glucose metabolism.13
In particular, in 2008 the Food and Drug Administration accepted the University of Virginia/Padova type 1 diabetes simulator (S2008)13 as a substitute for preclinical trials of AP algorithms. The simulator has been recently updated (S2013)14 and validated against clinical data.15 Such in silico simulation studies are necessary with subsequent clinical testing of the algorithms, especially if the simulations reveal potentially large effect sizes on day-to-day glucose control. Unfortunately, the S2013 is inadequate for this purpose because, as originally conceived, its domain of validity is limited to a single-meal scenario.
We have recently described the existence of diurnal patterns of postprandial insulin sensitivity (SI) in individuals with T1DM16 applying state of the art methodologies. In particular, we found that SI was lower at breakfast (B) than at lunch (L) and dinner (D), but this was not statistically significant because of large intersubject variability (Fig. 1).
FIG. 1.

(A) Average insulin sensitivity at the different diurnal portions (breakfast [B], lunch [L], and dinner [D]). Data are mean±SE values. (B) Percentage intraday insulin sensitivity variation at the different diurnal portions (B, L, and D).
This information is crucial to the control algorithm because postprandial SI is a major determinant of postprandial glucose excursion in any individual by virtue of its inhibitory effect on hepatic glucose production and stimulatory effect on whole-body glucose uptake. Moreover, it has been recently shown in simulation that introducing a temporal variation on SI may improve AP glucose control.17
The current report therefore represents a natural and critical extension of our work by incorporating this information into the S2013, allowing us to run multiple-meal scenarios, thus enabling a more robust design of AP algorithms. The aims of this study are thus (1) to use the data that we previously generated16 to set up a model of SI pattern variability in the T1DM population, (2) to incorporate this variability model into the S2013, and (3) to reproduce the variability observed in the experimental data and thus validate the refined simulator for future use.
Subjects and Methods
Database and protocol
Twenty T1DM subjects (nine females; 42.9±14.4 years of age; body mass index, 24.9±3.9 kg/m2; carbohydrates-to-insulin ratio [CR], 8.6±2.1 g/U) were admitted for a 3-day study in the Clinical Research Unit of the Mayo Center for Clinical and Translational Science (Rochester, MN). Inclusion criteria were age of 18–60 years, body mass index of <40 kg/m2, hemoglobin A1c level of ≤8.5%, creatinine level of ≤1.5 mg/dL, and normal gastric emptying to solids and liquids. Exclusion criteria were significant gastrointestinal symptoms by questionnaire, hypoglycemia unawareness by Clarke questionnaire, documented recent upper gastrointestinal disorder, medications affecting gastric motility (e.g., erythromycin), pregnancy or breast feeding, or other comorbidities (e.g., nephropathy, neuropathy, macrovascular disease, hypertension) precluding participation. Those with stable background diabetic retinopathy were included. Medications (except stable thyroid hormone or hormone replacement therapy) that could influence glucose tolerance were exclusionary. Subjects did not engage in vigorous physical activities for 72 h prior to screen and study visits.
In brief, once a day, a triple-tracer mixed-meal study protocol was performed during B, L, or D in a Latin square design, with identical meal composition. Blood samples were collected at −180, −30, 0, 5, 10, 20, 30, 60, 90, 120, 150, 180, 240, 300, and 360 min, with t=0 corresponding to the timing of the meal, for measurement of plasma glucose and insulin concentrations in order to estimate SI with the oral minimal model.18 More details on the study protocol can be found in Hinshaw et al.16 Figure 1A shows the average SI at B, L, and D reported by Hinshaw et al.16 with the addition of data from the present study. As discussed earlier, there was a trend in the group showing lower SI at B, but this was not statistically significant because of the large intersubject variability (Fig. 1B).
Probability of SI pattern
To highlight the characteristic SI pattern in each subject, each SI value was first normalized to the maximum observed in the same patient. Then, values >60% were labeled as high (h), whereas values <60% were labeled as low (l). This choice is justified by the fact that a 40% difference is imputable to a fortuitous variation and will be subsequently modeled as a random effect. More precisely, SI was estimated with a precision of 20%, on average; assuming SI maximum at B (i.e., 100%), we considered the SI values at L and D to be different from that at B if they were outside the 95% confidence interval (i.e., in this case below 100%−2×20%=60%). With this definition, there are seven candidate empirical classes, each one associated with a particular pattern of SI at B, L, and D (Fig. 2):
• Class 1: h-h-h (equivalent to l-l-l)
• Class 2: h-h-l
• Class 3: h-l-h
• Class 4: h-l-l
• Class 5: l-h-h
• Class 6: l-h-l
• Class 7: l-l-h
FIG. 2.
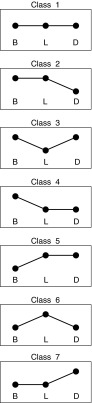
Seven classes of insulin sensitivity pattern. B, breakfast; D, dinner; L, lunch.
Each subject was univocally associated with one of the above classes. The probability of each class is then calculated as:
 |
where Ni is the number of subjects belonging to the i-th Class and Ntot is the total number of subjects.
Modeling the SI pattern
A brief description of the simulator is reported first, followed by an explanation of how the intraday variability of SI was incorporated into the simulator.
The T1DM simulator
The T1DM simulator, accepted by the Food and Drug Administration as a substitute for preclinical animal trials for certain insulin therapies, including the AP,13,14 consists of a model of glucose–insulin–glucagon dynamics during a meal and a population of 100 virtual adults, 100 adolescents, and 100 children with T1DM, respectively. Each virtual subject is represented in the simulator by a vector containing subject-specific model parameters (e.g., SI). These were generated by randomly extracting different realizations of the parameter vector from an appropriate joint parameter distribution, a process that has been demonstrated to well span the variability of the T1DM population observed in vivo.14,15 However, as already mentioned, an important limitation of the simulator is that it does not take into account the intraindividual diurnal variability of SI.
Incorporation of the model of intra-day variability of SI into the T1DM simulator
In order to implement the intraday variability of SI into the T1DM simulator, each in silico subject was randomly assigned to one of the seven classes, according to the estimated probability (see Results). The fact that a subject belongs to the i-th Class means that the SI daily pattern of that subject is on average the one associated to the i-th Class. For instance, if the j-th subject, characterized by insulin sensitivity  , belongs to Class 5 (l-h-h), its parameters will be, on average,
  ,
,  , and
, and  , respectively, at B, L, and D, with α <1. However, deviations from this nominal profile are allowed, by modulating the nominal pattern with a multiplicative random noise, described by a normal distribution N(μ, σ2), withμ= 1 and σ=0.2. Parameter σ was chosen in order to explain as a random effect deviation up to 40% of the maximum.
The actual SI pattern is then transformed in the corresponding time-varying parameter SI(t) (i.e., an almost stepwise-line signal that varies three times a day [at 4 a.m., 11 a.m., and 5 p.m.]). Figure 3 shows the procedure described above for an illustrative subject of Class 5.
FIG. 3.
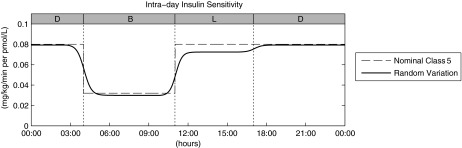
Intraday insulin sensitivity profile for a virtual subject belonging to Class 5: the final time-varying insulin sensitivity (continuous line) is obtained as a smoothed random variation of the nominal profile (dashed line), of which the 100% is the original S2013 time-invariant value (here set at 0.08 mg/kg/min per pmol/L). B, breakfast; D, dinner; L, lunch.
Simulation scenario
The simulation scenario reproduces the experimental protocol described above. More specifically, the 100 in silico subjects received B at 7 a.m., L at 1 p.m., and D at 7 p.m., with the appropriate amount of ingested carbohydrates.16 The optimal basal insulin was infused in each virtual subject. In contrast, the premeal insulin bolus was reduced, on average, by 2 U with respect to the one calculated with the patient-specific CR. In fact, by definition, with the optimal CR, plasma glucose would have returned to the target within the 3-h experiment, whereas the data show that the plasma glucose level was still above target at t=360 min. It is worth noting that, with this reduction, the average amount of insulin administered with the bolus was similar in the real and virtual population (3.93±0.22 U vs. 3.54±0.16 U, respectively).
Statistical analysis
Two-way analysis of variance, including both the main effects and a term for interaction, has been used to assess difference between type of data (real vs. simulated) at B, L, and D. In particular, we focused on the significance of the interaction term, which indicates whether or not the differences among B, L, and D are affected by the factor “type of data.” A P value of<0.05 is considered significant.
Results
Probability of SI pattern
Figure 4 summarizes the classification results obtained in the 20 T1DM subjects of the database:
• Two subjects into Class 1→P(Class 1)=0.1
• One subject into Class 2→P(Class 2)=0.05
• One subject into Class 3→P(Class 3)=0.05
• Two subjects into Class 4→P(Class 4)=0.1
• Four subjects into Class 5→P(Class 5)=0.2
• Four subjects into Class 6→P(Class 6)=0.2
• Six subjects into Class 7→P(Class 7)=0.3
FIG. 4.

Percentage intraday insulin sensitivity variation at the different diurnal portions (breakfast [B], lunch [L], and dinner [D]), clustered among the seven variability classes. Percentage values reported on the top of each panel represent the percentage of the population belonging to the respective variability class.
In each class, “low” SI values were (mean±SD) 40%±23% of the “high.” Thus, α was set to 0.4.
Simulation versus data
Figure 5 shows the comparison of simulated (left) versus above-basal plasma glucose (right) curves at B, L, and D. The over-basal glucose area under the curves values were 2.60±0.91 (B), 1.38±0.91 (L), and 1.44±1.07 (D) 104 mg/dL·min in silico versus 2.87±1.65 (B), 1.98±1.56 (L), and 2.16±2.00 (D) 104 mg/dL·min in vivo. Over-basal peak values were 109±33 (B), 80±29 (L), and 81±30 (D) mg/dL in silico versus 136±39 (B), 126±37 (L), and 125±48 (D) mg/dL in vivo. The peak times were 125±51 (B), 96±46 (L), and 94±44 (D) min in silico versus 81±24 (B), 74±21 (L), and 68±24 (D) min in vivo. The interaction term from two-way analysis of variance was not significant in all the comparisons.
FIG. 5.

Over-basal plasma glucose profiles (left) obtained in simulation and (right) observed experimentally. B, breakfast; D, dinner; L, left.
The area under the over-basal insulin curve values were 1.33±0.47 (B), 1.26±0.46 (L), and 1.25±0.46 (D) 104 pmol/L·min in silico versus 1.42±0.98 (B), 0.86±0.67 (L), and 1.10±1.00 (D) 104 pmol/L·min in vivo. Over-basal peak values were 94±28 (B), 93±38 (L), and 93±39 (D) pmol/L in silico versus 116±59 (B), 102±86 (L), and 98±57 (D) pmol/L in vivo. The peak times were 46±9 (B), 45±7 (L), and 45±7 (D) min in silico versus 60±44 (B), 61±36 (L), and 49±37 (D) min in vivo. The interaction term from two-way analysis of variance was not significant in all the comparisons except for the peak times (P=0.036).
Simulated plasma glucose values are, on average, slightly lower and with the peaks occurring somewhat later than the data.
Discussion
The analyses described in this article represent the natural extension of our previous work on diurnal patterns of postprandial insulin action in individuals with T1DM.16 Applying a carefully controlled study design that was necessary to minimize potential confounders of insulin action (e.g., varying meal sizes and composition, varying levels of physical activities, etc.), we observed that, for the most part, postprandial insulin action (SI) was lower at B than at L or D. However, this difference was not statistically significant because of large intersubject variability (Fig. 1B). Furthermore, it was noteworthy that the numerical spread of SI values throughout the day was considerable even for identical meals with identical macronutrient and calorie contents consumed at different times of the day with a fixed activity program that ensured that subjects exerted themselves at a grade consistent with activities of daily living, thus minimizing any carryover effect of physical activity. This underscores the formidable challenges that physiologists and engineers have to contend with while developing next-generation closed-loop control algorithms.
By applying a classification method based on the percentage variation of diurnal SI, we were able to discern seven distinctive patterns of diurnal SI variability in T1DM subjects.
Exploiting this information, we built a suitable model of intraday SI variability and incorporated it into the last version of our T1DM simulator (S2013).14 This was required in order to make the S2013 more physiological and adequate to test in silico the closed-loop control algorithms for a longer time duration that includes multiple meals. In particular, the implemented model assumes that each in silico subject is assigned to one of the seven SI variability classes defined above, characterized by a nominal profile that varies at prefixed transition times. Moreover, a modulation of the nominal profile is allowed by modify the nominal pattern with a multiplicative random noise, in order to better reproduce the intersubject variability.
To validate the model, we analyzed the results obtained by simulating the same experimental protocol described above and then compared the simulation results with the clinical results presented by Hinshaw et al.16 As shown in Figure 5, the simulated above-basal plasma glucose level was higher at B than at L and D, reflecting what was observed by Hinshaw et al.,16 even though, on average, the simulated postprandial excursions were slightly lower, with glucose peaks occurring later than those observed in the study. This can be justified by the fact that the T1DM subjects studied by Hinshaw et al.16 present, on average, a lower CR with respect to the in silico population (CRreal=8.6±2.1 [range, 6–13] g/U vs. CRvirtual=15.9±5.3 [range, 7–30] g/U), hence being less sensitive to insulin. This probably explains the existing difference in glucose dynamics, resulting in slower action in simulations.
Some considerations have to be taken regarding the transition time and the modulation of the nominal pattern into the SI variability model. Clearly, the choice of the transition times at which nominal SI varies is arbitrary; however, the idea is to set them in order to have a stable SI value around each meal. Moreover, SI modulation with the multiplicative random noise allows for a subject to temporarily migrate to another class different from the nominal one. However, the random noise amplitude set in this study permits only migrations to contiguous classes: for example, a subject belonging to Class 3 can temporarily migrate to Class 1, 4, or 5 but not to Class 2.
We also acknowledge that the choice of the cutoff value, here set to 60%, is somewhat arbitrary. Thus, we tested also different cutoff values: 50% and 70%. Using a 50% cutoff, we obtained P(Class 2)=0, whereas using a 70% cutoff, P(Class 3)=0. On the other hand, all the classes had nonzero probabilities using the 60% cutoff. In some sense the small sample size has conditioned the choice of the cutoff level.
What we have presented here, of course, is only a first step, and refinements are required to overcome certain limitations. In fact, it is likely that SI would change with varying meal content, composition, and calories consumed, degree of preceding glycemic control, etc. Thus, such studies are necessary to determine the effects of the above variables on diurnal patterns of insulin action. Moreover, future development, such as the variation of model parameters describing the meal glucose absorption, could be helpful to take into account different meal composition (i.e., complex carbohydrates or high-fat meals, rather than simple carbohydrates/rapid-absorption meals). Additionally, physical activity of varying grades and intensities also affects glucose excursions and insulin sensitivity.19–22 However, it is important to stress that, as reported by Hinshaw et al.,16 the subjects remained in the resting state for at least 3 h prior to assessment of postprandial insulin sensitivity for B, L, or D. None of the subjects performed unaccustomed vigorous physical activity preceding the study visit, and they did not perform unusual activity during the study period. In fact, the extent of day-to-day physical activity, as measured by triaxial accelerometers and expressed as accelerometer units, was similar during the study days.16 Hence any confounding effect of unequal physical activity on the interpretation of diurnal patterns of SI was also minimized.
Finally, it is important to realize the implications of incorporating the intraday SI variability into the T1DM simulator that could influence the testing of the closed-loop control algorithms. In fact, it is clear that variations of SI perturb the in silico subjects from their ideal condition, thus requiring modification of each subject's parameters, such as CR and correction factor, rather than modulations of basal insulin profile. Therefore, in this context, such simulations could be critical to test the performance of self-adaptive control algorithms, which aim at day-to-day optimal tuning of subject-specific parameters.
However, the proposed intraday SI is based on data of 3-day (virtually 1-day) inpatient experiments, for which minimal model techniques were applicable. It would be certainly of interest to investigate on SI variations in a long-term scenario (e.g., exploiting the data provided by a 1-year study on T1DM subjects23). Unfortunately, the method to estimate SI with the oral minimal model18 is unsuitable for the dataset of Bergenstal et al.23 because of the availability of only continuous glucose monitor and insulin pump data. However, we have recently proposed a method for the estimation of SI in T1DM subjects from continuous glucose monitor and insulin pump data,24 thus allowing the intraday SI model refinement in the near future. Moreover, the availability of these data could be helpful also for a more informed choice of the cutoff used in the classification.
In summary, in this work we incorporated a model of intraday variability of SI into the University of Virginia/Padova T1DM simulator. The physiological behaviors obtained in silico reflect those observed in a clinical trial, thus further validating the simulator. Hence, this improved version of T1DM simulator could be a useful tool to fine-tune and validate new and informed next-generation closed-loop control algorithms, an essential pathway to individualize T1DM management.
Acknowledgments
This study was supported by grants DK 085516 and DK 094331 from the National Institutes of Health, a JDRF Simulation Core Grant, and the Italian Ministero dell'Università e della Ricerca (grant FIRB 2008). Clinical studies were conducted with support from grant UL1 TR000135 from the National Center for Advancing Translational Science, a component of the National Institutes of Health.
Author Disclosure Statement
No competing financial interests exist.
R.V. and C.D.M. conceived the model. C.C. contributed to the model development. R.V. analyzed the data. R.V. and C.D.M. drafted the manuscript. Y.C.K. and A.B. performed the experiment. Y.C.K., A.B., and C.C. contributed to the discussion of the results and edited the manuscript. All the authors approved the final version of the manuscript.
References
- 1.Juvenile Diabetes Research Foundation Continuous Glucose Monitoring Study Group, Tamborlane WV, Beck RW, et al. : Continuous glucose monitoring and intensive treatment of type 1 diabetes. N Engl J Med 2008;359:1464–1476 [DOI] [PubMed] [Google Scholar]
- 2.Pickup JC: Insulin-pump therapy for type 1 diabetes mellitus. N Engl J Med 2012;366:1616–1624 [DOI] [PubMed] [Google Scholar]
- 3.Cobelli C, Renard E, Kovatchev B: Artificial pancreas: past, present, future. Diabetes 2011;60:2672–2682 [DOI] [PMC free article] [PubMed] [Google Scholar]
- 4.Weinzimer SA, Steil GM, Swan KL, et al. : Fully automated closed-loop insulin delivery versus semiautomated hybrid control in pediatric patients with type 1 diabetes using an artificial pancreas. Diabetes Care 2008;31:934–939 [DOI] [PubMed] [Google Scholar]
- 5.Hovorka R, Allen JM, Elleri D, et al. : Manual closed-loop insulin delivery in children and adolescents with type 1 diabetes: a phase 2 randomised crossover trial. Lancet 2010;375:743–751 [DOI] [PubMed] [Google Scholar]
- 6.El-Khatib FH, Russell SJ, Nathan DM, et al. : A bihormonal closed-loop artificial pancreas for type 1 diabetes. Sci Transl Med 2010;2:27ra2. [DOI] [PMC free article] [PubMed] [Google Scholar]
- 7.Kovatchev B, Cobelli C, Renard E, et al. : Multi-national study of subcutaneous model-predictive closed-loop control in type 1 diabetes: summary of the results. J Diabetes Sci Technol 2010;4:1374–1381 [DOI] [PMC free article] [PubMed] [Google Scholar]
- 8.Hovorka R, Kumareswaran K, Harris J, et al. : Overnight closed loop insulin delivery (artificial pancreas) in adults with type 1 diabetes: crossover randomised controlled studies. BMJ 2011;342:d1855. [DOI] [PMC free article] [PubMed] [Google Scholar]
- 9.Atlas E, Nimri R, Miller S, et al. : MD-Logic artificial pancreas system: a pilot study in adults with type 1 diabetes. Diabetes Care 2010;33:1072–1076 [DOI] [PMC free article] [PubMed] [Google Scholar]
- 10.Kovatchev BP, Renard E, Cobelli C, et al. : Feasibility of outpatient fully integrated closed-loop control: first studies of wearable artificial pancreas. Diabetes Care 2013;36:1851–1858 [DOI] [PMC free article] [PubMed] [Google Scholar]
- 11.Cobelli C, Renard E, Kovatchev BP, et al. : Pilot studies of wearable outpatient artificial pancreas in type 1 diabetes. Diabetes Care 2012;35:e65–e67 [DOI] [PMC free article] [PubMed] [Google Scholar]
- 12.Breton M, Farret A, Bruttomesso D, et al. : Fully integrated artificial pancreas in type 1 diabetes: modular closed-loop glucose control maintains near normoglycemia. Diabetes 2012;61:2230–2237 [DOI] [PMC free article] [PubMed] [Google Scholar]
- 13.Kovatchev BP, Breton M, Dalla Man C, et al. : In silico preclinical trials: a proof of concept in closed-loop control of type 1 diabetes. J Diabetes Sci Technol 2009;3:44–55 [DOI] [PMC free article] [PubMed] [Google Scholar]
- 14.Dalla Man C, Micheletto F, Lv D, et al. : The UVA/PADOVA type 1 diabetes simulator: new features. J Diabetes Sci Technol 2014;8:26–34 [DOI] [PMC free article] [PubMed] [Google Scholar]
- 15.Visentin R, Dalla Man C, Kovatchev B, et al. : The University of Virginia/Padova type 1 diabetes simulator matches the glucose traces of a clinical trial. Diabetes Technol Ther 2014;16:428–434 [DOI] [PMC free article] [PubMed] [Google Scholar]
- 16.Hinshaw L, Dalla Man C, Nandy DK, et al. : Diurnal pattern of insulin action in type 1 diabetes: implications for a closed-loop system. Diabetes 2013;62:2223–2229 [DOI] [PMC free article] [PubMed] [Google Scholar]
- 17.Toffanin C, Zisser H, Doyle FJ 3rd, et al. : Dynamic insulin on board: incorporation of circadian insulin sensitivity variation. J Diabetes Sci Technol 2013;7:928–940 [DOI] [PMC free article] [PubMed] [Google Scholar]
- 18.Cobelli C, Dalla Man C, Sparacino G, et al. : Diabetes: models, signals, and control. IEEE Rev Biomed Eng 2009;2:54–96 [DOI] [PMC free article] [PubMed] [Google Scholar]
- 19.Manohar C, Levine JA, Nandy DK, et al. : The effect of walking on postprandial glycemic excursion in patients with type 1 diabetes and healthy people. Diabetes Care 2012;35:2493–2499 [DOI] [PMC free article] [PubMed] [Google Scholar]
- 20.Schiavon M, Hinshaw L, Mallad A, et al. : Postprandial glucose fluxes and insulin sensitivity during exercise: a study in healthy individuals. Am J Physiol Endocrinol Metab 2013;305:E557–E566 [DOI] [PMC free article] [PubMed] [Google Scholar]
- 21.Breton MD: Physical activity—the major unaccounted impediment to closed loop control. J Diabetes Sci Technol 2008;2:169–174 [DOI] [PMC free article] [PubMed] [Google Scholar]
- 22.Turksoy K, Quinn LT, Littlejohn E, et al. : An integrated multivariable artificial pancreas control system. J Diabetes Sci Technol 2014;8:498–507 [DOI] [PMC free article] [PubMed] [Google Scholar]
- 23.Bergenstal RM, Tamborlane WV, Ahmann A, et al. : Effectiveness of sensor-augmented insulin-pump therapy in type 1 diabetes. N Engl J Med 2010;363:311–320 [DOI] [PubMed] [Google Scholar]
- 24.Schiavon M, Dalla Man C, Kudva YC, et al. : Quantitative estimation of insulin sensitivity in type 1 diabetic subjects wearing a sensor augmented insulin pump. Diabetes Care 2014;37:1216–1223 [DOI] [PMC free article] [PubMed] [Google Scholar]