

Abstract
Retrospectively, we investigated the epidemiology of a massive Salmonella enterica serovar Typhi outbreak in Zambia during 2010 to 2012. Ninety-four isolates were susceptibility tested by MIC determinations. Whole-genome sequence typing (WGST) of 33 isolates and bioinformatic analysis identified the multilocus sequence type (MLST), haplotype, plasmid replicon, antimicrobial resistance genes, and genetic relatedness by single nucleotide polymorphism (SNP) analysis and genomic deletions. The outbreak affected 2,040 patients, with a fatality rate of 0.5%. Most (83.0%) isolates were multidrug resistant (MDR). The isolates belonged to MLST ST1 and a new variant of the haplotype, H58B. Most isolates contained a chromosomally translocated region containing seven antimicrobial resistance genes, catA1, blaTEM-1, dfrA7, sul1, sul2, strA, and strB, and fragments of the incompatibility group Q1 (IncQ1) plasmid replicon, the class 1 integron, and the mer operon. The genomic analysis revealed 415 SNP differences overall and 35 deletions among 33 of the isolates subjected to whole-genome sequencing. In comparison with other genomes of H58, the Zambian isolates separated from genomes from Central Africa and India by 34 and 52 SNPs, respectively. The phylogenetic analysis indicates that 32 of the 33 isolates sequenced belonged to a tight clonal group distinct from other H58 genomes included in the study. The small numbers of SNPs identified within this group are consistent with the short-term transmission that can be expected over a period of 2 years. The phylogenetic analysis and deletions suggest that a single MDR clone was responsible for the outbreak, during which occasional other S. Typhi lineages, including sensitive ones, continued to cocirculate. The common view is that the emerging global S. Typhi haplotype, H58B, containing the MDR IncHI1 plasmid is responsible for the majority of typhoid infections in Asia and sub-Saharan Africa; we found that a new variant of the haplotype harboring a chromosomally translocated region containing the MDR islands of IncHI1 plasmid has emerged in Zambia. This could change the perception of the term “classical MDR typhoid” currently being solely associated with the IncHI1 plasmid. It might be more common than presently thought that S. Typhi haplotype H58B harbors the IncHI1 plasmid or a chromosomally translocated MDR region or both.
INTRODUCTION
Typhoid fever is an ancient but still important cause of human illness, mostly in developing countries with poor sanitation and a lack of potable water (1). It is estimated that typhoid fever is responsible for up to 26.9 million annual cases, of which 223,000 have a fatal outcome, predominately among children (2). Typhoid fever has been reported to have the highest incidence in Asia, whereas the incidence rate has decreased in Latin America due to improved sanitation and economic development (3–5). In sub-Saharan Africa, nontyphoidal Salmonella strains have been reported to predominate in contrast to those causing typhoid fever (3, 6). Despite this, large outbreaks of typhoid fever are still frequently reported from the sub-Saharan African region (7–10).
Beginning in early November 2010, there were large typhoid fever outbreaks in Zambia, Zimbabwe, and the Democratic Republic of Congo. These outbreaks have to a large extent been overlooked in a region plagued by many needs and with few resources (11).
For future surveillance and control of S. Typhi infections in the region, it is important to know whether the outbreak in 2010 to 2012 was a result of a single novel introduction or reflected a situation of endemicity with multiple clones and lineages. Thus, the main purpose of the present study was to determine the genetic relatedness of contemporary clinical S. Typhi isolates using whole-genome sequence typing. In addition, another purpose was to determine if this outbreak was the result of the presence of the expanding globally dominant H58 haplotype containing the incompatibility group HI1 (IncHI1) plasmid type associated with multidrug resistance (MDR) by investigation of the occurrence and genetic mechanisms of antimicrobial resistance and plasmid replicons.
MATERIALS AND METHODS
Epidemiological information.
Data associated with a typhoid fever outbreak covering the full outbreak period from January 2010 to September 2012 were extracted from the laboratory records at the University Teaching Hospital (UTH) in Lusaka, Zambia, and used to describe the distribution of cases with respect to gender, age, and time.
Samples and bacterial isolates.
In general, stool and blood samples were subjected to standard microbiological procedures for isolation (see Text S1 in the supplemental material). All presumptively S. Typhi-positive colonies were identified by biochemical tests and serogrouping (see Text S1) and subsequently subjected to an S. Typhi-specific PCR assay for confirmation (12). Only a small number (n = 94) of S. Typhi isolates were available for further analysis among the 2,040 cases identified during the outbreak. The remaining isolates were either not stored or not viable in Zambia. The 94 S. Typhi isolates available and included the study were sent to the Technical University of Denmark, National Food Institute (DTU-Food), for further characterization.
Antimicrobial susceptibility testing.
MIC determination was performed on the 94 S. Typhi isolates using a commercially prepared dehydrated panel (Sensititre; TREK Diagnostic Systems Ltd., East Grinstead, England), the agar dilution technique, and E-tests (13, 14). The tested antimicrobials and classes are listed in Table 1. Clinical and Laboratory Standards Institute (CLSI) (13) clinical breakpoint interpretative criteria for resistance (R) were used except for a few antimicrobials for which epidemiological cutoff values were applied according to EUCAST recommendations (see Text S1 in the supplemental material) (http://www.eucast.org). Quality control was performed by using reference strain Escherichia coli ATCC 25922 according to CLSI guidelines (13, 14).
TABLE 1.
Frequency of resistance per variable (specimen, year of isolation, and whether the isolates were chosen for whole-genome sequence typing of Salmonella serovar Typhi in Zambian patients)
| Variable | Total no. of isolates | No. (%) of isolates resistant to various antimicrobial agents and CLSI clinical breakpoint values (mg/liter) |
|||||||
|---|---|---|---|---|---|---|---|---|---|
| AMC (≥32) | AMP (≥32) | CHL (≥32) | CIP (>0,064) | NAL (≥32) | STR (>16) | SMX (≥512) | TMP (≥16) | ||
| Isolate type | |||||||||
| Blood | 86 (91.5) | 1 (1.2) | 85 (98.8) | 73 (84.9) | 4 (4.7) | 3 (3.5) | 85 (98.8) | 85 (98.8) | 85 (98.8) |
| Stool | 8 (8.5) | 0 | 8 (100.0) | 5 (62.5) | 0 | 0 | 8 (100.0) | 8 (100.0) | 8 (100.0) |
| Yr of isolation | |||||||||
| 2010 | 35 (37.2) | 0 | 35 (100.0) | 29 (82.9) | 2 (5.7) | 2 (5.7) | 35 (100.0) | 35 (100.0) | 35 (100.0) |
| 2011 | 33 (35.1) | 1 (3.0) | 33 (100.0) | 28 (84.8) | 2 (6.1) | 1 (3.0) | 33 (100.0) | 33 (100.0) | 33 (100.0) |
| 2012 | 26 (27.7) | 0 | 25 (96.2) | 21 (80.8) | 0 | 0 | 25 (96.2) | 25 (96.2) | 25 (96.2) |
| WGST performed | 33 (35.1) | 0 | 32 (97.0) | 27 (81.8) | 2 (6.1) | 2 (6.1) | 32 (97.0) | 32 (97.0) | 32 (97.0) |
| WGST not performed | 61 (64.9) | 1 (1.6) | 61 (100.0) | 51 (83.6) | 2 (3.3) | 1 (1.6) | 61 (100.0) | 61 (100.0) | 61 (100.0) |
| Total | 94 (100.0) | 1 (1.1) | 93 (99.0) | 78 (83.0) | 4 (4.3) | 3 (3.2) | 93 (99.0) | 93 (99.0) | 93 (99.0) |
Abbreviations: AMC, amoxicillin plus clavulanic acid; AMP, ampicillin; CHL, chloramphenicol; CIP, ciprofloxacin; NAL, nalidixic acid; SPT, spectinomycin; STR, streptomycin; SMX, sulfamethoxazole; TMP, trimethoprim; WGST, whole-genome sequence typing. STR, azithromycin, ceftiofur, colistin, florfenicol, neomycin, and spectinomycin results were interpreted according to EUCAST guidelines on the basis of epidemiological cutoff values. Apramycin results were interpreted according to research results from DTU-Food. Ciprofloxacin results were also interpreted according to EUCAST guidelines on the basis of epidemiological cutoff values to detect decreased susceptibility. No resistance was observed for apramycin (MIC = >32 mg/liter), azithromycin (>32 mg/liter), cefotaxime (≥4 mg/liter), ceftiofur (>2 mg/liter), ciprofloxacin (high-level resistance [≥1 mg/liter]), colistin (>2 mg/liter), florfenicol (>16 mg/liter), gentamicin (≥16 mg/liter), neomycin (>4 mg/liter), spectinomycin (>64 mg/liter), and tetracycline (≥16 mg/liter).
Whole-genome sequencing, multilocus sequence typing, antimicrobial resistance genes, and plasmid replicons.
Due to sequencing costs at DTU, it was possible to further investigate only a subset of 33 isolates, which were conveniently selected for whole-genome sequence typing (WGST) based on the criterion of ideal coverage of all antimicrobial resistance phenotypes, the different specimen types (stool and blood isolates), and the different years of isolation (2010, 2011, and 2012) (Table 2).
TABLE 2.
Epidemiological features of the 33 whole-genome-sequenced typed isolatesa
| Isolate no. | Gender | Patient age | Hospital ward identifier | Clinical detail(s) | Specimen | Date of isolation |
|---|---|---|---|---|---|---|
| 1 | M | 9 yrs | 08 | Enteric fever | Blood | 6 May 2011 |
| 5 | M | 10 yrs | 03 | Enteric fever | Blood | 23 January 2011 |
| 6 | F | 10 yrs | 03 | Enteric fever | Blood | 11 February 2011 |
| 7 | F | 4 yrs | 03 | Septicemia | Blood | 11 February 2010 |
| 8 | M | 10 yrs | 05 | Fever | Blood | 14 January 2010 |
| 9 | M | 4 yrs | 04 | Enteric fever | Blood | 11 February 2010 |
| 12 | M | 5 yrs | 08 | Typhoid | Blood | 11 May 2010 |
| 13 | M | 9 yrs | 05 | Typhoid | Blood | 16 November 2011 |
| 14 | M | 5 yrs | 01 | Fever | Blood | 24 November 2010 |
| 15 | M | 3 yrs | 08 | Septicemia | Blood | 11 August 2010 |
| 31 | M | 9 yrs | 08 | Fever | Blood | 26 November 2010 |
| 34 | F | 7 yrs | 05 | Enteric fever | Blood | 19 November 2010 |
| 35 | M | 7 yrs | 05 | Enteric fever | Blood | 11 February 2010 |
| 36 | M | 1 yr 11 mos | 05 | Enteric fever | Blood | 29 November 2010 |
| 42 | M | 6 yrs | 08 | Enteric fever | Blood | 9 January 2010 |
| 46 | M | 6 yrs | 06 | UTI, malaria | Blood | 17 November 2010 |
| 49 | F | 10 yrs | 01 | Enteric fever | Blood | 8 June 2010 |
| 53 | M | 3 yrs 6 mos | 08 | Enteric fever | Blood | 8 April 2010 |
| 54 | F | 10 yrs | 05 | Enteric fever | Blood | 23 May 2010 |
| 70 | F | 4 yrs 6 mos | 05 | Enteric fever | Blood | 14 February 2011 |
| 71 | F | 4 yrs | 05 | Enteric fever | Blood | 21 January 2011 |
| 12 | F | 20 yrs | 14 | Enteric fever | Blood | 1 October 2012 |
| 225 | M | Adult | 13 | Enteric fever | Blood | 17 February 2012 |
| 269 | F | 15 yrs | 02 | Enteric fever | Blood | 13 November 2010 |
| 279 | M | 4 yrs | 10 | Enteric fever | Stool | 23 January 2012 |
| 361 | M | 8 yrs | 05 | Enteric fever | Blood | 9 March 2012 |
| 551 | M | 8 yrs | 05 | Enteric fever | Blood | 21 March 2012 |
| 674 | F | 6 yrs | 03 | Enteric fever | Stool | 15 February 2012 |
| 739 | F | 4 yrs 11 mos | 01 | Enteric fever | Stool | 23 February 2012 |
| 748 | M | <14 yrs | 01 | Enteric fever | Blood | 7 November 2011 |
| 911 | F | 1 yr 11 mos | 12 | Enteric fever | Stool | 1 March 2012 |
| 1012 | F | 12 yrs | 03 | Enteric fever | Blood | 30 December 2010 |
| 1341 | M | 20 yrs | 11 | Enteric fever | Stool | 3 April 2012 |
M, male; F, female; UTI, urinary tract infection.
Genomic DNA was extracted from the 33 isolates using an Invitrogen Easy-DNA kit (Invitrogen, Carlsbad, CA, USA), and DNA concentrations were determined using a Qubit double-stranded DNA (dsDNA) BR assay kit (Invitrogen). The genomic DNA was prepared for Illumina pair-end sequencing using Illumina (Illumina, Inc., San Diego, CA) NexteraXT Guide 150319425031942 and following protocol revision C (http://support.illumina.com/downloads/nextera_xt_sample_preparation_guide_15031942.html). A sample of pooled NexteraXT libraries was loaded onto a Illumina MiSeq reagent cartridge using MiSeq reagent kit v2 and 500 cycles with a standard flow cell. The libraries were sequenced using an Illumina platform and MiSeq control software 2.3.0.3. Twenty-four isolates were subjected to pair-end sequencing, and 6 isolates were subjected to single-end sequencing. Pair-end sequences ranged in insertion size from 11 to 129 bp, with an average of 68 bp. The read depth of the sequences was between 147 to 497 bp, with an average of 259 bp.
Five previously published genomic sequences of haplotypes H58, AG3, E02-2759, ISP-04-06979, E03-9804, and ISP-03-07467 were obtained from GenBank and the Sanger Institute (accessed 5 April 2013). Full genomic information is shown in Table S1A in the supplemental material.
Raw sequence data have been submitted to the European Nucleotide Archive (http://www.ebi.ac.uk/ena) under study accession no. PRJEB7179 and PRJEB7182. The raw reads were assembled using the Assemble pipeline (version 1.0) available from the Center for Genomic Epidemiology (CGE) (http://cge.cbs.dtu.dk/services/all.php), which is based on the Velvet algorithms for de novo short-read assembly. A complete list of genomic sequence data is available in Table S1A in the supplemental material. The assembled sequences were analyzed to identify the MLST sequence type (ST) for Salmonella enterica, plasmid replicons, and acquired antimicrobial resistance genes using the pipelines MLST (version 1.7), PlasmidFinder (version 1.2), and ResFinder (version 2.1) available from CGE (15–17).
Transferability of the IncQ1 plasmid replicon by conjugation and electroporation.
Due to the detection of an IncQ1 plasmid replicon, plate-mating experiments were attempted with four donor S. Typhi isolates, 31, 34, 54, and 71, selected based on phylogenetic (same or distant) clustering and plasmid-free, rifampin- and nalidixic acid-resistant E. coli MT102RN bacteria as recipients (18). In addition, the four S. Typhi isolates were subjected to plasmid purification using Qiagen kits (Venlo, the Netherlands) and electroporation into electrocompetent E. coli DH10B cells was attempted (see Text S1 in the supplemental material).
Identification of the chromosomally translocated MDR region, including the IncQ1 island.
The lack of plasmids in the four strains could be a result of chromosomal translocation of the genomic region containing the IncQ1 plasmid replicon; therefore, genomic DNA was extracted from isolates 31, 34, 54, and 71 using an Invitrogen Easy-DNA kit for further analysis. The genomic DNA was prepared for Illumina mate pair sequencing using the gel-free version of an Illumina Nextera mate pair sample preparation kit and strictly following protocol revision D and was sequenced using an Illumina platform.
Prior to assembly, the data quality was assessed using the FastQC quality control tool (http://www.bioinformatics.babraham.ac.uk/projects/fastqc/), and reads with a quality score of below 20 were filtered out. The genomes of the four strains were assembled using SOAPdenovo2 software (19) by combining paired-end and mate pair raw reads. Subsequently, the two integration points of the chromosomally translocated region were verified by PCR amplification and Sanger sequencing (see Text S1 in the supplemental material). Amplicons produced from the four strains were selected for sequencing and shipped to Macrogen Inc. (Amsterdam, the Netherlands) for sequencing using the same primers as were used in the PCR analysis. The genomes of the four strains were reassembled using the CLC bio Workbench by combining the Sanger sequences with the previously assembled scaffold.
Open reading frames (ORFs) were predicted on the scaffolds using Prodigal software (20) and were subsequently functionally annotated by constructing functional profiles for all proteins using the PanFunPro tool (21).
A functional profile is the combination of all nonrepeating functional domains in each ORF. The profiles were created by using InterProScan software to scan the annotated proteins against the collections PfamA, TIGRFAM, and Superfamily based on hidden Markov models (HMMs) to identify nonoverlapping functional domains with an E value below 0.001 (21). Through this annotation and analysis, the position of the IncQ1 replicon fragment was identified in every strain. The respective scaffolds containing this fragment were further compared to the complete genome and plasmid pHCM1 of reference strain S. Typhi CT18 (National Center for Biotechnology Information accession no. AL513382; length of 4,809,037 bp) in order to determine the exact insertion site and the homology between the strains (see Table S1E and F in the supplemental material).
Screenings for mutations in DNA gyrase and DNA topoisomerase IV genes.
Each of the 33 S. Typhi genomes was examined for the presence of mutations in the DNA gyrase gyrA and gyrB genes and in the DNA topoisomerase IV parC and parE genes (22) by determining single nucleotide polymorphisms (SNPs) in comparison with S. Typhi CT18. Additionally, the gyrA sequences of quinolone-resistant strains (strains 269 and 748) were extracted and translated.
Phylogenetic structure of S. Typhi determined using single nucleotide polymorphisms, calculation of the ratio of nonsynonymous to synonymous evolutionary changes (dN/dS), identification of S. Typhi haplotypes, and genomic deletions.
SNPs were determined using the SnpTree (version 1.1) pipeline available on the CGE website (23). Fundamentally, each of the assembled genomes or contigs was aligned against the reference S. Typhi CT18 genome using the application “Nucmer” of MUMmer version 3.23 (24). SNPs were identified from the alignments using “Show-snps” (using option “-Cl1rT”) from MUMmer. Subsequently, SNPs were selected that met the following criteria: (i) a minimum distance of 20 bp between SNPs and (ii) exclusion of all indels. The selected SNPs from assembled genomes were confirmed by SNPs being called by mapping raw reads to the reference genome using the Burrows-Wheeler transform (BWA) method (25) and SAMTools (26).
The qualified SNPs from each genome were concatenated to a single alignment corresponding to a position of the reference genome using an in-house Perl script. In cases in which SNPs were absent in the reference genome, they were interpreted as not being a variation and the base from the reference genome was included (23). The concatenated sequences were subjected to multiple alignments using MUSCLE from MEGA5 (27). The final phylogenetic SNP tree was computed by MEGA5 using the maximum-likelihood method of 1,000 bootstrap replicates (28) and the Tamura-Nei model for inference (29). All 415 SNPs related to the outbreak isolates of haplotype H58B are listed in Table S1B in the supplemental material.
The ratio of the number of nonsynonymous substitutions per nonsynonymous site (dN) to the number of synonymous substitutions per synonymous site (dS) is a measurement of stabilizing selection (30). A ratio of 1 is expected in the absence of selection, and a low ratio (dN/dS of <1) indicates stabilizing selection, while a high ratio (dN/dS of >1) indicates positive selection (31). The dN/dS ratio was calculated for each of the core genes (the genes found in all S. Typhi genomes in this study) using codeML from the package PAML (32). The approximation of the dN/dS ratio was an average of the dN/dS values from all core genes.
In contrast to methods previously described by Roumagnac et al. (33), a whole-genome sequencing approach was used to assigned biallelic polymorphism positions (BiP) to all the genomes included this study based on BiPs in the S. Typhi CT18 reference genome using a python script. All BiPs are listed in Table S1C in the supplemental material. The haplotype of each genome was determined by the combination of assigned BiPs using the haplotype dendrogram by Roumagnac et al. (33), such as haplotype H58 being defined by BiP36, BiP48, BiP56, and BiP33. Additionally, node B of haplotype H58 lineage I was determined based on SNP position 1193220 as defined by Kariuki et al. (34).
Indels and deletions were excluded from the SNP analysis; therefore, a BLAST atlas based on BLASTP (35) was used to visualize the homology in a comparison of the genomes to the S. Typhi CT18 reference genome in order to identify potential deletions. The putative deletions were aligned against Zambian genomes using execrate (36). The hit score was calculated by multiplying the percent identity by the deletion's alignment length and dividing by the deletion's sequence length. The presence of deletions in the Zambian genomes was confirmed based on a hit score with a threshold of at least 95%. The presence or absence of the deletions was finally visualized in a heat map sorted for comparison according to the position of the strains in the phylogenetic tree. Details of the genomic deletions detected in this study are listed in Table S1D in the supplemental material.
Nucleotide sequence accession number.
The raw sequence data have been submitted to the European Nucleotide Archive (http://www.ebi.ac.uk/ena) under accession number PRJEB7846.
RESULTS
Epidemiological data.
A total of 2,040 cases were identified from a population of 14.2 million inhabitants during the outbreak from January 2010 to September 2012, with a median of 48 cases identified per month (Fig. 1). The number of cases ranged from 1 case in February 2010 to 246 cases in February 2012. Among the 41 periurban health centers in Lusaka (2.1 million inhabitants), cases ranged from 1 to 369 cases per center, with a median of 10 cases per center (Zambia Ministry of Health, internal report).
FIG 1.

Number of cases with the outbreak strain of Salmonella serovar Typhi by month in Zambia in the period from January 2010 to September 2012 (n = 2,040). Jan, January; Feb, February; Mar, March; Apr, April; Maj, May; Jun, June; Jul, July; Aug, August; Sep, September; Okt, October; Nov, November; Dec, December. (Based on data from an internal report of the Zambia Ministry of Health.)
The overall case fatality rate was estimated to be 0.5% during the outbreak period (Zambia Ministry of Health, internal report). The majority of cases (n = 1,771; 87%) occurred in children less than 15 years of age, ranging from 22 (1.1%) cases among children less than 8 months of age to 4 cases (0.2%) among patients older than 61 years (Fig. 2). Most cases (n = 1,200; 58.8%) were observed within the age group between 6 and 15 years of age. The cases were evenly distributed by gender, with 1,078 (52.8%) male cases (Fig. 2) (Zambia Ministry of Health, internal report).
FIG 2.
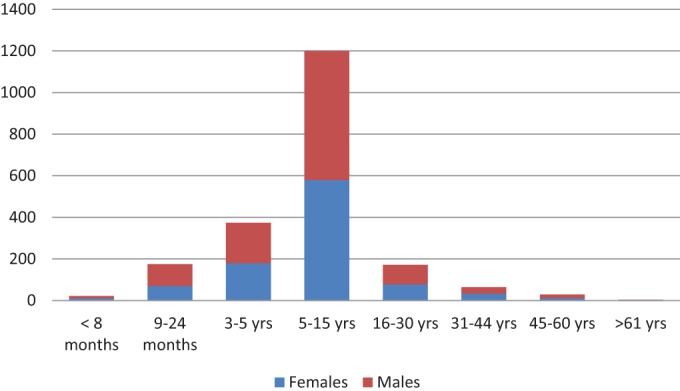
Distribution of age and gender in numbers of cases (y axis) among Zambian patients infected with Salmonella serovar Typhi in January 2010 to September 2012 (n = 2,040). (Based on data from an internal report of the Zambia Ministry of Health.)
Antimicrobial resistance, antimicrobial resistance genes, plasmid replicons, and the chromosomally translocated MDR region.
The MIC determination of the 94 S. Typhi isolates revealed a high frequency of antimicrobial resistance. Most (83%) of the S. Typhi isolates exhibited resistance to a core of five antimicrobials: ampicillin, chloramphenicol, streptomycin, sulfamethoxazole, and trimethoprim (Table 1). Four (4.3%) of the isolates showed a low level (reduced susceptibility) of resistance to ciprofloxacin. Of those, three (3.2%) isolates were also resistant to nalidixic acid. None of the isolates were resistant to the following antimicrobials: apramycin (approved for veterinary use only), azithromycin, cefotaxime, ceftiofur (approved for veterinary use only), colistin, florfenicol (approved for veterinary use only), gentamicin, neomycin, spectinomycin, and tetracycline. One isolate (551) was pansusceptible (Table 1). The frequencies of antimicrobial resistance were similar for the submitted stool (n = 8) and blood (n = 86) samples (Table 1).
Among the 33 WGST S. Typhi isolates, all but the pansusceptible isolate (551) (97.0%) exhibited phenotypic antimicrobial resistance (MIC) to the following antimicrobials: ampicillin, streptomycin, sulfamethoxazole, and trimethoprim. In addition, 27 (81.8%), 4 (12.1%), and 2 (6.1%) of the isolates also exhibited resistance to chloramphenicol, amoxicillin plus clavulanic acid, and ciprofloxacin-nalidixic acid, respectively (Table 1).
All 32 resistant WGST isolates contained the following genes: strA, strB, ΔaadA1 (aminoglycoside; streptomycin), and blaTEM-1 (beta-lactam; ampicillin). Among the 32 resistant isolates, some harbored different genes for resistance to drugs within the same drug class, such as genes for resistance to sulfamethoxazole; for example, isolates 6, 14, 35, 739, and 1341 contained only the sul2 gene, whereas isolate 5 harbored only the sul1 gene. The remaining resistant isolates all contained both the sul1 gene and the sul2 gene. For trimethoprim, isolates 6, 14, 35, 739, and 1341 contained the dfrA14 gene whereas the remaining isolates all harbored the dfrA7 gene. Of the 32 resistant isolates, all except isolates 6, 14, 35, 739, and 1341 presented resistance to chloramphenicol and harbored the catA1 gene.
All 32 resistant WGST isolates were investigated for the presence of fluoroquinolone resistance associated with mutations in the quinolone resistance determinant regions (QRDRs) of the gyrase and DNA topoisomerase IV genes gyrA, gyrB, parC, and parE and the plasmid-mediated quinolone resistance (PMQR) genes qnrA, qnrB, qnrC, qnrD, qnrS, qepA, and aac(6′)-lb. In two strains, strains 269 and 748, different single mutations in the gyrA QRDR were detected that led to an amino acid substitution in codon Asp87 (Asp-Asn) in strain 269 and in codon Ser83 (Ser-Tyr) in strain 748. This correlates well with their phenotypes, as these were found to exhibit decreased susceptibility to ciprofloxacin and resistance to nalidixic acid. The two remaining isolates showing decreased susceptibility to ciprofloxacin were not among the isolates selected for WGST and therefore were not investigated for the presence of above-mentioned genes or mutations.
Importantly, according to the results of sequencing analysis performed using PlasmidFinder, none of the 33 WGST S. Typhi isolates appeared to possess the globally dominant IncHI1 plasmid replicon type normally found in haplotype H58. However, the analysis revealed 27 isolates containing an IncQ1 plasmid replicon sequence (repC and ΔrepA in Fig. 3). In addition, five isolates, isolates 6, 14, 35, 739, and 1341, contained an IncFIB plasmid replicon. One isolate, the pansusceptible 551 isolate, did not reveal any plasmid replicons.
FIG 3.

Overview of the IncHI1 plasmid region of Salmonella serovar Typhi translocated to the chromosome of Salmonella serovar Typhi from Zambia. The top genetic structure illustrates the multidrug-resistant island of pHCM1/IncHI1 in S. Typhi haplotype H58. The second structure illustrates the recombined structure of the multidrug-resistant island of the four Zambian S. Typhi strains, whereas the bottom structure indicates the chromosomal translocation site of the multidrug-resistant island related to Zambian strains.
It was confirmed that ΔrepA and repC, a truncated IncQ1 region, were present in the plasmid DNA region of all four of strains 31, 34, 54, and 71 in the in silico comparison with the S. Typhi CT18 reference strain. Despite the presence of plasmid replicons in the genomes of the strains, none of them seemed to harbor complete plasmids that could be transferred or extracted by several commercially available kits in vitro. Bioinformatic analysis of the combined paired-end, mate pair, and Sanger sequencing results from the four isolates revealed a translocation of the IncQ1 plasmid replicon and the antimicrobial resistance islands from an ancestral IncHI1 plasmid to identical positions in the chromosome of the present Zambian S. Typhi isolates (Fig. 3). The chromosomally translocated region had a size of approximately 23,376 bp (isolate 54), and the chromosome was inserted between bp 3470424 and bp 3472059 and flanked by the cyaY and cyaA genes according to the S. Typhi CT18 reference genome (Fig. 3). The gene contents of the four strains were highly similar. The translocated region carried a complete mercury resistance (mer) operon, a tnpM gene, and an IS3 element flanked the truncated IncQ1 replicon which was succeeded downstream by genes encoding resistance to sulfonamides (sul2) and streptomycin (strA and strB). These resistance genes were flanked by a transposase gene, tnpB, and another gene conferring resistance to β-lactams, blaTEM-1. Between two IS26 inserted sequences, tnpR, a class 1 integron consisting of an integrase gene, int, ΔaadA1, and dfrA7, was localized and flanked by genes encoding quaternary ammonium compound resistance, qucE (sulfonamide resistance), sul2 (upstream), and a transposase, tnpM (downstream). Yet another IS26, a tnpA element, flanked the integrin cassette further downstream alongside the GNAT (GCN5-related N-acetyltransferase) and catA1 genes encoding acetyltransferase and chloramphenicol resistance, respectively (Fig. 3). In addition, the PCR amplification of the two integration points of the chromosomally translocated region on the remaining strains revealed that all of the isolates except six, isolates 6, 14, 35, 739, 1341, and 551, produced amplicons. This indicates that all of the isolates except those six similarly contained the chromosomally translocated region.
MLST, haplotypes, dN/dS ratio, and population structure of S. Typhi-based haplotypes, single nucleotide polymorphisms, and genomic deletions.
Of the 33 S. Typhi genomes, 32 belonged to MLST ST1 and a new minor variant of haplotype H58 node B of Kenyan S. Typhi lineage I. As suggested by Mark Achtman (personal communication), we do not propose a number or a name for this variant (H58B var.). The genetic evolution of the 32 H58B var. genomes seems to have represented neutral stabilizing selection based on core genes, as the dN/dS ratio was 0.94, indicating limited adaptive evolution and recombination. The pansusceptible 551 isolate belonged to MLST ST2 and haplotype H14.
A phylogenetic SNP tree rooted to the S. Typhi CT18 reference genome belonging to haplotype H1 with the inclusion of the available nonoutbreak genomes from sub-Saharan Africa and Asia of haplotype H58 was reconstructed to investigate the evolutionary relationships (Fig. 4A). The tree revealed 1,744 high-quality whole-genome SNPs. Two synapomorphic (i.e., clade-specific) SNPs were detected among the Zambian genomes (excluding the genome of strain 551) defining the new minor variant, H58B var. of haplotype H58B (Fig. 4A, marked in blue). One of the two synapomorphic SNPs was synonymous at position 4638263, causing substitution C-T. The other synapomorphic SNP identified was located at position 789347 in the intergenic region, leading to the substitution G-A.
FIG 4.

Phylogenetic reconstruction of the evolutionary relationships among the Salmonella serovar Typhi genomes from Zambia. Numbers marked in red indicate autapomorphic SNPs (for Fig. 4B), those in blue indicate synapomorphic SNPs, and those in green indicate the total SNP difference between isolates. In panel A, the genomes belonging to H58B var. from Zambia are marked in pink.
The topology of the reference genome S. Typhi CT18 rooted tree showed that the haplotype H58 outgroup neighbors closest to the 32 Zambian S. Typhi haplotype H58B var. genomes were ISP-04-06979 from Central Africa and E02-2759 from India, which were separated by 34 and 52 SNPs, respectively (Fig. 4A).
A similar reference genome rooted phylogenetic SNP tree that included the outbreak genomes from Zambia belonging to haplotype H58B var. (excluding isolate 551; H14) contained overall 415 high-quality whole-genome SNPs. Among those, 47 were autapomorphic (i.e., genome-specific) SNPs (marked in red) and 3 were synapomorphic (clade-specific) SNPs (marked in blue; two SNPs defining H58B var. and one at position 2024187 causing substitution Gly-Ser, representing a clade consisting of four genomes, genomes 1, 15, 46, and 53) (Fig. 4B). The topology of the SNP tree revealed three clades of four to six genomes each separated in a pairwise manner by fewer than 15 SNPs.
Overall, SNPs were relatively frequent among the 32 S. Typhi isolates of haplotype H58B var., separating individual isolates from the nearest neighbor with 2 to 62 SNPs of pairwise separation. The phylogenetic analysis provided evidence for clonal diversity among the WGST population, with a large monophyletic substructure (subclade[s]) that displays clear differentiations. There was no obvious clustering related to time (year) within the S. Typhi phylogenetic groups. However, one of the monophyletic subclades was observed to contain the four isolates 14, 35, 1341, and 739—all in concurrence with the variation in antimicrobial resistance genes and plasmid replicon compared to those of the remaining WGST isolates (Fig. 4B).
Deletions were relatively common among the 32 WGST genomes, excluding strain 551 (H14), in comparison with the S. Typhi CT18 reference genome. Thirty-five deletions were detected among the genomes, ranging in the number of deleted genes and size from one gene (29 deletions) and deletion D19 (173 bp; STY2210) to six genes (one deletion) and deletion D14 (4,038 bp; STY2181 to STY2186) (Fig. 5; see also Table S1D in the supplemental material). The majority (n = 26; 74%) of the deletions affected more than 28 of the genomes (Fig. 5). Sparse clustering was observed among the genomes, where, in particular, genomes 7 and 12 (11-05-2010) and genomes 15 and 9 lacked deletions D2, D6, D28, D29, and D30. This clustering is in agreement with the topology of the phylogenetic SNP analysis, whereas the overall clustering based on deletions was not consistent (Fig. 4B and 5). One genome, genome 8, was more conserved than the other genomes, lacking 17 of the 35 deletions.
FIG 5.

Genomic deletions detected in the Salmonella serovar Typhi genomes from Zambia. Deletions (marked in black) are based on a 95% hit score. Affected genes are partially or entirely deleted.
DISCUSSION
Among the 33 WGST strains, we did not find any replicon for an IncHI1 plasmid, normally associated with “classical MDR haplotype H58” (34). Apart from plasmid replicon IncHI1, only a few other replicons have been observed in S. Typhi—all in isolates originating from Pakistan (38). Here, the IncFIA plasmid replicon seemed to be predominant but IncFIIA, IncP, and IncB/O replicons were also identified.
In this study, we identified 27 S. Typhi isolates containing an IncQ1 plasmid replicon fragment and five isolates with an intact IncFIB plasmid replicon. We confirmed by additional Sanger sequencing that 4 of 27 IncQ1-positive isolates harbored a chromosomally translocated antimicrobial resistance region. Acquisition of chromosomally translocated regions containing antimicrobial resistance islands, integrons, and mercury resistance genes has previously been observed in S. Typhimurium. A unique 82-kb genomic island, GI-DT12, was recently reported in an S. Typhimurium isolate collected from a human gastroenteritis case. The region was believed to have been acquired by horizontal gene transfer and harbored a class one integron, a mer operon, and several resistance genes believed to contribute to survival ability in adverse environments (39). This raises the issue of whether the acquisition of the chromosomal translocated region of the Zambian S. Typhi isolates was the consequence of an adverse environment due to poor sanitation. Acquisition of fragments of the IncQ1 plasmid replicon and antimicrobial resistance islands similar to those identified in this study has been reported in S. Typhimurium and S. Enteritidis evolving from the R27/IncHI1 plasmid through cointegration with the pHCM1/IncHI1 plasmid of ancestral S. Typhi strains (40, 41). However, none of the nontyphoid Salmonella serovars contained the islands with the catA1 gene and mer operon as observed in this study, nor did the authors describe how and where the class 1 integron originated. Interestingly, we found the entire region from H58 S. Typhi plasmid pHCM1 (GenBank accession number NC_003384; originating from strain CT18) (42) containing seven antimicrobial resistance genes, fragments of the IncQ1 plasmid replicon (ΔrepA, repC), a class 1 integron, and the mer operon chromosomally translocated but recombined according to the structure described by Miriagou et al. (41). We suggest that the class 1 integron containing the dfrA7 gene, and first described in the IncHI1 plasmid from S. Typhi in 2003 (43), recently integrated the entire MDR region from another position in an IncHI1 plasmid prior to the chromosomal translocation. This is, to the best of our knowledge, the first time that this chromosomal translocation has been observed in S. Typhi. However, it might be more commonly the case than anticipated that S. Typhi haplotype H58B harbors the IncHI1 plasmid or chromosomally translocated antimicrobial resistance islands or both. It has been hypothesized that a milestone of IncHI1 plasmid evolution had been reached around 1996 by the acquisition of increased fitness, with the result that the IncHI1 plasmid has outcompeted all other plasmid types in S. Typhi (44). However, it has also been argued that plasmid fitness cost must play a role in maintaining IncHI1 plasmids in S. Typhi. Given the chromosomal translocation of the IncHI1 plasmid region in this new variant of S. Typhi H58, we can only speculate as to what effect this will have with respect to the virulence, transmission, and acquisition of antimicrobial resistance genes, e.g., those coding for extended-spectrum β-lactamase.
Since historical data on S. Typhi haplotypes are not available from Zambia, the details concerning the origin, possible introduction, and transmission to Zambia are unknown. The influx of and presence of great numbers of Indian immigrants in Zambia and travel to and from India by those immigrants could have resulted in the introduction into Zambia of S. Typhi H58B var. carrying the chromosomally translocated region containing the MDR islands of the IncHI1 plasmid and the fragment of the IncQ1 plasmid replicon. However, a more plausible hypothesis is that an ancestral S. Typhi H58B strain spread from Kenya to Zambia, where it evolved early on to S. Typhi H58B var. and acquired the region containing the MDR islands that included the class 1 integron and the fragment of the IncQ1 plasmid replicon by translocation from the IncHI1 plasmid. To test this hypothesis, historical and contemporary isolates from Kenya, the sub-Indian continent, and Zambia need to be further investigated.
The high-resolution phylogenetic SNP analysis of the Zambia outbreak isolates in relation to the outgroup of nonoutbreak strains demonstrated that the Zambian S. Typhi outbreak genomes belonged to a monophyletic group derived from a single recent common ancestor consistent with a genetic bottleneck and subsequent radiation into an open niche. The speculation that such a common ancestor could have originated from India or a neighboring country was supported by the relatedness to H58 genomes from Central Africa and India, which were separated by only 34 and 52 SNPs, respectively.
The SNP analysis revealed 2 to 62 SNPs separating the isolates causing disease, suggesting that multiple lineages were circulating at the points of introduction. Overall, these data appear to suggest that the outbreak was caused by a single MDR clone (83% of isolates) persisting during the outbreak period, while occasional other S. Typhi lineages, including sensitive ones, continued to cocirculate. This hypothesis is supported by several studies indicating mutation rates for nontyphoidal Salmonella strains or SNP differences among outbreaks. Thus, Hawkey et al. suggested a mutation rate of 3 to 5 SNPs per year, which is consistent with the differences observed among genomes in several of the clades representing the outbreak period from 2010 to 2012 (45). This hypothesis is also supported by the differences of up to 30 SNPs observed among strains in six outbreaks investigated by Leekitcharoenphon et al. (46). In contrast, a lower rate of 1 to 2 SNPs was suggested by Okoro et al. (47), which seems to be a bit low in relation to our data. It was suggested that the outbreak in Zambia was a result of environmental changes, poor sanitation, or a high influx of infected people from neighboring countries. This hypothesis is also supported by the epidemiological data indicating that typhoid fever is endemic and that the outbreak had been ongoing for several years with minimal intervention and control programs.
The high level of resistance to first-line antimicrobials for treatment of typhoid fever is worrisome, as 83% of the isolates were resistant to five antimicrobial drug classes, aminoglycosides, beta-lactams, phenicols, sulfonamides, and trimethoprim, and were classified as being MDR (48). A similar resistance pattern has also been described to be emerging around the world (34, 48, 49). Additionally, a high level of resistance in S. Typhi to quinolones and fluoroquinolones, including resistance resulting from single mutations in the QRDR of the gyrA gene, has also been reported (1, 34, 42, 49, 50). In this study, we found 4.3% of the isolates being classified as nalidixic acid resistant due to single mutations in gyrA at codon Ser83 or codon Asp87. This is the first time that this phenotype has been observed in Zambia. This has resulted in clinicians trying alternative antimicrobial treatment regimens such as the use of ceftriaxone and azithromycin (3). Treatment with ceftriaxone in shortened courses has shown significant relapse rates but has also shown ceftriaxone to be a realistic choice as an alternative drug with clinical cure and good reliability (50). However, whether resistance to third-generation cephalosporins has emerged has been debated (51–55). Due to the presence of MDR and quinolone-resistant isolates, it has been recommended that developing countries should use azithromycin as a first-priority drug (1, 48, 50). The development of resistance calls for restrictive use, avoiding over-the-counter usage and establishing real-time global antimicrobial surveillance to monitor the development of antimicrobial resistance and enabling action to be taken at as early a stage as possible.
In this report, there is a disconnection between the presentation of epidemiological data and the selection of only 94 isolates for MIC and 33 for WGST. Only a limited number of the 2,040 outbreak strains often encountered in working with developing countries were in fact available for further analysis, as only low numbers of isolates are stored in normal circumstances. Despite the low number of strains that were susceptibility tested and WGST, we believe that the results and findings are valid, but we also believe that they should be interpreted with care. Thus, the results of the determinations of the genetic relatedness were believed to be valid due to the selective criteria of the limited number of isolates.
The common view is that emerging global S. Typhi haplotype H58B, containing the MDR IncHI1 plasmid, is responsible for the majority of typhoid infections in Asia and sub-Saharan Africa; we found that a new variant of the haplotype harboring a chromosomally translocated region containing the MDR islands of IncHI1 plasmid has emerged in Zambia. This could change the perception of the term “classical MDR typhoid” currently being solely associated with the IncHI1 plasmid. It might be more common than anticipated that S. Typhi haplotype H58B harbors the IncHI1 plasmid or a chromosomally translocated MDR region or both.
The phylogenetic analysis and deletions suggest that a single MDR clone was responsible for the outbreak during which occasional other S. Typhi lineages, including sensitive ones, continued to cocirculate.
In addition to the isolates being MDR, a moderate number of the isolates were also resistant to fluoroquinolones. In general, there is an urgent need for the global community to take on the responsibility of assisting developing countries to control emerging infectious diseases such as typhoid fever by improving sanitation and living conditions or possibly by conducting vaccination trials and, additionally, to develop easy-to-use real-time whole-genome sequencing tools to assist tracking those emerging infectious diseases with respect to patterns and clonal spread for control measurements and, ideally, for predicting local disease hot spots.
Supplementary Material
ACKNOWLEDGMENTS
We thank the Ministry of Health, Zambia, for permission to send the isolates. We are grateful to Mark Achtman and Zhemin Zhou, Warwick Medical School University, Warwick, Coventry, Ireland, for providing biallelic polymorphism positions.
This work was supported by the Danish Council for Strategic Research (grant number 09-067103) and by the World Health Organization Global Food-borne Infections Network.
Footnotes
Supplemental material for this article may be found at http://dx.doi.org/10.1128/JCM.02026-14.
REFERENCES
- 1.Parry CM, Hien TT, Dougan G, White NJ, Farrar JJ. 2002. Typhoid fever. N Engl J Med 347:1770–1782. doi: 10.1056/NEJMra020201. [DOI] [PubMed] [Google Scholar]
- 2.Crump JA, Luby SP, Mintz ED. 2004. The global burden of typhoid fever. Bull World Health Organ 82:346–353. [PMC free article] [PubMed] [Google Scholar]
- 3.Crump JA, Mintz ED. 2010. Global trends in typhoid and paratyphoid fever. Clin Infect Dis 50:241–246. doi: 10.1086/649541. [DOI] [PMC free article] [PubMed] [Google Scholar]
- 4.Hendriksen RS, Vieira AR, Karlsmose S, Lo Fo Wong DM, Jensen AB, Wegener HC, Aarestrup FM. 14 April 2011, posting date Global monitoring of Salmonella serovar distribution from the World Health Organization Global Foodborne Infections Network Country Data Bank: results of quality assured laboratories from 2001 to 2007. Foodborne Pathog Dis doi: 10.1089/fpd.2010.0787. [DOI] [PubMed] [Google Scholar]
- 5.Mogasale V, Maskery B, Ochiai RL, Lee JS, Mogasale VV, Ramani E, Kim YE, Park JK, Wierzba TF. 2014. Burden of typhoid fever in low-income and middle-income countries: a systematic, literature-based update with risk-factor adjustment. Lancet Glob Health 2:e570–e580. doi: 10.1016/S2214-109X(14)70301-8. [DOI] [PubMed] [Google Scholar]
- 6.Morpeth SC, Ramadhani HO, Crump JA. 2009. Invasive non-Typhi Salmonella disease in Africa. Clin Infect Dis 49:606–611. doi: 10.1086/603553. [DOI] [PMC free article] [PubMed] [Google Scholar]
- 7.Centers for Disease Control and Prevention (CDC). 2012. Notes from the field: Salmonella Typhi infections associated with contaminated water—Zimbabwe, October 2011–May 2012. MMWR Morb Mortal Wkly Rep 61:435. [PubMed] [Google Scholar]
- 8.Lunguya O, Phoba MF, Mundeke SA, Bonebe E, Mukadi P, Muyembe JJ, Verhaegen J, Jacobs J. 2012. The diagnosis of typhoid fever in the Democratic Republic of the Congo. Trans R Soc Trop Med Hyg 106:348–355. doi: 10.1016/j.trstmh.2012.03.006. [DOI] [PubMed] [Google Scholar]
- 9.Mtove G, Amos B, von Seidlein L, Hendriksen I, Mwambuli A, Kimera J, Mallahiyo R, Kim DR, Ochiai RL, Clemens JD, Reyburn H, Magesa S, Deen JL. 2010. Invasive salmonellosis among children admitted to a rural Tanzanian hospital and a comparison with previous studies. PLoS One 5:e9244. doi: 10.1371/journal.pone.0009244. [DOI] [PMC free article] [PubMed] [Google Scholar]
- 10.Neil KP, Sodha SV, Lukwago L, Tipo S, Mikoleit M, Simington SD, Mukobi P, Balinandi S, Majalija S, Ayers J, Kagirita A, Wefula E, Asiimwe F, Kweyamba V, Talkington D, Shieh WJ, Adem P, Batten BC, Zaki SR, Mintz E. 2012. A large outbreak of typhoid fever associated with a high rate of intestinal perforation in Kasese District, Uganda, 2008–2009. Clin Infect Dis 54:1091–1099. doi: 10.1093/cid/cis025. [DOI] [PubMed] [Google Scholar]
- 11.Nelson C. 4 April 2012. Controlling the typhoid epidemic plaguing sub-Saharan Africa. The Atlantic http://www.theatlantic.com/health/archive/2012/04/controlling-the-typhoid-epidemic-plaguing-sub-saharan-africa/255243/.
- 12.Levy H, Diallo S, Tennant SM, Livio S, Sow SO, Tapia M, Fields PI, Mikoleit M, Tamboura B, Kotloff KL, Lagos R, Nataro JP, Galen JE, Levine MM. 2008. PCR method to identify Salmonella enterica serovars Typhi, Paratyphi A, and Paratyphi B among Salmonella isolates from the blood of patients with clinical enteric fever. J Clin Microbiol 46:1861–1866. doi: 10.1128/JCM.00109-08. [DOI] [PMC free article] [PubMed] [Google Scholar]
- 13.Clinical and Laboratory Standards Institute. 2014. Performance standards for antimicrobial susceptibility testing. M100-S24; 24th informational supplement Clinical and Laboratory Standards Institute, Wayne, PA. [Google Scholar]
- 14.Clinical and Laboratory Standards Institute. 2012. Methods for dilution antimicrobial susceptibility tests for bacteria that grow aerobically. M07-A9; 9th ed. Approved standard Clinical and Laboratory Standards Institute, Wayne, PA. [Google Scholar]
- 15.Carattoli A, Zankari E, Garcia-Fernandez A, Volby LM, Lund O, Villa L, Aarestrup FM, Hasman H. 28 April 2014. PlasmidFinder and pMLST: in silico detection and typing of plasmids. Antimicrob Agents Chemother doi: 10.1128/AAC.02412-14. [DOI] [PMC free article] [PubMed] [Google Scholar]
- 16.Larsen MV, Cosentino S, Rasmussen S, Friis C, Hasman H, Marvig RL, Jelsbak L, Sicheritz-Ponten T, Ussery DW, Aarestrup FM, Lund O. 2012. Multilocus sequence typing of total-genome-sequenced bacteria. J Clin Microbiol 50:1355–1361. doi: 10.1128/JCM.06094-11. [DOI] [PMC free article] [PubMed] [Google Scholar]
- 17.Zankari E, Hasman H, Cosentino S, Vestergaard M, Rasmussen S, Lund O, Aarestrup FM, Larsen MV. 2012. Identification of acquired antimicrobial resistance genes. J Antimicrob Chemother 67:2640–2644. doi: 10.1093/jac/dks261. [DOI] [PMC free article] [PubMed] [Google Scholar]
- 18.Sirichote P, Hasman H, Pulsrikarn C, Schonheyder HC, Samulioniene J, Pornruangmong S, Bangtrakulnonth A, Aarestrup FM, Hendriksen RS. 2010. Molecular characterization of extended-spectrum cephalosporinase-producing Salmonella enterica serovar Choleraesuis isolates from patients in Thailand and Denmark. J Clin Microbiol 48:883–888. doi: 10.1128/JCM.01792-09. [DOI] [PMC free article] [PubMed] [Google Scholar]
- 19.Luo R, Liu B, Xie Y, Li Z, Huang W, Yuan J, He G, Chen Y, Pan Q, Liu Y, Tang J, Wu G, Zhang H, Shi Y, Liu Y, Yu C, Wang B, Lu Y, Han C, Cheung DW, Yiu SM, Peng S, Xiaoqian Z, Liu G, Liao X, Li Y, Yang H, Wang J, Lam TW, Wang J. 2012. SOAPdenovo2: an empirically improved memory-efficient short-read de novo assembler. Gigascience 1:18. doi: 10.1186/2047-217X-1-18. [DOI] [PMC free article] [PubMed] [Google Scholar]
- 20.Hyatt D, Chen GL, Locascio PF, Land ML, Larimer FW, Hauser LJ. 2010. Prodigal: prokaryotic gene recognition and translation initiation site identification. BMC Bioinformatics 11:119. doi: 10.1186/1471-2105-11-119. [DOI] [PMC free article] [PubMed] [Google Scholar]
- 21.Lukjancenko O, Thomsen MC, Volby Larsen M, Ussery DW. 2013. PanFunPro: PAN-genome analysis based on FUNctional PROfiles [v1; ref status: approved with reservations 3, http://f1000r.es/2e1]. F1000Research 2:265. doi: 10.12688/f1000research.2-265.v1. [DOI] [Google Scholar]
- 22.Song Y, Roumagnac P, Weill FX, Wain J, Dolecek C, Mazzoni CJ, Holt KE, Achtman M. 2010. A multiplex single nucleotide polymorphism typing assay for detecting mutations that result in decreased fluoroquinolone susceptibility in Salmonella enterica serovars Typhi and Paratyphi A. J Antimicrob Chemother 65:1631–1641. doi: 10.1093/jac/dkq175. [DOI] [PMC free article] [PubMed] [Google Scholar]
- 23.Leekitcharoenphon P, Kaas RS, Thomsen MC, Friis C, Rasmussen S, Aarestrup FM. 2012. snpTree–a web-server to identify and construct SNP trees from whole genome sequence data. BMC Genomics 13(Suppl 7):S6. doi: 10.1186/1471-2164-13-S7-S6. [DOI] [PMC free article] [PubMed] [Google Scholar]
- 24.Delcher AL, Phillippy A, Carlton J, Salzberg SL. 2002. Fast algorithms for large-scale genome alignment and comparison. Nucleic Acids Res 30:2478–2483. doi: 10.1093/nar/30.11.2478. [DOI] [PMC free article] [PubMed] [Google Scholar]
- 25.Li H, Durbin R. 2009. Fast and accurate short read alignment with Burrows-Wheeler transform. Bioinformatics 25:1754–1760. doi: 10.1093/bioinformatics/btp324. [DOI] [PMC free article] [PubMed] [Google Scholar]
- 26.Li H, Handsaker B, Wysoker A, Fennell T, Ruan J, Homer N, Marth G, Abecasis G, Durbin R. 2009. The Sequence Alignment/Map format and SAMtools. Bioinformatics 25:2078–2079. doi: 10.1093/bioinformatics/btp352. [DOI] [PMC free article] [PubMed] [Google Scholar]
- 27.Tamura K, Peterson D, Peterson N, Stecher G, Nei M, Kumar S. 2011. MEGA5: molecular evolutionary genetics analysis using maximum likelihood, evolutionary distance, and maximum parsimony methods. Mol Biol Evol 28:2731–2739. doi: 10.1093/molbev/msr121. [DOI] [PMC free article] [PubMed] [Google Scholar]
- 28.Felsenstein J. 1985. Confidence limits on phylogenies: an approach using the bootstrap. Evolution 39:783–791. doi: 10.2307/2408678. [DOI] [PubMed] [Google Scholar]
- 29.Tamura K, Nei M. 1993. Estimation of the number of nucleotide substitutions in the control region of mitochondrial DNA in humans and chimpanzees. Mol Biol Evol 10:512–526. [DOI] [PubMed] [Google Scholar]
- 30.Holt KE, Parkhill J, Mazzoni CJ, Roumagnac P, Weill FX, Goodhead I, Rance R, Baker S, Maskell DJ, Wain J, Dolecek C, Achtman M, Dougan G. 2008. High-throughput sequencing provides insights into genome variation and evolution in Salmonella Typhi. Nat Genet 40:987–993. doi: 10.1038/ng.195. [DOI] [PMC free article] [PubMed] [Google Scholar]
- 31.Rocha EP, Smith JM, Hurst LD, Holden MT, Cooper JE, Smith NH, Feil EJ. 2006. Comparisons of dN/dS are time dependent for closely related bacterial genomes. J Theor Biol 239:226–235. doi: 10.1016/j.jtbi.2005.08.037. [DOI] [PubMed] [Google Scholar]
- 32.Yang Z. 2007. PAML 4: phylogenetic analysis by maximum likelihood. Mol Biol Evol 24:1586–1591. doi: 10.1093/molbev/msm088. [DOI] [PubMed] [Google Scholar]
- 33.Roumagnac P, Weill FX, Dolecek C, Baker S, Brisse S, Chinh NT, Le TA, Acosta CJ, Farrar J, Dougan G, Achtman M. 2006. Evolutionary history of Salmonella typhi. Science 314:1301–1304. doi: 10.1126/science.1134933. [DOI] [PMC free article] [PubMed] [Google Scholar]
- 34.Kariuki S, Revathi G, Kiiru J, Mengo DM, Mwituria J, Muyodi J, Munyalo A, Teo YY, Holt KE, Kingsley RA, Dougan G. 2010. Typhoid in Kenya is associated with a dominant multidrug-resistant Salmonella enterica serovar Typhi haplotype that is also widespread in Southeast Asia. J Clin Microbiol 48:2171–2176. doi: 10.1128/JCM.01983-09. [DOI] [PMC free article] [PubMed] [Google Scholar]
- 35.Hallin PF, Binnewies TT, Ussery DW. 2008. The genome BLAST atlas—a GeneWiz extension for visualization of whole-genome homology. Mol Biosyst 4:363–371. doi: 10.1039/b717118h. [DOI] [PubMed] [Google Scholar]
- 36.Slater GS, Birney E. 2005. Automated generation of heuristics for biological sequence comparison. BMC Bioinformatics 6:31. doi: 10.1186/1471-2105-6-31. [DOI] [PMC free article] [PubMed] [Google Scholar]
- 37.Reference deleted.
- 38.Mirza S, Kariuki S, Mamun KZ, Beeching NJ, Hart CA. 2000. Analysis of plasmid and chromosomal DNA of multidrug-resistant Salmonella enterica serovar typhi from Asia. J Clin Microbiol 38:1449–1452. [DOI] [PMC free article] [PubMed] [Google Scholar]
- 39.Izumiya H, Sekizuka T, Nakaya H, Taguchi M, Oguchi A, Ichikawa N, Nishiko R, Yamazaki S, Fujita N, Watanabe H, Ohnishi M, Kuroda M. 2011. Whole-genome analysis of Salmonella enterica serovar Typhimurium T000240 reveals the acquisition of a genomic island involved in multidrug resistance via IS1 derivatives on the chromosome. Antimicrob Agents Chemother 55:623–630. doi: 10.1128/AAC.01215-10. [DOI] [PMC free article] [PubMed] [Google Scholar]
- 40.Daly M, Villa L, Pezzella C, Fanning S, Carattoli A. 2005. Comparison of multidrug resistance gene regions between two geographically unrelated Salmonella serotypes. J Antimicrob Chemother 55:558–561. doi: 10.1093/jac/dki015. [DOI] [PubMed] [Google Scholar]
- 41.Miriagou V, Carattoli A, Fanning S. 2006. Antimicrobial resistance islands: resistance gene clusters in Salmonella chromosome and plasmids. Microbes Infect 8:1923–1930. doi: 10.1016/j.micinf.2005.12.027. [DOI] [PubMed] [Google Scholar]
- 42.Holt KE, Phan MD, Baker S, Duy PT, Nga TV, Nair S, Turner AK, Walsh C, Fanning S, Farrell-Ward S, Dutta S, Kariuki S, Weill FX, Parkhill J, Dougan G, Wain J. 2011. Emergence of a globally dominant IncHI1 plasmid type associated with multiple drug resistant typhoid. PLoS Negl Trop Dis 5:e1245. doi: 10.1371/journal.pntd.0001245. [DOI] [PMC free article] [PubMed] [Google Scholar]
- 43.Ploy MC, Chainier D, Tran Thi NH, Poilane I, Cruaud P, Denis F, Collignon A, Lambert T. 2003. Integron-associated antibiotic resistance in Salmonella enterica serovar typhi from Asia. Antimicrob Agents Chemother 47:1427–1429. doi: 10.1128/AAC.47.4.1427-1429.2003. [DOI] [PMC free article] [PubMed] [Google Scholar]
- 44.Phan MD, Kidgell C, Nair S, Holt KE, Turner AK, Hinds J, Butcher P, Cooke FJ, Thomson NR, Titball R, Bhutta ZA, Hasan R, Dougan G, Wain J. 2009. Variation in Salmonella enterica serovar typhi IncHI1 plasmids during the global spread of resistant typhoid fever. Antimicrob Agents Chemother 53:716–727. doi: 10.1128/AAC.00645-08. [DOI] [PMC free article] [PubMed] [Google Scholar]
- 45.Hawkey J, Edwards DJ, Dimovski K, Hiley L, Billman-Jacobe H, Hogg G, Holt KE. 2013. Evidence of microevolution of Salmonella Typhimurium during a series of egg-associated outbreaks linked to a single chicken farm. BMC Genomics 14:800. doi: 10.1186/1471-2164-14-800. [DOI] [PMC free article] [PubMed] [Google Scholar]
- 46.Leekitcharoenphon P, Nielsen EM, Kaas RS, Lund O, Aarestrup FM. 2014. Evaluation of whole genome sequencing for outbreak detection of Salmonella enterica. PLoS One 9:e87991. doi: 10.1371/journal.pone.0087991. [DOI] [PMC free article] [PubMed] [Google Scholar]
- 47.Okoro CK, Kingsley RA, Connor TR, Harris SR, Parry CM, Al-Mashhadani MN, Kariuki S, Msefula CL, Gordon MA, de Pinna E, Wain J, Heyderman RS, Obaro S, Alonso PL, Mandomando I, MacLennan CA, Tapia MD, Levine MM, Tennant SM, Parkhill J, Dougan G. 2012. Intracontinental spread of human invasive Salmonella Typhimurium pathovariants in sub-Saharan Africa. Nat Genet 44:1215–1221. doi: 10.1038/ng.2423. [DOI] [PMC free article] [PubMed] [Google Scholar]
- 48.Wain J, Hendriksen RS, Mikoleit ML, Keddy KH, Ochiai RL. 21 October 2014. Typhoid fever. Lancet doi: 10.1016/S0140-6736(13)62708-7. [DOI] [PMC free article] [PubMed] [Google Scholar]
- 49.Zaki SA, Karande S. 2011. Multidrug-resistant typhoid fever: a review. J Infect Dev Ctries 5:324–337. doi: 10.3855/jidc.1405. [DOI] [PubMed] [Google Scholar]
- 50.Butler T. 2011. Treatment of typhoid fever in the 21st century: promises and shortcomings. Clin Microbiol Infect 17:959–963. doi: 10.1111/j.1469-0691.2011.03552.x. [DOI] [PubMed] [Google Scholar]
- 51.Al Naiemi N, Zwart B, Rijnsburger MC, Roosendaal R, Debets-Ossenkopp YJ, Mulder JA, Fijen CA, Maten W, Vandenbroucke-Grauls CM, Savelkoul PH. 2008. Extended-spectrum-beta-lactamase production in a Salmonella enterica serotype Typhi strain from the Philippines. J Clin Microbiol 46:2794–2795. doi: 10.1128/JCM.00676-08. [DOI] [PMC free article] [PubMed] [Google Scholar]
- 52.Kumarasamy K, Krishnan P. 2012. Report of a Salmonella enterica serovar Typhi isolate from India producing CMY-2 AmpC beta-lactamase. J Antimicrob Chemother 67:775–776. doi: 10.1093/jac/dkr514. [DOI] [PubMed] [Google Scholar]
- 53.Morita M, Takai N, Terajima J, Watanabe H, Kurokawa M, Sagara H, Ohnishi K, Izumiya H. 2010. Plasmid-mediated resistance to cephalosporins in Salmonella enterica serovar Typhi. Antimicrob Agents Chemother 54:3991–3992. doi: 10.1128/AAC.00225-10. [DOI] [PMC free article] [PubMed] [Google Scholar]
- 54.Pfeifer Y, Matten J, Rabsch W. 2009. Salmonella enterica serovar Typhi with CTX-M beta-lactamase, Germany. Emerg Infect Dis 15:1533–1535. doi: 10.3201/eid1509.090567. [DOI] [PMC free article] [PubMed] [Google Scholar]
- 55.Rotimi VO, Jamal W, Pal T, Sovenned A, Albert MJ. 2008. Emergence of CTX-M-15 type extended-spectrum beta-lactamase-producing Salmonella spp. in Kuwait and the United Arab Emirates. J Med Microbiol 57:881–886. doi: 10.1099/jmm.0.47509-0. [DOI] [PubMed] [Google Scholar]
Associated Data
This section collects any data citations, data availability statements, or supplementary materials included in this article.