

Abstract
Aims
We asked whether acclimatisation to chronic hypoxia (CH) attenuates the level of supraspinal fatigue that is observed after locomotor exercise in acute hypoxia (AH).
Methods
Seven recreationally-active participants performed identical bouts of constant-load cycling (131±39W, 10.1±1.4min) on three occasions: 1) in normoxia (N, PIO2, 147.1mmHg); 2) in AH (FIO2, 0.105; PIO2, 73.8mmHg); 3) after 14 days in CH (5,260m; PIO2, 75.7mmHg). Throughout trials, prefrontal-cortex tissue oxygenation and middle cerebral artery blood velocity (MCAV) were assessed using near-infrared-spectroscopy and transcranial Doppler sonography. Pre- and post-exercise twitch responses to femoral nerve stimulation and transcranial magnetic stimulation were obtained to assess neuromuscular and corticospinal function.
Results
In AH, prefrontal oxygenation declined at rest (Δ7±5%) and end-exercise (Δ26±13) (P<0.01); the degree of deoxygenation in AH was greater than N and CH (P<0.05). The cerebral O2 delivery index (MCAv×CaO2) was 19±14% lower during the final minute of exercise in AH compared to N (P=0.013) and 20±12% lower compared to CH (P=0.040). Maximum voluntary and potentiated twitch force were decreased below baseline after exercise in AH and CH, but not N. Cortical voluntary activation decreased below baseline after exercise in AH (Δ11%, P=0.014), but not CH (Δ6%, P=0.174) or N (Δ4%, P=0.298). A twofold greater increase in motor evoked potential amplitude was evident after exercise in CH compared to AH and N.
Conclusion
These data indicate that exacerbated supraspinal fatigue after exercise in AH is attenuated after 14 days of acclimatisation to altitude. The reduced development of supraspinal fatigue in CH may have been attributable to increased corticospinal excitability, consequent to an increased cerebral O2 delivery.
Keywords: adaptation, altitude, exercise, transcranial magnetic stimulation
Introduction
The mechanisms underpinning impairments in exercise performance in hypoxia are not fully understood, but multiple peripheral and central mechanisms of fatigue have been proposed (Amann and Calbet, 2008, Nybo and Rasmussen, 2007, Perrey and Rupp, 2009). The rate of development of peripheral fatigue is increased during intense locomotor exercise in acute hypoxia (Amann et al., 2006b, Goodall et al., 2012). This has been documented in numerous human studies as an increased decline in the force response to motor nerve stimulation after exercise and an increased rate of rise in electromyogram (EMG) signals during exercise (Amann and Calbet, 2008). Amann et al. (2006a) suggested that the accelerated development of peripheral fatigue and associated intramuscular metabolic changes in acute moderate hypoxia restricts central motor drive preventing excessive end-exercise locomotor muscle fatigue under conditions of attenuated arterial oxygenation. It was subsequently demonstrated that in acute severe hypoxia, peripheral fatigue becomes the less important variable and the primary limitation to exercise transfers to a hypoxia-sensitive central component of fatigue (Amann et al., 2007). Less is known about the mechanism(s) of fatigue during locomotor exercise in chronic hypoxia. We recently reported the accelerated development of peripheral fatigue after locomotor exercise in acute hypoxia to be similar after a period of acclimatisation (14 days) to high altitude; conversely, the level of central fatigue was attenuated (Amann et al., 2013). The measure of central fatigue, however, was determined using peripheral stimulation and the responsiveness of the brain-to-muscle pathway after a period of chronic hypoxia remains unknown.
Transcranial magnetic stimulation (TMS) has been used to specify the site of fatigue within the central nervous system in acute severe hypoxia (Goodall et al., 2012, Goodall et al., 2010). When TMS is delivered over the motor cortex during a maximal voluntary contraction (MVC), it is possible to detect a twitch-like increment in force in the active muscle. That is, despite maximal effort, motor cortical output at the time of stimulation is insufficient to drive the motoneurons maximally. An increase in this increment in force after exercise provides evidence of a reduced cortical voluntary activation, indicative of supraspinal fatigue (Gandevia et al., 1996, Todd et al., 2003). Further, EMG recordings in response to cortical stimuli (motor evoked potential [MEP]) can be monitored to assess changes in excitability of the brain to muscle pathway. Descending volleys evoked from cortical stimulation depend on the stimulus intensity and excitability of corticospinal cells, whereas responses in the muscle depend on transmission through relevant excitatory and inhibitory interneurons and excitability of the motoneuron pool (Taylor and Gandevia, 2001). Hypoxia affects neuronal function in-vitro (Nieber et al., 1999), however, acute hypoxia appears to have negligible effects on resting MEPs elicited by TMS (Goodall et al., 2010, Rupp et al., 2012, Szubski et al., 2006). A MEP evoked during muscular contraction is followed by an interval of EMG silence, the so-called cortical silent period (CSP). The initial phase of the CSP has been attributed to inhibitory spinal mechanisms (Inghilleri et al., 1993), whereas the later period (>100 ms) represents increased cortical inhibition (Chen et al., 1999, Inghilleri et al., 1993, Taylor and Gandevia, 2001). Szubski et al. (2006) found a shorter CSP in acute hypoxia, suggestive of a reduced corticospinal inhibition during the exercise.
Responsiveness of the corticospinal pathway and the associated development of central fatigue after locomotor exercise during periods of prolonged hypoxia have not been studied. A recent investigation found an increase in corticospinal excitability (increased resting MEP) after a period of prolonged acute hypoxia (Rupp et al., 2012); however, the mechanisms for this response and the associated effects upon the development of central fatigue during locomotor exercise have not been studied. We have recently related the development of supraspinal fatigue during exercise in severe acute hypoxia to a reduction in cerebral O2 availability (Goodall et al., 2012). Acclimatisation to altitude not only brings about improvements in arterial oxygenation, but also improvements in cerebrovascular function (Ainslie and Ogoh, 2009, Lucas et al., 2011). It is unknown how haematologic (e.g., hemodynamic and cerebrovascular) adaptations might serve to impact corticospinal excitability and the development of supraspinal fatigue during locomotor exercise in chronic hypoxia. Accordingly, the aim of the present study was to assess corticospinal excitability and supraspinal fatigue after locomotor exercise in chronic hypoxia. We hypothesised that altered cerebrovascular and corticospinal responses after a period of acclimatisation to high altitude would reduce the severity of supraspinal fatigue compared to that observed in acute hypoxia.
Methods
Ethical Approval
All procedures conformed to the Declaration of Helsinki and were approved by the Universities of Colorado Denver, Oregon and Utah Institutional Review Boards and the US Department of Defense Human Research Protection Office.
Participants
This study was conducted as part of the AltitudeOmics project examining the integrative physiology of human responses to hypoxia (Subudhi et al. under review at PLoSOne). After written informed consent, seven (five male) recreationally active sea level habitants participated in the study (mean ± SD age, 21 ± 1 yr; stature, 1.78 ± 0.10 m; body mass, 69 ± 11 kg; maximum O2 uptake [ ], 46.4 ± 8.2 ml·kg−1·min−1 [participant IDs: 1,2,3,5,6,7,10]). The participants were non-smokers, free from cardiorespiratory disease, born and raised at <1500 m, and had not travelled to elevations >1000 m in the 3 months prior to investigation. Participants arrived at the laboratory in a rested and fully hydrated state, at least 3 h postprandial, and avoided strenuous exercise in the 48 h preceding each trial. They also refrained from caffeine for 12 h before each test, while alcohol and prophylactic altitude medication were prohibited for the entire duration of the investigation. All of the subjects participated in a companion study investigating the acclimatisation-induced effects on peripheral measures of neuromuscular fatigue (Amann et al., 2013); while the data were obtained from the same protocol described below, the primary TMS and cerebral oxygenation related outcome measures in the current study do no overlap with previous analyses.
Experimental design
Participants completed a preliminary trial and three experimental trials. Each trial was conducted at the same time of day, and separated by at least 5 d during a 12 wk period. During the preliminary trial, participants were thoroughly familiarized with the methods used to assess neuromuscular function and performed a maximal incremental exercise test in normoxia for the determination of and peak workload (Wpeak); further maximal incremental tests were performed in AH and CH (Subudhi et al. under review at PLoSOne). During the experimental trials, participants performed constant-load exercise at a workload equal to 50% Wpeak obtained in the preliminary trial: 1) to the limit of tolerance in acute normobaric hypoxia (AH: FIO2 = 0.105; Eugene, Oregon, barometric pressure [BP] = 750 ± 2 mmHg; PIO2 = 73.8 ± 0.2 mmHg); 2) for the same absolute intensity and duration as in trial 1, but in normoxia (N: Eugene, Oregon, BP = 750 ± 2 mmHg; PIO2 = 147.1 ± 0.5 mmHg); and 3) for the same absolute intensity and duration as in trial 1, but after 14 d at 5,260 m above sea level (CH: Mt. Chacaltaya, Bolivia, BP = 409 ± 1 mmHg; PIO2 = 75.7 ± 0.1 mmHg). Participants were flown to La Paz, Bolivia where they spent two nights at low altitude (Coroico, 1,525 m), before being driven to the Chacaltaya Research Station at 5,260 m. Before and within 2.5 min after each exercise trial, twitch responses to supramaximal femoral nerve stimulation and TMS were obtained to assess fatigue. During AH, the post-exercise measurements were made while participants continued to breathe the hypoxic gas. Cerebrovascular, cardiorespiratory and perceptual responses, as well as EMG activity of the vastus lateralis (VL), were assessed throughout each trial.
Force and EMG recordings
Knee-extensor force during voluntary and evoked contractions was measured using a calibrated load cell (Tedea, Basingstoke, UK). The load cell was fixed to a custom-built chair and connected to a non-compliant cuff attached around the participant’s right leg just superior to the right ankle. Participants sat upright in the chair with the hips and knees at 90° of flexion. EMG activity was recorded from the VL and biceps femoris (BF). Surface electrodes were placed 2 cm apart over the muscle bellies and a reference electrode was placed over the patella. The electrodes were used to record the compound muscle action potential (M-wave) elicited by electrical stimulation of the femoral nerve and the MEP elicited by TMS. Signals were amplified (gain 1000; Force: custom-built bridge amplifier; EMG: PowerLab 26T, ADInstruments Inc, Oxfordshire, UK), band-pass filtered (EMG only: 20–2000 Hz), digitised (4 kHz; PowerLab 26T, ADInstruments Inc), acquired and later analysed (LabChart v7.0, ADInstruments Inc).
Neuromuscular function
Force and EMG variables were assessed before and immediately after each exercise trial. Prior to each trial, MVC force was determined from three, 3 s contractions. Femoral nerve stimulation was delivered at rest ~2 s after the MVC to determine the potentiated quadriceps twitch force (Qtw,pot). TMS was delivered during brief (~5 s) maximal and submaximal voluntary contractions for the determination of cortical voluntary activation. Each set of contractions comprised 100, 75, and 50% MVC efforts separated by ~5 s of rest. The contraction sets were repeated three times, with 15 s between each set. Visual feedback of the target force was provided via a computer monitor.
Femoral nerve stimulation
Single electrical stimuli (200 μs) were delivered to the right femoral nerve via surface electrodes (CF3200, Nidd Valley Medical Ltd, North Yorkshire, UK) and a constant-current stimulator (DS7AH, Digitimer Ltd, Welwyn Garden City, Hertfordshire, UK). The cathode was positioned over the nerve high in the femoral triangle; the anode was placed midway between the greater trochanter and the iliac crest. The site of stimulation that produced the largest resting twitch amplitude and M-wave (Mmax) was located. Single stimuli were delivered beginning at 100 mA and increasing by 20 mA until plateaus occurred in twitch amplitude and Mmax. Supramaximal stimulation was ensured by increasing the final intensity by 30% (mean current 253 ± 60 mA).
Transcranial magnetic stimulation
TMS was delivered via a concave double cone coil (110 mm diameter; maximum output 1.4 T) powered by a mono-pulse magnetic stimulator (Magstim 200, The Magstim Company Ltd, Whitland, UK). The coil was held over the vertex to preferentially stimulate the left hemisphere (postero-anterior intracranial current flow), and was placed in an optimal position to elicit a large MEP in the VL and a small MEP in the antagonist (BF). The optimal coil position was marked on the scalp with indelible ink to ensure reproducibility of the stimulation. Resting motor threshold (rMT) was determined at the beginning of each experimental trial. Briefly, TMS was first delivered with the coil placed over the optimal site of stimulation at a sub-threshold intensity of 35% maximum stimulator output. Stimulus intensity was then increased in 5% steps until consistent motor evoked potentials (MEPs) with peak-to-peak amplitudes of more than 50 μV were evoked. Thereafter, stimulus intensity was reduced in 1% steps until an intensity was reached that elicited an MEP of at least 50 μV in 5 out of 10 trials (Groppa et al., 2012). The stimulation intensity that elicited rMT was increased by 30%; thus, the experimental stimulation intensity was 130% of rMT. This stimulation intensity elicited a large MEP in the VL (area between 60 and 100% of Mmax during knee-extensor contractions ≥50% MVC; Figure 1); indicating the TMS stimulus activated a high proportion of knee extensor motor units, while causing only a small MEP in the BF (amplitude <20% of MEP during knee-extensor contractions).
Figure 1.

Mean area of motor evoked potentials (MEP) recorded from the vastus lateralis (VL) in response to stimulation over the motor cortex during varying contraction intensities pre- (○) and post-exercise (●) (mean for all conditions). The TMS responses were compared to the area of the maximal M-wave (Mmax) evoked by peripheral stimulation of the femoral nerve. Data are means ± SE for 7 participants.
Constant-load exercise
Participants sat on an electromagnetically-braked cycle ergometer (Velotron Dynafit Pro, Racermate, Seattle, WA) while baseline cardiorespiratory and cerebrovascular data were collected for 3 min. The participants warmed-up for 5 min at 10% Wpeak (26 ± 8 W) before the workload was increased to 50% normoxic Wpeak (131 ± 39 W). This intensity was chosen to maximise the tolerable duration of exercise in the hypoxic conditions. The participants remained seated throughout exercise and maintained a target pedal cadence equivalent to that chosen during the incremental exercise test (88 ± 3 rpm). Task-failure was reached when cadence dropped below 60% of the target rpm for >5 s. Constant load exercise was performed firstly in AH; the achieved time (10.1 ± 1.4 min) was then replicated in N and CH.
Tissue oxygenation and cerebrovascular responses
Cerebral oxygenation was assessed using a multi-channel NIRS instrument (Oxymon III, Artinis) (Subudhi et al., 2009, Subudhi et al., 2011). Changes in oxygenated, deoxygenated and total cerebral haeme concentrations (μM) were expressed relative to the resting baseline recorded in each experimental condition. Arterial oxygen saturation was estimated using forehead pulse oximetry (SpO2; Model N-595, Nellcor, Pleasonton, CA). Excellent agreement between the pulse oximeter and arterial O2 saturation across the range of values in the present study has been published (Romer et al., 2007). Hemoglobin concentration [Hb] was measured (OSM-3, Radiometer, Copenhagen, Denmark) in resting arterial blood samples. Samples were collected during the primary physiological protocols at sea level (2–4 d prior to the first exercise trial in the present study) and on the 16th day at 5,260 m (2 d following the constant load exercise trial in the present study) (Subudhi et al. under review at PLoSOne). Arterial O2 content (CaO2) was estimated using the equation: ([Hb] × 1.39 × SpO2 / 100). Resting [Hb] in combination with the measured SpO2 during the exercise protocol were used to obtain Cao2 throughout exercise in all conditions. Blood velocity in the left middle cerebral artery (MCAv) was determined using transcranial Doppler (Spencer Technologies, Seattle, WA). The custom-made NIRS headset was modified to hold a 2 MHz probe positioned over the left temporal window. Measurements were optimised at an average penetration depth of 50 ± 3 mm. An index of cerebral O2 delivery was calculated as the product of MCAv and CaO2. It was assumed that changes in MCAV would reflect changes in cerebral blood flow based on evidence that the middle cerebral artery diameter changes minimally in response to hypoxia and hypocapnia (Poulin and Robbins, 1996).
Cardiorespiratory and perceptual responses
Ventilatory and pulmonary gas exchange indices were assessed using an online system (in AH & N Medical Graphics PFX, St. Paul, MN, USA; & in CH Oxigraf O2cap, Mountain View, CA, USA). Heart rate was identified from the peak MCAv envelopes. Ratings of perceived exertion for dyspnea and limb discomfort were obtained using the CR10 scale at baseline and every minute throughout exercise (Borg, 1982). In CH, symptoms of acute mountain sickness were assessed on the day of a trial using the Lake Louise Score (Roach et al., 1993).
Data analysis
Cortical voluntary activation was assessed by measuring the force responses to motor-cortex stimulation during submaximal and maximal contractions. Corticospinal excitability increases during voluntary contraction (Rothwell et al., 1991); thus, we estimated the amplitude of the resting twitch evoked by TMS (ERT; Goodall et al., 2009, Sidhu et al., 2009a). Cortical voluntary activation (%) was subsequently quantified using the equation: (1 − [SIT / ERT] × 100).
The peak-to-peak amplitude and area of evoked MEPs and Mmax were measured offline. To ensure the motor cortex stimulus activated a high proportion of the knee-extensor motor units, the area of vastus lateralis MEP was normalised to that of Mmax elicited during the MVC at the beginning of each trial (Taylor et al., 1999) (Figure 1). The duration of the CSP evoked by TMS during MVC was quantified as the duration from stimulation to the continuous resumption of post-stimulus EMG exceeding ± 2 SD of pre-stimulus EMG (>50 ms prior to stimulus). VL EMG signals during exercise were rectified and smoothed (15 ms), then quantified as the mean integrated area during each cycle revolution and averaged over each minute of exercise. A computer algorithm identified the onset and offset of activity where the rectified EMG signals deviated >2 SD from baseline for >100 ms.
Reliability coefficients
On a separate day, the responses to TMS, femoral nerve stimulation and MVC were repeated twice in all participants. The two assessment procedures were separated by a 2 min walk followed by 5 min of rest. Coefficient of variation (CV) and intraclass correlation coefficient (ICC) were calculated to evaluate test-retest reliability. All correlations were statistically significant and indicated, in combination with the CVs, a high level of reproducibility: cortical voluntary activation, CV = 1.4%, ICC = 0.82; CSP, CV = 7.1%, ICC = 0.93; ERT, CV = 10.2%, ICC = 0.84; MEP/Mmax, CV = 9.6%, ICC = 0.66; Mmax, CV = 11.4%, ICC = 0.98; 100% MVC MEP, CV = 14.1%, ICC = 0.96; 75% MVC MEP, CV = 10.2%, ICC = 0.98; 50% MVC MEP, CV = 7.2%, ICC = 0.99; MVC, CV = 4.7%, ICC = 0.94; Qtw,pot, CV = 4.8%, ICC = 0.97.
Statistical analysis
Data are presented as means ± SD in the text and means ± SE in the figures. A 3 × 2 repeated measures ANOVA on condition (3 [AH, N, CH]) and time (2 [pre, post]) was used to test for within-group differences. When ANOVA revealed significant interactions, post-hoc comparisons were made using the least significant differences test. Statistical significance was set at P < 0.05. All analyses were conducted using SPSS (v19, IBM Corporation, New York, USA).
Results
Exercise responses
The exercise workload was 131 ± 39 W (50% N Wpeak), which equated to 83% Wpeak in AH and 74% Wpeak in CH. Cerebral oxygenation data are shown in Figure 2. During N, oxyhaemoglobin was unchanged from baseline to warm up and total haemoglobin was increased during the final minute of exercise (P = 0.658 and 0.007, respectively). During AH, deoxygenated haemoglobin increased from baseline to warm up (P = 0.006); this response was exaggerated towards end exercise (P < 0.001). During CH, deoxygenated haemoglobin increased at end exercise (P = 0.015) in line with increased total haemoglobin (P = 0.043). Overall, these results demonstrate that the degree of cerebral deoxygenation ( deoxygenated haemoglobin) in AH was greater than that observed in N and CH (P < 0.05).
Figure 2.

Cerebral oxygenation at resting baseline, during the final 30 s of a 3 min warm up (28 W) and during the final 30 s of constant-load exercise (131 W) in normoxia (N; panel a), acute hypoxia (AH; panel b) and chronic hypoxia (CH; panel c). Data are means ± SE for 7 participants. † P < 0.05 vs. respective baseline; ‡ P < 0.05 vs. respective warm up; * P < 0.05 vs. AH; # P < 0.05 vs. CH. Resting baseline in AH denotes the value after 10 min wash in of the hypoxic gas. O2Hb, oxygenated haemoglobin; HHb, deoxygenated haemoglobin and THb, total haemoglobin.
SpO2 and MCAv data are shown in Figure 3. Acute exposure to hypoxia decreased SpO2 at rest (Δ7 ± 4%; P = 0.009) and during the final minute of exercise (Δ34 ± 10%; P < 0.001). Resting SpO2 in CH was 85 ± 2% (P < 0.001 vs. N; P = 0.330 vs. AH), and in the final minute of exercise had fallen to 78 ± 5% (P < 0.001 vs. N; P = 0.002 vs. AH). No changes in SpO2 were apparent in N (P > 0.702). Resting MCAv did not differ between conditions at baseline (pooled average, 54 ± 9 cm·s−1; P = 0.544). MCAv did not increase from rest at any time point in N (P > 0.108). MCAv increased from rest to the final minute of exercise in AH (40 ± 15%; P < 0.001) and CH (25 ± 14%; P = 0.016), but did not differ between conditions (Figure 3).
Figure 3.

Arterial oxygen saturation (SpO2) (a), cerebral blood flow velocity (MCAv) (b) and middle cerebral artery O2 delivery index (MCAv × CaO2) during constant-load exercise (131 W) in normoxia (N), acute hypoxia (AH), and chronic hypoxia (CH). Values are plotted for the duration of the shortest trial (8 min) and extrapolated to the group mean exercise time (10.1 min). Data are means ± SE for 7 participants. † P < 0.05 vs. rest; * P < 0.05 vs. N; # P < 0.05 vs. CH.
Hemoglobin concentration was 1.42 ± 0.03 g·L−1 in N and 1.63 ± 0.31 g·L−1 in CH (P = 0.005). Resting PaO2 was reduced in AH compared to N (39.1 ± 4.8 vs. 103.3 ± 8.7 mmHg, P < 0.001), was increased in CH relative to AH (58.8 ± 3.2 mmHg, P < 0.001), but was still lower than N (P < 0.001). CaO2 was lower at rest in AH vs. N (19.8 ± 1.9 vs. 21.5 ± 2.9 ml·dl−1; P = 0.013); during the final minute of exercise CaO2 in AH was 36 ± 8% lower than N (P < 0.001) and 22 ± 9% lower than in CH (P = 0.001). CaO2 was lower at rest in CH vs. N (19.4 ± 2.6 vs. 21.5 ± 2.9 ml·dl−1; P < 0.001) and during the final minute of exercise (17.6 ± 2.9 vs. 21.2 ± 2.9 ml·dl−1; P = 0.725). Consequently, cerebral O2 delivery index (MCAv × CaO2) was 19 ± 14% lower during the final minute of exercise in AH compared to N (P = 0.013) and 20 ± 12% lower compared to CH (P = 0.040). No differences were evident between N and CH at rest (P = 0.783) or during the final minute of exercise (P = 0.797) (Figure 3).
Cardiorespiratory data are shown in Table 1. Respiratory frequency and minute ventilation ( ) rose substantially over time in all conditions. / during the final minute of exercise in AH and CH was approximately twofold greater than in N (P < 0.001); / during the final minute of exercise was 28% higher in CH compared to AH (P < 0.001). During the final minute of exercise, whole body was not different across the three conditions (P = 0.411). Dyspnea and limb discomfort at end-exercise were higher in AH compared to N (P < 0.001 and P = 0.048, respectively), but were not different compared to CH (P = 0.714 and 0.549, respectively). Integrated EMG activity at end exercise was higher in AH compared to N (32%; P = 0.029), but not CH (16%; P = 0.303). There were no reported symptoms of acute mountain sickness during CH.
Table 1.
Cardiorespiratory and perceptual responses at rest and during the final minute of constant-load cycling (131 W) in normoxia, acute hypoxia and chronic hypoxia.
| Normoxia | Acute Hypoxia | Chronic Hypoxia | ||
|---|---|---|---|---|
| HR (beats min−1) | Rest Final Min |
81 ± 7† 150 ± 16* |
90 ± 9 173 ± 14 |
104 ± 16 167 ± 16 |
| (l min−1) | Rest Final Min |
14.3 ± 2.4 60.0 ± 9.6*† |
20.0 ± 2.6 108.8 ± 24.7† |
24.5 ± 5.4 128.5 ± 30.0 |
| fR (breaths min−1) | Rest Final Min |
15.6 ± 3.6 31.4 ± 4.9*† |
17.5 ± 4.5 51.6 ± 8.7† |
13.0 ± 3.4 54.8.6 ± 9.9 |
| VT (l) | Rest Final Min |
1.07 ± 0.37 2.00 ± 0.45 |
1.30 ± 0.34 2.07 ± 0.43 |
1.47 ± 0.63 2.41 ± 0.58 |
| (l min−1) | Rest Final Min |
0.49 ± 0.10 2.45 ± 0.51 |
0.45 ± 0.08 2.34 ± 0.58 |
0.45 ± 0.12 2.07 ± 0.50 |
| (l min−1) | Rest Final Min |
0.44 ± 0.09 2.32 ± 0.51 |
0.55 ± 0.09 2.69 ± 0.62† |
0.39 ± 0.08 1.94 ± 0.50 |
| / | Rest Final Min |
30.7 ± 2.7*† 25.2 ± 2.4*† |
47.4 ± 6.5† 51.2 ± 15.0† |
55.9 ± 14.9 62.9 ± 9.2 |
| / | Rest Final Min |
33.9 ± 2.7† 26.2 ± 2.6*† |
37.9 ± 6.5† 41.7 ± 6.9† |
63.4 ± 6.8 67.1 ± 9.1 |
| RPE, dyspnoea | Rest Final Min |
7.0 ± 0.0 11.4 ± 2.4*† |
7.3 ± 0.5 19.4 ± 0.8 |
7.1 ± 0.4 19.1 ± 10.7 |
| RPE, limb | Rest Final Min |
7.1 ± 0.4 12.3 ± 3.3* |
7.1 ± 0.4 19.9 ± 0.4 |
7.0 ± 0.0 17.6 ± 11.7 |
Values are means ± SD for 7 participants. Resting values were measured during the 5th minute of breathing the test gas mixture. HR, heart rate; , minute ventilation; fR, respiratory frequency; VT, tidal volume; , oxygen uptake; , carbon dioxide output; RPE, ratings of perceived exertion.
P < 0.05 vs. acute hypoxia;
P < 0.05 vs. chronic hypoxia.
Pre- and post-exercise responses
Peripheral and central measures of excitability are shown in Table 2.
Table 2.
Peripheral and central measures of excitability assessed before and after constant-load cycling (131 W) in normoxia, acute hypoxia and chronic hypoxia.
| Normoxia | Acute Hypoxia | Chronic Hypoxia | ||
|---|---|---|---|---|
| Rest | ||||
| Mmax amplitude (mV) | Pre Post |
6.9 ± 2.0† 6.7 ± 1.7 |
8.6 ± 3.7† 9.0 ± 4.1 |
14.9 ± 8.3 14.0 ± 8.2 |
| MEP amplitude (mV) | Pre Post |
0.19 ± 0.12† 0.11 ± 0.06 |
0.19 ± 0.11† 0.11 ± 0.10 |
0.41 ± 0.28 0.21 ± 0.18# |
| MEP/Mmax (%) | Pre Post |
2.6 ± 1.3 1.8 ± 1.2 |
2.7 ± 1.9 1.5 ± 1.3 |
4.1 ± 4.2 2.6 ± 3.4 |
| Within contraction | ||||
| Mmax amplitude 100% (mV) | Pre Post |
8.9 ± 1.7 9.0 ± 1.9 |
9.9 ± 3.2 10.0 ± 3.3 |
13.0 ± 6.1 11.9 ± 5.4 |
| MEP amplitude 100% (mV) | Pre Post |
3.8 ± 1.5 4.0 ± 2.7 |
3.1 ± 1.0† 3.2 ± 1.0 |
7.1 ± 4.7 6.5 ± 4.4 |
| MEP amplitude 75% (mV) | Pre Post |
3.9 ± 1.5† 4.3 ± 2.6 |
2.9 ± 1.4† 3.3 ± 1.2† |
7.6 ± 4.9 6.9 ± 3.9 |
| MEP amplitude 50% (mV) | Pre Post |
2.54 ± 0.87† 2.99 ± 2.01† |
2.16 ± 0.52† 2.56 ± 0.95† |
6.5 ± 4.8 6.4 ± 4.5 |
| MEP/Mmax (%) 100% MVC | Pre Post |
35 ± 17 39 ± 20 |
33 ± 14 37 ± 15 |
52 ± 17 52 ± 19 |
| MEP/Mmax (%) 75% MVC | Pre Post |
40 ± 15 42 ± 17 |
34 ± 19† 38 ± 18† |
58 ± 18 57 ± 13 |
| MEP/Mmax (%) 50% MVC | Pre Post |
28 ± 14† 30 ± 15† |
26 ± 10† 31 ± 17† |
50 ± 21 54 ± 23 |
| CSP (ms) | Pre Post |
198 ± 58 188 ± 64 |
174 ± 46 171 ± 35 |
186 ± 36 196 ± 51 |
Values are means ± SD for 7 participants. Mmax, maximal motor response; MEP, motor evoked potential; CSP, cortical silent period.
P < 0.05 vs. chronic hypoxia;
P < 0.05 vs. Pre.
Neuromuscular responses
MVC did not differ between conditions at baseline (AH, 392 ± 77 N; N, 386 ± 90 N; CH, 376 ± 39 N; P = 0.942). MVC was reduced post-exercise in AH (339 ± 77 N, P = 0.011) and CH (346 ± 93 N, P = 0.032), but not N (387 ± 87 N, P = 0.684). The reductions in MVC were not different between conditions (P ≥ 0.119). Qtw,pot did not differ between conditions at baseline (AH, 107 ± 13 N; N, 105 ± 12 N; CH, 110 ± 16 N; P = 0.752). Qtw,pot was reduced post-exercise in AH (84 ± 14 N, P = 0.005) and CH (90 ± 18 N, P = 0.011), but not N (102 ± 12 N, P = 0.692). On average, resting Mmax in CH displayed a twofold increase compared to AH and N (P < 0.019); however, the change in Mmax during MVC was not statistically significant (P > 0.058). Neither measure of Mmax changed pre- to post-exercise in any condition (P ≥ 0.610). Pooled across conditions, pre-exercise ERT (mean r2 = 0.95) was 70% of the pre-exercise Qtw,pot and did not differ between conditions (mean ERT 75 ± 25 N; P = 0.811). Post-exercise ERT was reduced in AH (52 ± 27 N, P = 0.049), but was unchanged in N and CH (P ≥ 0.107).
Corticomotor responses
rMT in AH, N and CH was 54 ± 5, 53 ± 3 and 51 ± 6% maximum stimulator output (P = 0.276), respectively. During CH, resting MEP amplitude was twofold greater compared to AH (P = 0.014) and N (P = 0.014). Exercise elicited a reduction in resting MEP amplitude in CH (P = 0.022), but not AH (P = 0.346) or N (P = 0.369). MEPs evoked during brief knee extensor contractions at 100, 75 and 50% MVC pre-exercise were higher in CH compared to AH (P < 0.020) and N (P < 0.030) (see also Figure 4). MEPs evoked during the brief knee-extensor contractions (50–100% MVC) post-exercise were not significantly different from pre-exercise values in any condition. MEP amplitude, however, was higher post-exercise during CH compared to AH (50% MVC, P = 0.018; 75% MVC, P = 0.030) and N (50% MVC, P = 0.034). The MEP/Mmax ratio increased for within contraction responses during CH (vs. AH 50 and 75% MVC; P ≤ 0.014 and N 50% MVC; P = 0.019) (Table 2). The CSP did not differ between conditions pre-exercise (pooled average, 186 ± 47 ms; P = 0.880) or post-exercise (pooled average, 185 ± 50 ms; P = 0.760). Baseline cortical voluntary activation did not differ between conditions (AH, 93 ± 5%; N, 97 ± 3%; CH, 93 ± 6%; P = 0.310) (Figure 5). Cortical voluntary activation was reduced post-exercise in AH (Δ11%, P = 0.014), but not in N (Δ4%, P = 0.298) or CH (Δ6%, P = 0.174); the decrease in AH was greater compared to N (P = 0.022) (Figure 5).
Figure 4.

Representative MEPs evoked during knee extensor contractions at 50% MVC before exercise in each condition. Traces are shown from a representative participant in each condition; 8 stimuli were delivered from which an average value was obtained. Note the increase in MEP amplitude (corticospinal excitability) after acclimatisation.
Figure 5.
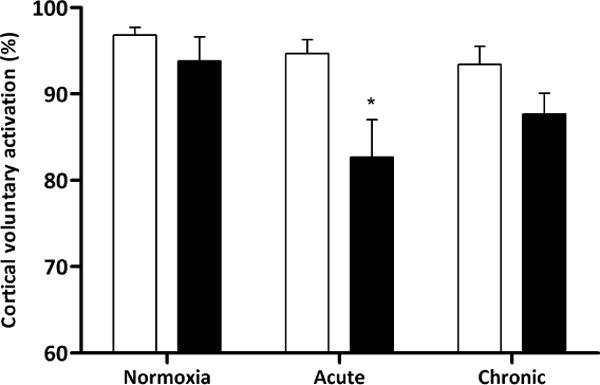
Cortical voluntary activation measured before (open bars) and immediately after (<2.5 min; closed bars) constant-load exercise (131 W) in normoxia (N), acute hypoxia (AH), and chronic hypoxia (CH). * P < 0.05 pre- vs. post-exercise.
Discussion
The aim of the present study was to assess corticospinal excitability and supraspinal fatigue after locomotor exercise in chronic hypoxia. The main finding was that exercise-induced supraspinal fatigue, as quantified via changes in cortical voluntary activation, was attenuated after two weeks of acclimatisation to high altitude whereas it was exacerbated in AH vs. N. Importantly, the diminished level of central fatigue in CH occurred in parallel with improvements in cerebral haemodynamics and arterial oxygenation (increased CaO2 and SpO2) brought about by the two weeks at altitude. Moreover, the attenuated development of central fatigue occurred in line with a substantial increase in corticospinal excitability. This latter finding suggests that a period of acclimatisation modifies the integrity of the corticospinal tract. We confirm our hypothesis that acclimatisation to altitude reduces the level of exercise-induced central fatigue and that this is attributable, at least in part, to an increased overall excitability of the brain to muscle pathway.
Supraspinal Fatigue
A key aim of the present study was to determine the effect of acclimatisation on the development of central fatigue assessed after exercise. We hypothesised that improvements in cerebral oxygenation known to occur after a prolonged stay at altitude would bring about positive modifications on the development of central fatigue. We show that the development of supraspinal fatigue during locomotor exercise is recovered after 2 weeks at high altitude and similar to that observed in normoxia. Thus, the adaptive processes that take place during acclimatisation to high altitude seemingly protect healthy humans against the development of supraspinal fatigue.
Corticomotor responses
The present study found no change in corticospinal excitability (Δ resting MEP) in AH, a finding which is in line with literature utilising varying severities of hypoxia (FIO2 = 0.14 − 0.10; resting SpO2 = 93 − 74%) for as little as 10 min to 1 h (Goodall et al., 2010, Rupp et al., 2012, Millet et al., 2012). However, Szubski et al. (2006) reported increased corticospinal excitability, expressed as a reduced rMT (not ΔMEP), after ~30 min of breathing hypoxic air (FIO2 = 0.12; resting SpO2 = 75%). Moreover, the present study found a twofold increase in corticospinal excitability after 14 d acclimatisation to severe altitude (5,260 m, equivalent to FIO2 0.105; resting SpO2 = 91 ± 2%) with accompanying increases in the MEP/Mmax ratio, suggesting that the increases in MEP size were due to adaptive mechanisms within spinal and/or supraspinal sites. Similarly, Rupp et al. (2012) found a 26% increase in corticospinal excitability (ΔMEP amplitude) after 3 h of exposure to normobaric hypoxia (FIO2 = 0.12; resting SpO2 = 86%), demonstrating a time-dependent, hypoxia-induced modification in the brain-to-muscle pathway. Thus, a prolonged stay at altitude modifies the integrity of the corticospinal pathway which may contribute to reduce the level of central fatigue; however, a duration-dependent adaptation cannot yet be established with certainty.
TMS over the motor cortex preferentially activates corticospinal neurons trans-synaptically through excitatory interneurons and corticocortical axons (Di Lazzaro et al., 1998). The response to TMS critically depends on membrane excitability of motor cortical neurons and ion-channel function (Boroojerdi et al., 2001, Rothwell et al., 1991). In vitro investigations using isolated cerebral neurons from rats demonstrate that ion-channel function is affected by O2 availability and that neuronal hyper-excitability is the consequence of chronic hypoxia (Donnelly et al., 1992). A heightened neural response is necessary to maintain membrane integrity and ionic homeostasis that occur from a period of insufficient metabolic activity (Nieber et al., 1999). Thus, the twofold increase in MEP observed in the present study might be due to facilitated cortical neurons acting to restore the loss of neuronal activity associated with a prolonged exposure to altitude. Additionally, an increased level of muscle sympathetic nerve activity (peroneal microneurography) has been reported during a prolonged stay at the same altitude as in the present study (Hansen and Sander, 2003). That study showed a significant increase in muscle sympathetic nerve activity just 3 days after exposure to high altitude, suggesting that the prolonged stay induced a striking and long-lasting sympathetic over-activity. More recently, Buharin et al. (2013) found that a transient increase in sympathetic nerve activity (induced via lower body negative pressure) enhances corticospinal excitability as identified using TMS. The mechanism responsible for the increase in corticospinal excitability was postulated to be due to an elevated concentration of noradrenaline, a monoamine that is known to increase exponentially during sustained periods at altitudes exceeding 4,000 m (Cunningham et al., 1965, Mazzeo et al., 1994). Thus, the increased corticospinal excitability observed following 2 weeks of acclimatisation in the present study might be attributable, at least in part, to a heightened sympathetic nerve activity and associated increases in corticospinal excitability as well as hyper-excitable cerebral neurons. The increased corticospinal excitability in this investigation occurred in line with no symptoms of mountain sickness, a finding that opposes that of Miscio et al. (2009). Miscio et al. (2009) found that exposure to high altitude changes cortical excitability by affecting both inhibitory and excitatory circuits and that this is reflected in acute mountain sickness symptoms. This conclusion was based on a group of participants who resided at 4,554 m for only 3–5 days, a time frame in which acute mountain sickness is said to be most prominent (Hackett and Roach, 2001) and much shorter than the present study.
Despite substantial differences in end-exercise peripheral fatigue, CSP duration immediately after exercise (i.e., pre-to post-exercise change) was similar in all conditions. This suggests that locomotor exercise in N, AH and CH does not influence intracortical inhibition. These findings are in agreement with investigations using locomotor exercise in N and AH (Goodall et al., 2012, Sidhu et al., 2009b). However, Oliviero et al. (2002) reported decreased intracortical inhibition and CSP duration in chronic hypoxemic patients with COPD. These changes, mediated by cerebral GABA receptors, were reversed after 3–4 months of O2 therapy, demonstrating that the changes were O2 sensitive. However, factors other than chronic hypoxaemia might influence intracortical inhibition in patients with COPD making it difficult to quantify the influence that chronic hypoxaemia has on cortical inhibition.
On balance, we judge the increased corticospinal excitability in CH noted in the present study to be the result of adaptations in ion-channel function and elevations in circulating catecholamines serving to facilitate neurotransmission rather than mechanisms related to intracortical inhibition (Buharin et al., 2013, Nieber et al., 1999, Palange, 1998).
Hematological and cerebrovascular responses
Upon initial exposure to high altitude, acute hypoxia dilates cerebral arterioles thereby overriding the vasoconstrictive effect of hyperventilation-associated hypocapnia (Iwasaki et al., 2011). During a prolonged stay at altitude, hypocapnia further develops and arterial hypoxaemia is ameliorated, as reflected by increases in arterial [Hb], PO2 and O2 saturation (Figure 3). Furthermore, the increase in PaO2 and further decrease in PaCO2 with acclimatisation causes relative vasoconstriction reducing CBF down to SL values (Subudhi et al. 2013). We estimated an index of cerebral O2 delivery using the product of MCAv and CaO2. Our data demonstrate a reduced cerebral O2 delivery index during exercise in AH compared to N; however, an improved cerebral O2 delivery index was evident after two weeks of acclimatisation (Figure 3). The data in AH support a relationship between cerebral O2 delivery and supraspinal fatigue (Goodall et al., 2012). The calculation of CaO2 during exercise from resting [Hb] should be interpreted with caution as a hemoconcentration could have impacted this measure. At sea level, the hemoconcentration accompanying maximal exercise for approximately 10 min is counterbalanced by the concomitant exercise-induced arterial hypoxemia with the net effect of similar CaO2 at rest and during exercise (Amman et al., 2006a). At altitude, despite significant hemoconcentration, CaO2 actually falls from rest to submaximal/maximal exercise by 10–25% (Calbet et al., 2003). This would suggest that exercise CaO2 calculations, based on a resting CaO2 measure, might actually overestimate CaO2 measured during exercise at altitude. Furthermore, we assumed that MCA diameter would remain constant in hypoxia (Poulin and Robbins, 1996, Serrador et al., 2000). While there is evidence of MCA dilatation at rest in hypoxia (Willie et al., 2012, Wilson et al., 2011), there is currently no evidence of MCA dilatation during intense exercise accompanied with substantial exercise-induced hyperventilation and associated hypocapnia. We acknowledge, however, that our measurements of blood velocity (rather than flow) must be interpreted with caution.
We found acclimatisation-induced increases in O2 saturation and content (Figure 3). Furthermore, arterial O2 tension increased from AH to CH (~39 mmHg to ~59 mmHg). Subudhi et al. (2013) has shown resting cerebral O2 delivery to be maintained at levels observed in N during AH and CH, although it is presumed that the delivery of O2 to the mitochondria within the parenchyma will be reduced because the driving gradient for diffusion from capillary to tissue is the PO2 difference between capillary and tissue (Xu and Lamanna, 2006). The tissue PO2 would be close to zero; thus, the driving force is essentially the PaO2. In the present study the PaO2 increased in line with acclimatisation, thereby improving the gradient for diffusion and perhaps restoring brain tissue O2 tension to pre-hypoxic levels (Dunn et al., 2000). Thus, we postulate that the lack of central fatigue in chronic hypoxia may be related to increases in brain tissue O2 tension. However, the link between increases in PaO2 and CaO2 and the reduction in central fatigue that occurs after a period of acclimatisation warrants further investigation.
Technical Considerations
Exercising in a hypobaric environment was not feasible for the trials in AH. Thus, the two modes of hypoxia (normobaric [AH] vs. hypobaric [CH]) differed. The literature concerning the responses in normobaric and hypobaric hypoxia is equivocal and readers are directed elsewhere to a point:counterpoint debate (Girard et al., 2012). Briefly, it was proposed that evidence is growing, suggestive that hypobaric hypoxia affects responses (ventilation, fluid balance, acute mountain sickness and performance) to a greater extent than normobaric hypoxia (Girard et al., 2012). However, this argument was opposed by the fact that in terms of O2 sensing, hypobaric hypoxia does not induce different responses compared to normobaric hypoxia (Mounier and Brugniaux, 2012). Moreover, it is unknown how any such differences which might exist between hypobaric and normobaric hypoxia may affect indices of exercise-induced fatigue. We set the FIO2 (0.105) at sea level to obtain the same PIO2 (~74 mmHg) that was expected at the subsequent altitude in Bolivia (5,260 m).
In line with other investigations that have measured exercise-induced fatigue of the knee extensors (Goodall et al., 2012, Goodall et al., 2010, Sidhu et al., 2009b, Rossman et al., 2013), measurements were made within 2.5 min after exercise termination. Corticospinal excitability associated with maximal single muscle contractions recovers within 1 min post-exercise (Taylor et al., 1999). Thus, the present experimental design, utilising whole body exercise, might not have captured all elements of central fatigue. However, the methods and time to assess fatigue after exercise in all three conditions were identical and even though our measurements were made more than 1 min post-exercise, significant differences were observed, testifying to the strength of our data.
Conclusion
The novel finding was that supraspinal fatigue, present after exercise in acute hypoxia, was attenuated after a period of acclimatisation to high altitude. Importantly, the reduced development of central fatigue in chronic hypoxia occurred in parallel with an increase in the excitability of the brain to muscle pathway consequent to an increased cerebral O2 delivery. The attenuated rate of development of central fatigue in chronic hypoxia might explain, at least in part, the improvements in locomotor exercise performance that are commonly observed after acclimatisation to high altitude.
Acknowledgments
This paper is part of a series of papers, titled “AltitudeOmics”, which together represent a group of studies that explored the basic mechanisms controlling human acclimatisation to hypoxia and its subsequent retention. Many people and organizations invested enormous time and resources to make this project a success. Foremost, the study was made possible by the tireless support, generosity and tenacity of our research subjects. AltitudeOmics principal investigators were Colleen G. Julian, Andrew T. Lovering, Andrew W. Subudhi and Robert C. Roach. A complete list of other investigators on this multinational, collaborative effort involved in development, subject management and data collection, supporting industry partners, and people and organizations in Bolivia that made AltitudeOmics possible is available in the first paper in this series (Subudhi et al., in review at PLoSOne). The authors are extremely grateful to Mr Jui-lin Fan and Nicolas Bourdillon (University of Geneva, Switzerland), Mr Jonathan Elliot, Dr Steve Laurie, Mr Jim Davis, Ms Julia Kern, Ms Kara Beasley, and Mr Henry Norris (University of Oregon, USA), and Mr Oghenero Evero (University of Colorado, USA) for valuable technical assistance during data collection. Personal thanks go to Professor Alan (Zig) St. Clair Gibson at Northumbria University for making the trip possible for S Goodall.
Grants: AltitudeOmics was funded, in part, by grants from the Department of Defense (W81XWH-11-2-0040 TATRC to RR, and W81XWH-10-2-0114 to ATL); the Cardiopulmonary & Respiratory Physiology Laboratory, University of Oregon; the Altitude Research Center and the Charles S. Houston Endowed Professorship, Department of Emergency Medicine, School of Medicine, University of Colorado Denver; the Faculty of Health & Life Sciences, Northumbria University; the School of Sport and Service Management, University of Brighton; and a National Heart, Lung, and Blood Institute R00 grant (HL-103786 to MA).
Glossary
- CaO2
arterial O2 content
- CSP
cortical silent period
- ERT
estimated resting twitch
- FIO2
fraction of inspired O2
- fR
respiratory frequency
- [Hb]
haemoglobin concentration
- MCAV
middle cerebral artery blood velocity
- MEP
motor evoked potential
- Mmax
maximum M-wave
- MVC
maximum voluntary contraction
- PaO2
partial pressure of arterial O2
- PIO2
partial pressure of inspired O2
- Qtw,pot
potentiated quadriceps twitch force
- rMT
resting motor threshold
- SIT
superimposed twitch
- SpO2
arterial O2 saturation
- TMS
transcranial magnetic stimulation
carbon dioxide output
minute ventilation
oxygen uptake
- VT
tidal volume
Footnotes
Author Contributions
SG, RT, and MA contributed to conception and design of the experiments, data collection, data analysis, data interpretation, manuscript drafting and editorial process. ER contributed to conception and design of the experiments, data interpretation and manuscript revision. AL contributed to data collection. LR contributed to conception and design of the experiments, data interpretation, manuscript drafting and revision. AL, AS and RR conceived, designed and executed the AltitudeOmics study of which the present study was a part, and contributed to manuscript revision. AS also contributed to data collection and data interpretation. All authors approved the final version of the manuscript.
References
- Ainslie PN, Ogoh S. Regulation of cerebral blood flow during chronic hypoxia: a matter of balance. Exp Physiol. 2009;95:251–262. doi: 10.1113/expphysiol.2008.045575. [DOI] [PubMed] [Google Scholar]
- Amann M, Calbet JA. Convective oxygen transport and fatigue. J Appl Physiol. 2008;104:861–70. doi: 10.1152/japplphysiol.01008.2007. [DOI] [PubMed] [Google Scholar]
- Amann M, Eldridge MW, Lovering AT, Stickland MK, Pegelow DF, Dempsey JA. Arterial oxygenation influences central motor output and exercise performance via effects on peripheral locomotor muscle fatigue in humans. J Physiol. 2006a;575:937–952. doi: 10.1113/jphysiol.2006.113936. [DOI] [PMC free article] [PubMed] [Google Scholar]
- Amann M, Goodall S, Twomey R, Subudhi AW, Lovering AT, Roach RC. AltitudeOmics: on the consequences of high-altitude acclimatization for the development of fatigue during locomotor exercise in humans. J Appl Physiol. 2013;115:634–42. doi: 10.1152/japplphysiol.00606.2013. [DOI] [PMC free article] [PubMed] [Google Scholar]
- Amann M, Romer LM, Pegelow DF, Jacques AJ, Hess CJ, Dempsey JA. Effects of arterial oxygen content on peripheral locomotor muscle fatigue. J Appl Physiol. 2006b;101:119–127. doi: 10.1152/japplphysiol.01596.2005. [DOI] [PubMed] [Google Scholar]
- Amann M, Romer LM, Subudhi AW, Pegelow DF, Dempsey JA. Severity of arterial hypoxaemia affects the relative contributions of peripheral muscle fatigue to exercise performance in healthy humans. J Physiol. 2007;581:389–403. doi: 10.1113/jphysiol.2007.129700. [DOI] [PMC free article] [PubMed] [Google Scholar]
- Borg GA. Psychophysical bases of perceived exertion. Med Sci Sports Exerc. 1982;14:377–81. [PubMed] [Google Scholar]
- Boroojerdi B, Battaglia F, Muellbacher W, Cohen LG. Mechanisms influencing stimulus-response properties of the human corticospinal system. Clin Neurophysiol. 2001;112:931–7. doi: 10.1016/s1388-2457(01)00523-5. [DOI] [PubMed] [Google Scholar]
- Buharin VE, Butler AJ, Rajendra JK, Shinohara M. Enhanced corticospinal excitability with physiologically heightened sympathetic nerve activity. J Appl Physiol. 2013;114:429–35. doi: 10.1152/japplphysiol.01586.2011. [DOI] [PubMed] [Google Scholar]
- Calbet JA, Boushel R, Radegran G, Sondergaard H, Wagner PD, Saltin B. Why is VO2 max after altitude acclimatization still reduced despite normalization of arterial O2 content? Am J Phys: Reg Integr Comp Phys. 2003;284:R304–316. doi: 10.1152/ajpregu.00156.2002. [DOI] [PubMed] [Google Scholar]
- Chen R, Lozano AM, Ashby P. Mechanism of the silent period following transcranial magnetic stimulation. Evidence from epidural recordings. Exp Brain Res. 1999;128:539–42. doi: 10.1007/s002210050878. [DOI] [PubMed] [Google Scholar]
- Cunningham WL, Becker EJ, Kreuzer F. Catecholamines in plasma and urine at high altitude. J Appl Physiol. 1965;20:607–10. doi: 10.1152/jappl.1965.20.4.607. [DOI] [PubMed] [Google Scholar]
- Di Lazzaro V, Restuccia D, Oliviero A, Profice P, Ferrara L, Insola A, Mazzone P, Tonali P, Rothwell JC. Effects of voluntary contraction on descending volleys evoked by transcranial stimulation in conscious humans. J Physiol. 1998;508:625–33. doi: 10.1111/j.1469-7793.1998.625bq.x. [DOI] [PMC free article] [PubMed] [Google Scholar]
- Donnelly DF, Jiang C, Haddad GG. Comparative responses of brain stem and hippocampal neurons to O2 deprivation: in vitro intracellular studies. Am J Physiol. 1992;262:L549–54. doi: 10.1152/ajplung.1992.262.5.L549. [DOI] [PubMed] [Google Scholar]
- Dunn JF, Grinberg O, Roche M, Nwaigwe CI, Hou HG, Swartz HM. Noninvasive assessment of cerebral oxygenation during acclimation to hypobaric hypoxia. J Cereb Blood Flow Metab. 2000;20:1632–5. doi: 10.1097/00004647-200012000-00002. [DOI] [PubMed] [Google Scholar]
- Gandevia SC, Allen GM, Butler JE, Taylor JL. Supraspinal factors in human muscle fatigue: evidence for suboptimal output from the motor cortex. J Physiol. 1996;490:529–536. doi: 10.1113/jphysiol.1996.sp021164. [DOI] [PMC free article] [PubMed] [Google Scholar]
- Girard O, Koehle MS, MacInnis MJ, Guenette JA, Verges S, Rupp T, Jubeau M, Perrey S, Millet GY, Chapman RF. Comments on Point: Counterpoint: Hypobaric hypoxia induces/does not induce different responses from normobaric hypoxia. J Appl Physiol. 2012;112:1788–1794. doi: 10.1152/japplphysiol.00356.2012. [DOI] [PMC free article] [PubMed] [Google Scholar]
- Goodall S, Gonzalez-Alonso J, Ali L, Ross EZ, Romer LM. Supraspinal fatigue after normoxic and hypoxic exercise in humans. J Physiol. 2012;590:2767–82. doi: 10.1113/jphysiol.2012.228890. [DOI] [PMC free article] [PubMed] [Google Scholar]
- Goodall S, Romer LM, Ross EZ. Voluntary activation of human knee extensors measured using transcranial magnetic stimulation. Exp Physiol. 2009;94:995–1004. doi: 10.1113/expphysiol.2009.047902. [DOI] [PubMed] [Google Scholar]
- Goodall S, Ross EZ, Romer LM. Effect of graded hypoxia on supraspinal contributions to fatigue with unilateral knee-extensor contractions. J Appl Physiol. 2010;109:1842–1851. doi: 10.1152/japplphysiol.00458.2010. [DOI] [PubMed] [Google Scholar]
- Groppa S, Oliviero A, Eisen A, Quartarone A, Cohen LG, Mall V, Kaelin-Lang A, Mima T, Rossi S, Thickbroom GW, Rossini PM, Ziemann U, Valls-Sole J, Siebner HR. A practical guide to diagnostic transcranial magnetic stimulation: report of an IFCN committee. Clin Neurophysiol. 2012;123:858–82. doi: 10.1016/j.clinph.2012.01.010. [DOI] [PMC free article] [PubMed] [Google Scholar]
- Hackett PH, Roach RC. High-altitude illness. N Engl J Med. 2001;345:107–14. doi: 10.1056/NEJM200107123450206. [DOI] [PubMed] [Google Scholar]
- Hansen J, Sander M. Sympathetic neural overactivity in healthy humans after prolonged exposure to hypobaric hypoxia. J Physiol. 2003;546:921–9. doi: 10.1113/jphysiol.2002.031765. [DOI] [PMC free article] [PubMed] [Google Scholar]
- Inghilleri M, Berardelli A, Cruccu G, Manfredi M. Silent period evoked by transcranial stimulation of the human cortex and cervicomedullary junction. J Physiol. 1993;466:521–534. [PMC free article] [PubMed] [Google Scholar]
- Iwasaki K, Zhang R, Zuckerman JH, Ogawa Y, Hansen LH, Levine BD. Impaired dynamic cerebral autoregulation at extreme high altitude even after acclimatization. J Cereb Blood Flow Metab. 2011;31:283–92. doi: 10.1038/jcbfm.2010.88. [DOI] [PMC free article] [PubMed] [Google Scholar]
- Lucas SJ, Burgess KR, Thomas KN, Donnelly J, Peebles KC, Lucas RA, Fan JL, Cotter JD, Basnyat R, Ainslie PN. Alterations in cerebral blood flow and cerebrovascular reactivity during 14 days at 5050 m. J Physiol. 2011;589:741–53. doi: 10.1113/jphysiol.2010.192534. [DOI] [PMC free article] [PubMed] [Google Scholar]
- Mazzeo RS, Wolfel EE, Butterfield GE, Reeves JT. Sympathetic response during 21 days at high altitude (4,300 m) as determined by urinary and arterial catecholamines. Metabolism. 1994;43:1226–32. doi: 10.1016/0026-0495(94)90215-1. [DOI] [PubMed] [Google Scholar]
- Millet GY, Muthalib M, Jubeau M, Laursen PB, Nosaka K. Severe hypoxia affects exercise performance independently of afferent feedback and peripheral fatigue. J Appl Physiol. 2012;112:1335–44. doi: 10.1152/japplphysiol.00804.2011. [DOI] [PubMed] [Google Scholar]
- Miscio G, Milano E, Aguilar J, Savia G, Foffani G, Mauro A, Mordillo-Mateos L, Romero-Ganuza J, Oliviero A. Functional involvement of central nervous system at high altitude. Exp Brain Res. 2009;194:157–62. doi: 10.1007/s00221-009-1729-1. [DOI] [PubMed] [Google Scholar]
- Mounier R, Brugniaux JV. Last Word on Counterpoint: Hypobaric hypoxia does not induce different physiological responses from normobaric hypoxia. J Appl Physiol. 2012;112:1796–1796. doi: 10.1152/japplphysiol.00355.2012. [DOI] [PubMed] [Google Scholar]
- Nieber K, Eschke D, Brand A. Brain hypoxia: effects of ATP and adenosine. Prog Brain Res. 1999;120:287–97. doi: 10.1016/s0079-6123(08)63563-3. [DOI] [PubMed] [Google Scholar]
- Nybo L, Rasmussen P. Inadequate cerebral oxygen delivery and central fatigue during strenuous exercise. Ex Sport Sci Rev. 2007;35:110–118. doi: 10.1097/jes.0b013e3180a031ec. [DOI] [PubMed] [Google Scholar]
- Oliviero A, Corbo G, Tonali PA, Pilato F, Saturno E, Dileone M, Versace V, Valente S, Di Lazzaro V. Functional involvement of central nervous system in acute exacerbation of chronic obstructive pulmonary disease A preliminary transcranial magnetic stimulation study. J Neurol. 2002;249:1232–6. doi: 10.1007/s00415-002-0817-y. [DOI] [PubMed] [Google Scholar]
- Palange P. Renal and hormonal abnormalities in chronic obstructive pulmonary disease (COPD) Thorax. 1998;53:989–91. doi: 10.1136/thx.53.11.989. [DOI] [PMC free article] [PubMed] [Google Scholar]
- Perrey S, Rupp T. Altitude-induced changes in muscle contractile properties. High Alt Med Biol. 2009;10:175–82. doi: 10.1089/ham.2008.1093. [DOI] [PubMed] [Google Scholar]
- Poulin MJ, Robbins PA. Indexes of flow and cross-sectional area of the middle cerebral artery using doppler ultrasound during hypoxia and hypercapnia in humans. Stroke. 1996;27:2244–50. doi: 10.1161/01.str.27.12.2244. [DOI] [PubMed] [Google Scholar]
- Roach RC, Bartsch P, Olez O, Hackett PH. The Lake Louise acute mountain sickness scoring system. In: SUTTON JR, HOUSTON CS, COATES G, editors. Hypoxia and Mountain Medicine. Burlinton, VT: Queen City Printers Inc; 1993. [Google Scholar]
- Romer LM, Haverkamp HC, Amann M, Lovering AT, Pegelow DF, Dempsey JA. Effect of acute severe hypoxia on peripheral fatigue and endurance capacity in healthy humans. Am J Physiol Reg, Int Com Physiol. 2007;292:R598–606. doi: 10.1152/ajpregu.00269.2006. [DOI] [PubMed] [Google Scholar]
- Rossman MJ, Venturelli M, McDaniel J, Amann M, Richardson RS. Muscle mass and peripheral fatigue: a potential role for afferent feedback? Acta Physiol (Oxf) 2012;206:242–50. doi: 10.1111/j.1748-1716.2012.02471.x. [DOI] [PMC free article] [PubMed] [Google Scholar]
- Rothwell JC, Thompson PD, Day BL, Boyd S, Marsden CD. Stimulation of the human motor cortex through the scalp. Exp Physiol. 1991;76:159–200. doi: 10.1113/expphysiol.1991.sp003485. [DOI] [PubMed] [Google Scholar]
- Rupp T, Jubeau M, Wuyam B, Perrey S, Levy P, Millet GY, Verges S. Time-dependent effect of acute hypoxia on corticospinal excitability in healthy humans. J Neurophysiol. 2012;108:1270–7. doi: 10.1152/jn.01162.2011. [DOI] [PubMed] [Google Scholar]
- Serrador JM, Picot PA, Rutt BK, Shoemaker JK, Bondar RL. MRI measures of middle cerebral artery diameter in conscious humans during simulated orthostasis. Stroke. 2000;31:1672–8. doi: 10.1161/01.str.31.7.1672. [DOI] [PubMed] [Google Scholar]
- Sidhu SK, Bentley DJ, Carroll TJ. Cortical voluntary activation of the human knee extensors can be reliably estimated using transcranial magnetic stimulation. Muscle Nerve. 2009a;39:186–96. doi: 10.1002/mus.21064. [DOI] [PubMed] [Google Scholar]
- Sidhu SK, Bentley DJ, Carroll TJ. Locomotor exercise induces long-lasting impairments in the capacity of the human motor cortex to voluntarily activate knee extensor muscles. J Appl Physiol. 2009b;106:556–65. doi: 10.1152/japplphysiol.90911.2008. [DOI] [PubMed] [Google Scholar]
- Subudhi AW, Fan JL, Evero O, Bourdillon N, Kayser B, Julian CG, Lovering AT, Roach R. AltitudeOmics: Effect of ascent and acclimatization to 5260 m on regional cerebral oxygen delivery. Exp Physiol. 2013 doi: 10.1113/expphysiol.2013.075184. [DOI] [PubMed] [Google Scholar]
- Subudhi AW, Miramon BR, Granger ME, Roach RC. Frontal and motor cortex oxygenation during maximal exercise in normoxia and hypoxia. J Appl Physiol. 2009;106:1153–8. doi: 10.1152/japplphysiol.91475.2008. [DOI] [PMC free article] [PubMed] [Google Scholar]
- Subudhi AW, Olin JT, Dimmen AC, Polaner DM, Kayser B, Roach RC. Does cerebral oxygen delivery limit incremental exercise performance? J Appl Physiol. 2011;111:1727–34. doi: 10.1152/japplphysiol.00569.2011. [DOI] [PMC free article] [PubMed] [Google Scholar]
- Szubski C, Burtscher M, Loscher WN. The effects of short-term hypoxia on motor cortex excitability and neuromuscular activation. J Appl Physiol. 2006;101:1673–1677. doi: 10.1152/japplphysiol.00617.2006. [DOI] [PubMed] [Google Scholar]
- Taylor JL, Butler JE, Gandevia SC. Altered responses of human elbow flexors to peripheral-nerve and cortical stimulation during a sustained maximal voluntary contraction. Exp Brain Res. 1999;127:108–15. doi: 10.1007/s002210050779. [DOI] [PubMed] [Google Scholar]
- Taylor JL, Gandevia SC. Transcranial magnetic stimulation and human muscle fatigue. Muscle & nerve. 2001;24:18–29. doi: 10.1002/1097-4598(200101)24:1<18::aid-mus2>3.0.co;2-d. [DOI] [PubMed] [Google Scholar]
- Todd G, Taylor JL, Gandevia SC. Measurement of voluntary activation of fresh and fatigued human muscles using transcranial magnetic stimulation. J Physiol. 2003;551:661–671. doi: 10.1113/jphysiol.2003.044099. [DOI] [PMC free article] [PubMed] [Google Scholar]
- Willie CK, Macleod DB, Shaw AD, Smith KJ, Tzeng YC, Eves ND, Ikeda K, Graham J, Lewis NC, Day TA, Ainslie PN. Regional brain blood flow in man during acute changes in arterial blood gases. J Physiol. 2012;590:3261–75. doi: 10.1113/jphysiol.2012.228551. [DOI] [PMC free article] [PubMed] [Google Scholar]
- Wilson MH, Edsell ME, Davagnanam I, Hirani SP, Martin DS, Levett DZ, Thornton JS, Golay X, Strycharczuk L, Newman SP, Montgomery HE, Grocott MP, Imray CH, Caudwell Xtreme Everest Research, G Cerebral artery dilatation maintains cerebral oxygenation at extreme altitude and in acute hypoxia–an ultrasound and MRI study. J Cereb Blood Flow Metab. 2011;31:2019–29. doi: 10.1038/jcbfm.2011.81. [DOI] [PMC free article] [PubMed] [Google Scholar]
- Xu K, Lamanna JC. Chronic hypoxia and the cerebral circulation. J Appl Physiol. 2006;100:725–30. doi: 10.1152/japplphysiol.00940.2005. [DOI] [PubMed] [Google Scholar]