Abstract
The aim of the present study was to compare proximal femur strength and stiffness obtained experimentally with estimations from Finite Element Analysis (FEA) models derived from Quantitative Computed Tomography (QCT) scans acquired at two different scanner settings. QCT/FEA models could potentially aid in diagnosis and treatment of osteoporosis but several drawbacks still limit their predictive ability. One potential reason is that the models are still sensitive to scanner settings which could lead to changes in assigned material properties, thus limiting their results accuracy and clinical effectiveness. To find the mechanical properties we fracture tested 44 proximal femora in a sideways fall-on-the-hip configuration. Before testing, we CT scanned all femora twice, first at higher resolution scanner settings, and second at a lower resolution scanner settings and built 88 QCT/FEA models of femoral strength and stiffness. The femoral set neck bone mineral density, as measured by DXA, uniformly covered the range from osteoporotic to normal. This study showed that the femoral strength and stiffness values predicted from high and low resolution scans were significantly different (p < 0.0001). Strength estimated from high resolution QCT scans was larger for osteoporotic, but smaller for normal and osteopenic femora when compared to low resolution scans. In addition, stiffness estimated from high resolution scans was consistently larger than stiffness obtained from low resolution scans over the entire femoral dataset. While QCT/FEA techniques hold promises for use in clinical settings we provided evidence that further improvements are required to increase robustness in their predictive power under different scanner settings and modeling assumptions.
Keywords: Femur Fracture, Osteoporosis, Quantitative Computed Tomography, Finite Element Analysis, CT resolution
1. Introduction
A desire to reduce the level of mortality and morbidity due to hip fracture in the elderly population has fueled the advancement of techniques designed to provide fracture risk prediction using non-invasive methods (Center et al. 1999; Kanis et al. 2004; Morin et al. 2011). QCT/FEA subject-specific femur modeling was shown to provide high quality estimations of proximal femur strength, stiffness, and prediction of fracture location (Bessho et al. 2007; Bessho et al. 2009; Dragomir-Daescu et al. 2011; Keyak 2001; Keyak et al. 2001; Schileo et al. 2008). Its popularity is based on the ability to produce precise three-dimensional geometries from high resolution QCT images of the human femur (Viceconti et al. 1998; Viceconti et al. 2004) and to provide well-defined material property input to FEA models (Genant et al. 1999; Morgan et al. 2003; Taddei et al. 2006) – two variables essential for accurate results.
It has been shown that scanner type (single vs. dual source), image reconstruction algorithm, slice thickness/pitch, and power (changes in voltage and/or amperage) result in statistically significant differences in noise and contrast due to changes in greyscale values (Paul et al. 2012). It is therefore likely that changes in CT scanning parameters may lead to changes in FEA outcomes even when the same bone is scanned at varied settings. Clinical QCT scans are taken with the goal of minimizing tube current time (mAs) in order to decrease the amount of radiation to the patient, while in contrast, many research institutions developing techniques for fracture risk prediction with cadaveric bone tissue tend to select scanning parameters to provide for increased image quality (high mAs) for FEA input while disregarding the amount of radiation exposure to the tissue. Thus, information on how scanner parameters affect FEA outcomes would be valuable for researchers who desire to use QCT/FEA techniques in a clinical setting for fracture risk prediction in patients, but have developed their QCT/FEA technique using research quality scanner parameters at high mAs.
Though many researchers have provided extensive data comparing their QCT/FEA based results to experimental results, to our knowledge, none have examined the quality of the CT input data as a determining factor for the outcome of the FE analyses. The objective of our study was to compare if FE models whose grey scale values were obtained from low amperage scans reconstructed with smooth kernels (low resolution) are predicting strength and stiffness values comparable with models whose grey scale values were obtained from high amperage scans reconstructed with sharp kernels (high resolution) – the former representing the standard for clinical settings, and the latter representing the current standard in research settings. This will provide valuable information on whether QCT/FEA bone strength and stiffness predictions using lower quality clinical QCT scans are similar to those using techniques developed using research quality scans of cadaveric femora. We thus compared how finite element estimations of strength and stiffness for a sample of 44 cadaveric femora scanned at high and low scanner resolution settings were correlated to each other, and individually with experimental test results in a fall-on-the-hip configuration.
2. Methods
2.1 Experimental Tests
All experimental procedures were approved by our Institutional Review Board and followed methodologies published previously. Some details on materials and methods relevant to the current study are briefly recapitulated (Dragomir-Daescu et al. 2011).
2.1.1 Femur Specimens and QCT Scanning Protocol
Forty-four fresh frozen, transplant grade cadaveric femora were obtained from 44 individual donors (Table 1). The specimens were selected from a larger cohort of 100 cadaveric specimens based on femoral neck areal bone mineral density (aBMD) T-score (GE Lunar iDXA, GE Healthcare Inc., Madison, WI) such that the sample uniformly covered the range from osteoporotic to normal. All specimens were thawed to room temperature and scanned in air for maximum contrast using a Siemens Somatom Definition CT scanner (Siemens Healthcare, Forchheim, Germany). Each femur was scanned twice in the same position using two distinct QCT protocols for model comparison (Fig. 1).
Table 1.
Donor statistics for 44 femora data set
| Bone Quality | Quantity | T-score | Mean Age at death | Age range | Sex | Side | Mean (SD)Femoral Neck aBMD (g/cm2) |
|---|---|---|---|---|---|---|---|
| Osteoporotic | 14 | ≤ −2.5 | 75 | 53–97 | 12 Females, 2 Males | 7 Right, 7 Left | 0.592 (0.090) |
| Osteopenic | 15 | −2.49, −1 | 67 | 46–91 | 10 Females, 5 Males | 6 Right, 9 Left | 0.802 (0.061) |
| Normal | 15 | ≥ −1 | 59 | 34–89 | 5 Females, 10 Males | 9 Right, 6 Left | 1.027 (0.147) |
Figure 1.
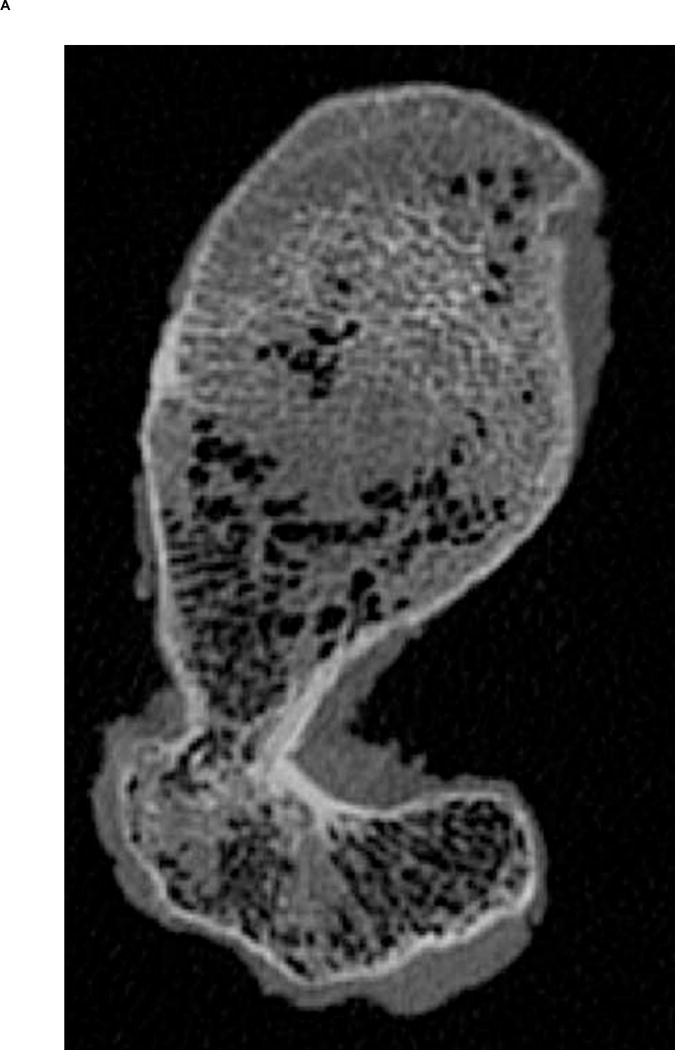
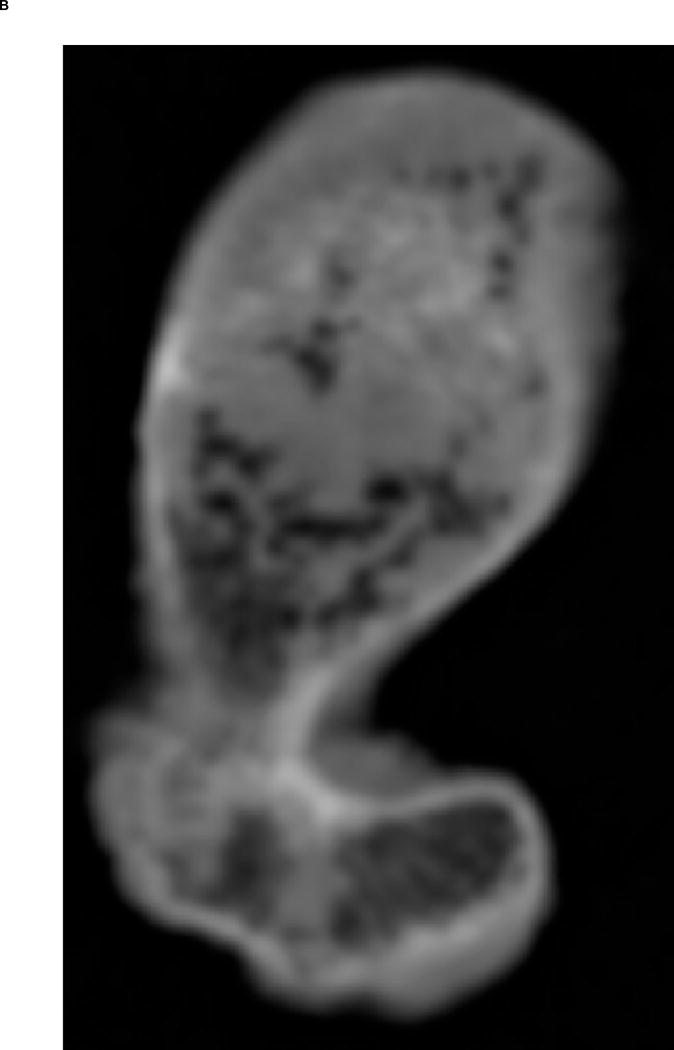
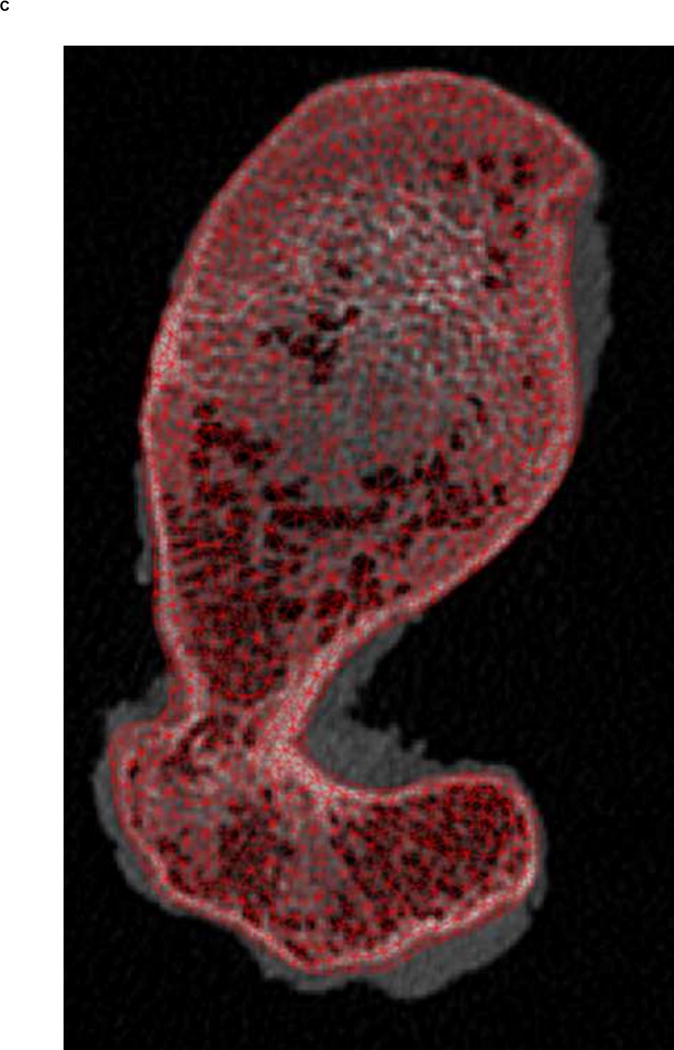
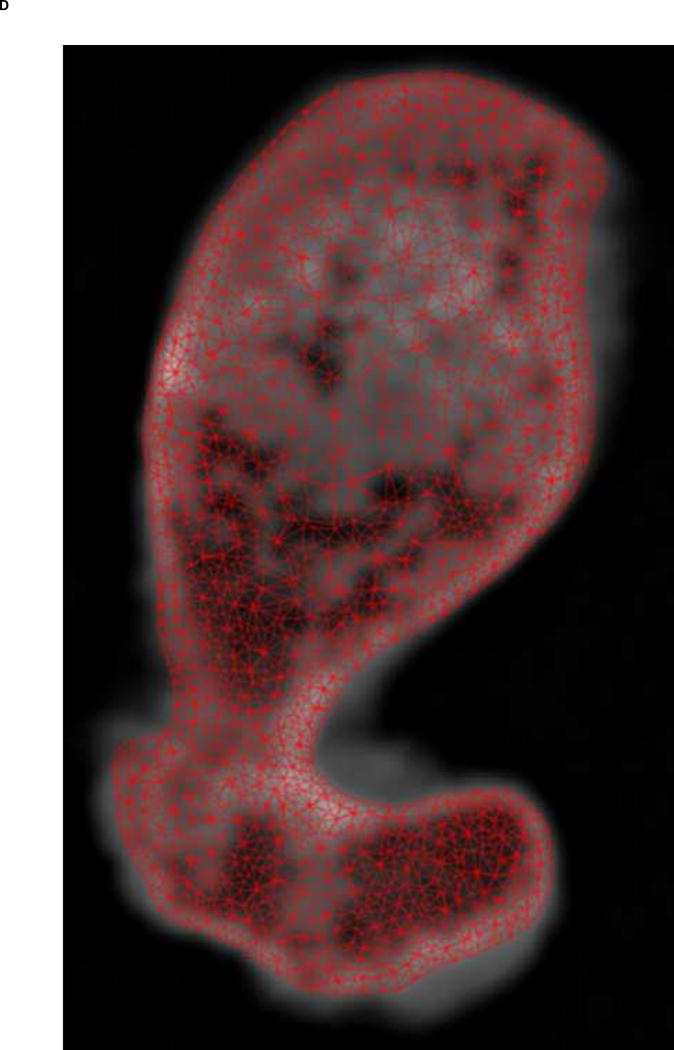
A. Transverse view of proximal femur metaphysis using high resolution QCT scanning settings. B. Transverse view of proximal femur metaphysis using low resolution QCT scanning setings. Low resolution image shows lower contrast than high resolution image. C. Transverse cross-section of high resolution QCT/FEA meshed model. D. Transverse cross-section of low resolution QCT/FEA meshed model.
High Resolution Research QCT Protocol: Scanner power – 120kVp and 216mAs; Image reconstruction – sharp (U70) kernel with in-plane pixel size 0.3–0.45 mm (Fig. 1A); Slice increment and thickness – 0.4 mm; Average number of QCT slices per femur – 1120.
Low Resolution Clinical QCT Protocol: Scanner power – 120kVp and 20mAs; Image reconstruction – body (B30) kernel with in-plane pixel size 0.3–0.45 mm (Fig. 1B); Slice increment and thickness – 2 mm; Average number of QCT slices per femur – 230.
A QCT scanning phantom (Mindways Inc., Austin, TX, USA) was placed in the field of view to convert Hounsfield units (HU) to equivalent K2HPO4 density, assumed to be equal to bone ash density (Cong et al. 2011):
| (1) |
2.1.2 Experimental Testing Protocol
Experimental testing was conducted using a Mini Bionix testing machine (MTS, Eden Prarie, MN, USA). Femora were tested to failure in a fall-on-the-hip loading configuration (15° internal rotation, 10° adduction) at a speed of 100 mm/s (Dragomir-Daescu et al. 2011). Data from a single axis load cell that measured the vertical reaction forces at the greater trochanter and a linear displacement sensor that measured actuator displacement at the femoral head were used for comparison to QCT/FEA estimated results. Experimental strength was determined as the peak load prior to specimen failure while stiffness of each bone was calculated from the most linear initial region of the experimental load-displacement curves.
2.2 Subject-Specific QCT/FEA Models
2.2.1 Image-Based Mesh Generation
Finite element meshes were generated from QCT images using the Materialise Interactive Medical Image Control System – Mimics® 13.0 and 14.01 (Materialise, Plymouth, MI, USA). Dicom images obtained from the scans were imported into Mimics® software and the bone tissue was segmented using a threshold of 300 HU and each slice edited manually to ensure it included the entire cortical bone region. Since the high resolution QCT slices showed better contrast than low resolution QCT slices (Fig. 1A & B), we used the high resolution scans for segmentation and generation of the 3D geometry. Triangular surface meshes generated using the Mimics® FEA module followed a “smart” meshing technique with maximum element edge lengths of 4.0 mm (mid diaphysis), 2.5 mm (proximal diaphysis), and 1.5 mm (proximal metaphysis). Unstructured tetrahedral volume meshes were automatically generated from triangular surface meshes with ANSYS ICEM (ANSYS, Canonsburg, PA, USA) using 10-noded tetrahedral elements and an advancing front algorithm so that elements in the cancellous compartment were larger than elements in the cortex (Fig. 1C–D). These meshing parameters were shown to lead to converged results based on a previous mesh sensitivity study performed with high resolution scans (Dragomir-Daescu et al. 2011). The same 3D meshes generated were then imported into the low resolution scans in Mimics® models to assign material properties (Fig. 1C–D). A new sensitivity study was performed to confirm that the mesh derived from high resolution scans also resulted in mesh independent results for the low resolution models.
2.2.2 Material Property Assignment
Material properties, including bone ash density, elastic modulus and yield strain, were grouped into 42 discrete material property bins based on average HU number within the element and were mapped to the QCT/FEA models using the Mimics® FEA module. Each finite element elastic modulus (E, [MPa]) was obtained from literature based on a density-elastic modulus relationship established by Morgan et al. (2003):
| (2) |
, assuming that ρash is measured in [g/cm3] and a ratio between ash density and apparent density . Poisson’s ratio was set to 0.3 for all material bins. The resulting elastic modulus range for the bone material bins was approximately 0.7 GPa to 24 GPa. Histograms showing the distribution of the number of elements by bin number were generated in order to further investigate the effects of CT resolution on the material property distribution of each bone (Fig. 4). Yield strain (εy) was determined by a procedure designed to increase the agreement between experimental and FEA predicted fracture forces as published by Dragomir-Daescu et al. (2011):
| (3) |
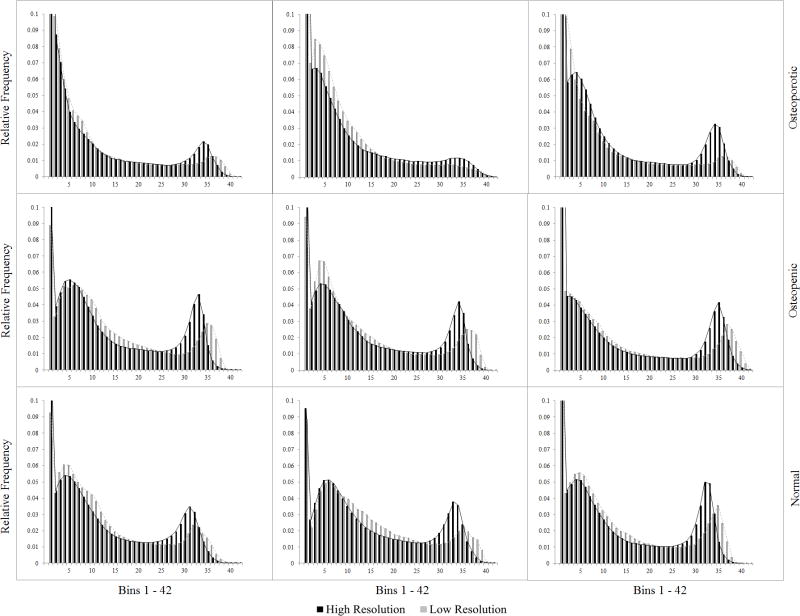
Figure 4.
Normalized material modulus histograms for nine femora. (three osteoporotic, three osteopenic, three with normal bone mineral density)
2.2.3 Finite Element Simulation
Finite element simulations were conducted using ANSYS Mechanical APDL (ANSYS, Canonsburg, PA, USA). Boundary conditions were applied to each QCT/FEA model matching constraints from experimental testing. A distributed vertical load was applied monotonically to selected femoral head nodes in 100 N increments. Damage to the femur was modeled using a von Mises (εvM) strain criterion. To model the failure pattern, elements exceeding the yield strain in Eq. 3 were considered damaged, i.e. they were assigned a small elastic modulus value of 0.01MPa for the remainder of the simulation. For each femur, experimental load–displacement curves were compared to QCT/FEA generated curves. Strength for each QCT/FEA model was estimated as the load corresponding to 3.4 mm displacement which was the average experimental displacement at peak forces in all 44 experimental tests. Stiffness was calculated from the initial, linear regions of the simulated load-displacement curves.
2.2.4 Analysis of Results
Linear regression models were developed to compare the high and low resolutions predictions for the entire set of 44 femora using QCT/FEA estimated strength and stiffness values. Models were also developed for using QCT/FEA data as predictors for experimentally measured femoral strength and stiffness. The differences between the resolution settings were evaluated by comparing the slope and intercepts of the regression equations between the two QCT/FEA resolutions with their 95% confidence intervals using JMP statistical analysis software (SAS Institute Inc., Cary, North Carolina). Additionally, a paired t-test with Bland Altman mean-difference plots was used to assess significance of mean differences between the two resolution settings.
3. Results
3.1 Differences between resolution settings using QCT/FEA predictions
Mesh sensitivity studies performed for both high and low resolutions confirmed that all the prediction results obtained in the current study for both strength and stiffness were mesh independent.
3.1.1 Linear regression
To directly assess the similarity of the strength and stiffness values predicted by the two resolutions, regression models were developed. For strength, the regression model using low resolution QCT/FEA strength [N] as a predictor for high resolution QCT/FEA strength [N] was as follows:
| (4) |
with an adjusted coefficient of determination of R2=0.97 (Fig. 2A). The 95% confidence interval for the slope was 0.742 to 0.815 and for the intercept was 419 to 751, neither including the expected values of 1.0 for the slope and of 0 for the intercept, respectively.
Figure 2.
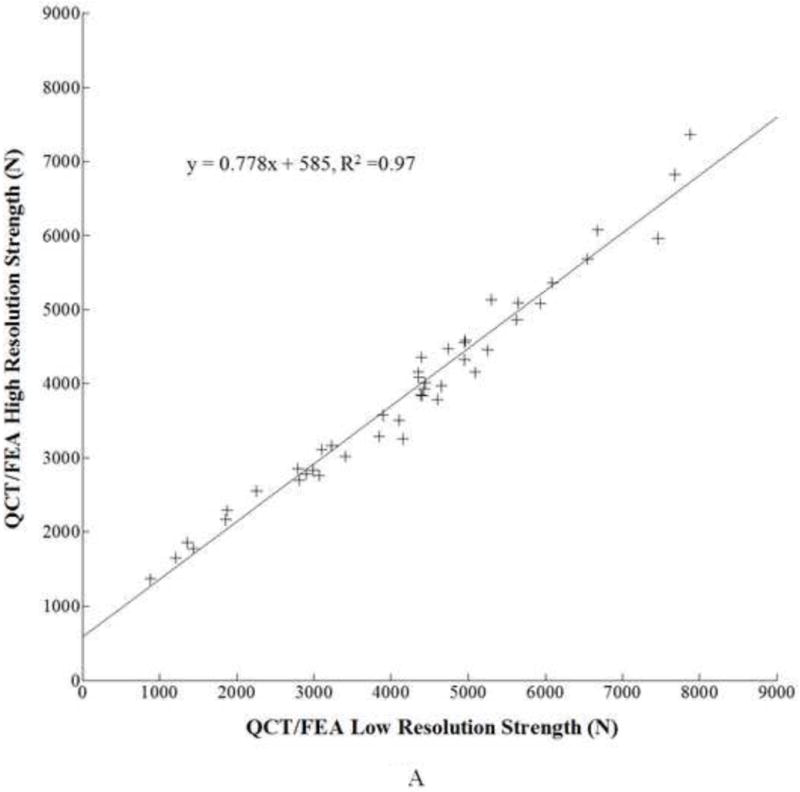
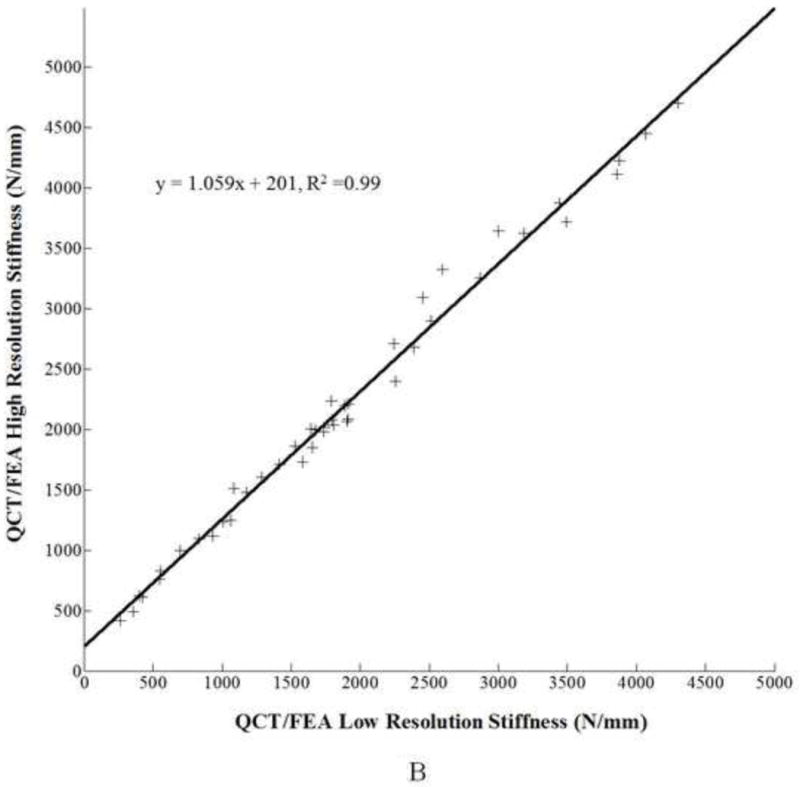
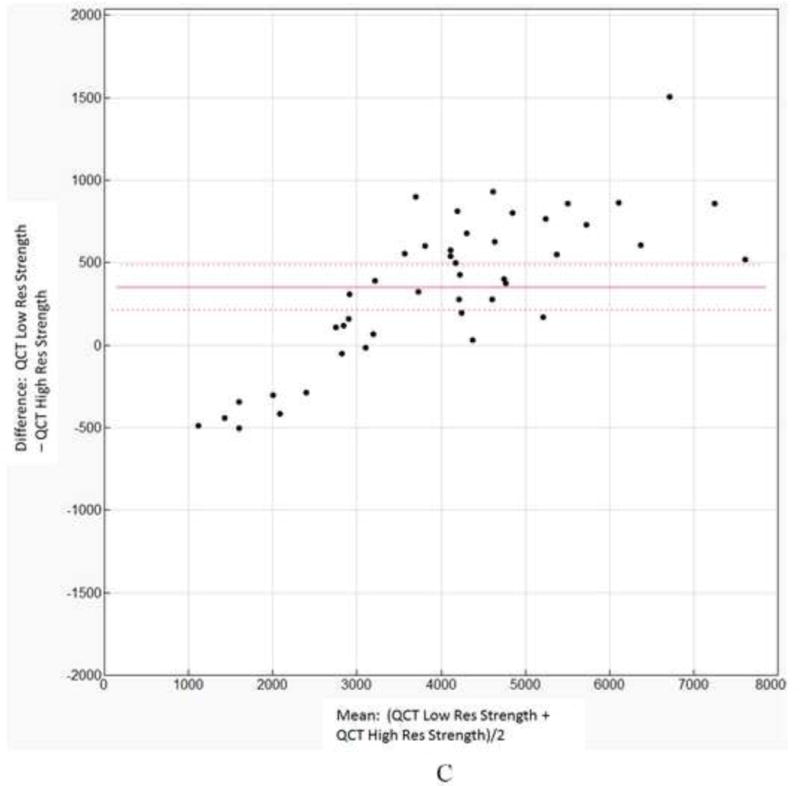
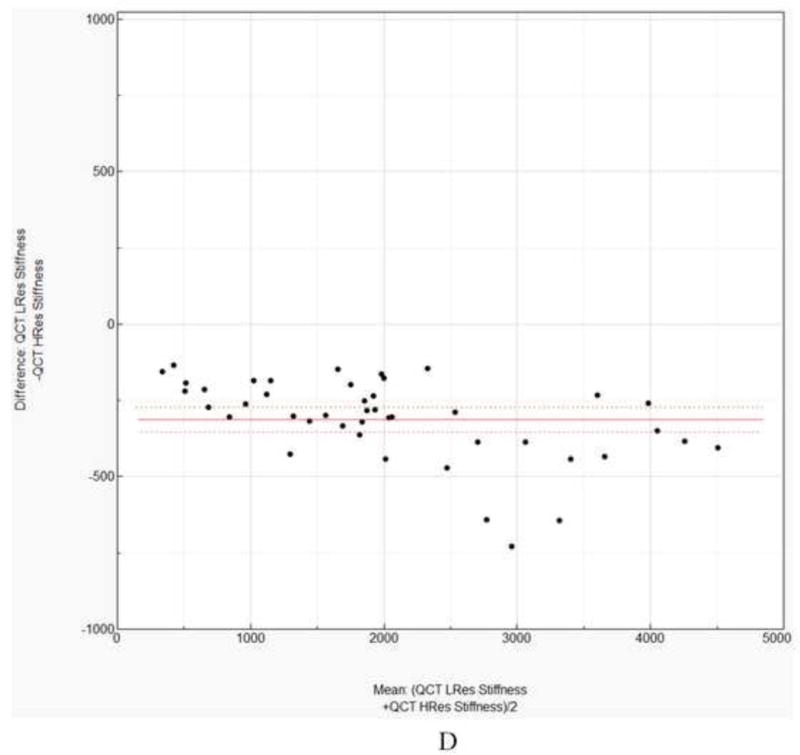
A. Linear regression for low resolution QCT/FEA estimated strength as a predictor of high resolution QCT/FEA estimated strength. B. Linear regression for low resolution QCT/FEA estimated stiffness as a predictor of high resolution QCT/FEA estimated stiffness. C. Bland Altman mean difference plot for strength. D. Bland Altman mean difference plot for stiffness.
Similarly, for femoral stiffness, a linear regression model was developed using low resolution QCT/FEA estimated stiffness [N/mm] as a predictor for high resolution QCT/FEA estimated stiffness [N/mm], as follows:
| (5) |
, with adjusted R2 = 0.99 (Fig. 2B). The confidence interval for the slope was 1.030 to 1.088 and for the intercept was 139 to 263, neither including 1.0 and 0 for slope and intercept, respectively.
3.1.2 Paired t-tests and Bland Altman plots
A paired t-test showed that the differences in the strength values predicted by the two resolution models were statistically significant at p < 0.0001 with a mean difference of 351 N. The Bland Altman plot showing the individual differences against the sample means is shown in Fig 2C. The 95% confidence interval of the mean differences did not include zero.
Again, a paired t-test using stiffness values predicted by the two resolution models showed statistically significant differences of the means (p < 0.0001) with a mean difference of −312 N/mm. A Bland Altman plot showing the individual differences against the sample means is shown in Fig 2D. Similar to strength, the 95% confidence interval of the mean differences did not include zero.
3.2 Resolution-specific predictive regression models for strength and stiffness
For femoral strength, the values predicted by the high resolution QCT/FEA models [N] were correlated to the experimental strength (Se) [N] through a linear regression equation as follows:
| (6) |
, with an adjusted coefficient of determination R2=0.77. For the low resolution models for strength the regression equation was:
| (7) |
where, [N] is the strength predicted by the low resolution models. The adjusted coefficient of determination was R2=0.73. The strength data scatter plots and the regression lines for both resolutions are shown in Fig. 3A.
Figure 3.
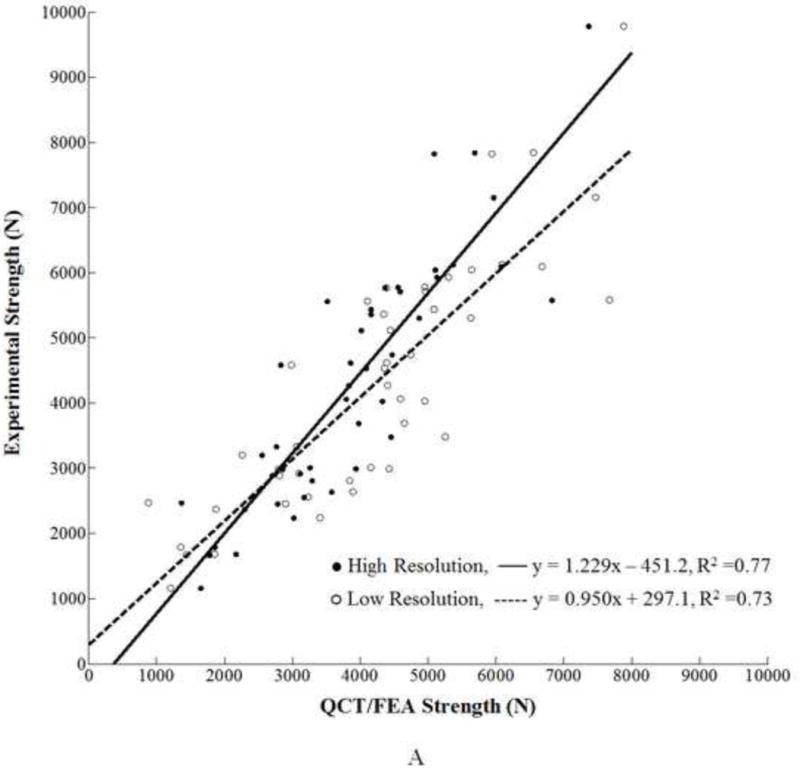
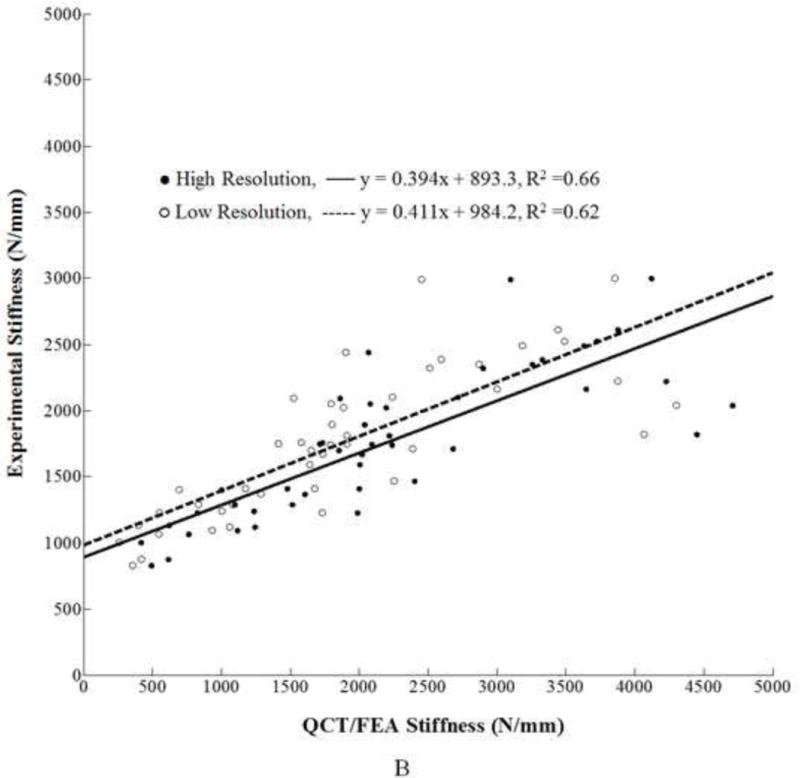
A. Linear regression for high and low resolution QCT/FEA estimated strength as predictors of experimental strength. B. Linear regression for high and low resolution QCT/FEA estimated stiffness as predictors of experimental stiffness.
Similarly, for stiffness, the predicted values from the high resolution models [N/mm] were correlated to the experimental stiffness, Ke [N/mm], through the following regression equation:
| (8) |
, with adjusted R2 = 0.66 (Fig. 3B). The low resolution models for femoral stiffness resulted in the following linear regression equation:
| (9) |
, where is the stiffness predicted by the low resolution models. The adjusted coefficient of determination was R2 = 0.62.
To further examine the possible causes of the observed differences in QCT/FEA results between the two resolutions, the elastic modulus distributions were compared for nine randomly selected femora. Figure 4 shows the histograms of the numbers of finite elements as a function of the bin number for three osteoporotic, three osteopenic, and three normal aBMD femora. The horizontal axis represents the material bin number, with bin number 1 corresponding to the least dense material and bin number 42 to the densest material. An analysis of the histograms showed a more similar material distribution between high and low resolution models for two of the osteoporotic femora (Fig. 4). The high resolution models had a larger number of finite elements assigned between approximately bin 20 and bin 35 (ash density range: 0.650 – 1.170 g/cm3) than the low resolution models. On the other hand, for low resolution a larger number of elements were usually assigned to the lower bins 1 through 6 (ash density range: 0.01 – 0.199 g/cm3) and to the higher bins, approximately in the range between bin 36 and bin 42 (ash density range: 1.205 to 1.758 g/cm3). Overall, the largest differences were noted in the bin range 27 – 35 (ash density range: 0.999 to 1.170 g/cm3), where many more elements were assigned to these bins in the high resolution models. These bins account for much of the range of dense cortical bone.
Discussion
The aim of the present study was to evaluate if finite element models generated from low resolution QCT scans of the proximal femur provided similar results accuracy when compared to models generated from high resolution QCT scans. An important finding of this work is that QCT/FEA estimated femoral strength and stiffness results from the two resolutions show significant differences through multiple statistical comparisons. The slope of the line was closer to unity for stiffness at m=1.059 (Fig 2B) than for strength at m=0.778 (Fig. 2A). However, the 95% confidence intervals for the slope and intercept parameter estimates for both strength and stiffness did not include one and zero, respectively, indicating a lack of similarity between the two resolution for both quantities. In addition, the paired t-test also showed that the means of the differences for both strength and stiffness estimates between the high and the low resolution models were statistically different (p < 0.001). Finally, considering the Bland Altman plot for the strength comparison, we also noticed that the mean difference fell well outside the 95% confidence interval (214.7 N to 487.9N, Fig 2C). Similar trends held for the stiffness predictor from the two methods (95% confidence interval was −353.2 N/mm to −271.7 N/mm, Fig. 2D). For researchers using similar methods this would mean that femoral strength prediction results from two different resolutions may not be used interchangeably even when using the exact same elastic modulus (Eq. 2) and damage law (Eq. 3). The evidence supporting the differences between the methods showed the necessity of different predictive models for each scanning resolution, thus, linear correlation regression analysis was independently completed for the predictions and the experimental results for each resolution. For strength prediction the high resolution models yielded Eq. 6 while the low resolution models resulted in Eq. 7. Similarly, two different equations were derived for stiffness, Eq. 8 for high resolution and Eq. 9 for low resolutions.
Analysis of material histograms provided additional insight into the differences seen in the linear correlations. In the high resolution models of the normal and osteopenic femora an important number of finite elements were assigned to bins 27–35. This HU range is within the density range for dense cortical bone. However, in the low resolution scans of the same femora a relatively smaller number of elements were assigned mechanical properties values corresponding to cortical bone resulting in comparatively more elements in the lower density bins and fewer in the high density bins than their high resolution counterparts. Therefore, assigning a lower density ρash to those elements resulted in a higher elemental yield strain εy (Eq. 3) for the low resolution models. Thus, for normal or osteopenic femora the low resolution models had a greater number of lower density elements with higher elemental yield strain, εy, and the strength was consequently overestimated compared to the strength estimated for the same femora but scanned at high resolution. This is precisely what is pictured in Fig. 3A for most femora that fall in the normal and osteopenic bone density range. Such an overestimation occurred because elemental yield strain (εy) is determined locally from the damage law described in Eq. 3, where εy is proportional to the elemental density (ρash) raised to a negative power. Globally, the ultimate strength for each specimen model increases when the number of elements with the von Mises strain not exceeding the element yield strain also increases which was the case for the low resolution models of the normal and osteopenic femora with more elements being assigned a larger yield value than in the high resolution models. In contrast, most osteoporotic femora had much fewer elements assigned to the range of cortical bone (bins 27–37) therefore the shift to lower density bins in the low resolution models occurred less frequently thus leading to less prominent differences in strength estimates.
As with most finite element biomechanical studies our work has some limitations. Although our sample size was relatively large at n=44, results may still vary for different samples depending on cohort size, relative distributions of bone mineral density among the femora, or other FEA modeling parameters. Additionally, in the finite element model we chose to use a failure criterion which only accounts for yielding based on von Mises strains. It is known that yield strains for bone are different in tension and compression. Future work will incorporate multi-directional yield criteria for strain to assess potential improvements.
Furthermore, our study compared only two QCT scenarios, one with high amperage/sharp kernel and another with low amperage/smooth kernel, because of time constraints related to keeping the samples at room temperature for scanning. In practice, most clinical scans might use settings that fall anywhere in between the high and low resolution settings used here and thus smaller differences could be seen. Selection of the current intensity value of 216 mAs for the higher resolution setting came from a brief review of ten articles published between 2004 and 2011 that showed most cadaveric FE models have been developed using QCT images from high amperage settings in the range of 140–280 mAs (Bessho et al. 2009; Dragomir-Daescu et al. 2011; Duchemin et al. 2008; Keyak et al. 2008; Schileo et al. 2008; Schileo et al. 2008; Taddei et al. 2006; Taddei et al. 2007; Tanck et al. 2009; Viceconti et al. 2004). A sharp reconstruction kernel was selected because it lead to increased spatial resolution making the segmentation process for 3D modeling easier. On the other hand, many QCT data sets resulting from present day clinical scans would be generated with a lower tube current that falls within the low-to-high range used in the present study. Additionally, a smooth kernel for lower resolution scans reconstruction is commonly used in clinical settings to reduce image artifacts that may affect the ability for a radiologist to review the images. Convolution of a varied tube current and different reconstruction kernel makes it hard to distinguish which of the parameters more greatly affected the QCT/FEA results. However, it has been shown that varying reconstruction kernel affects only moderately (0 to +/−75HU) the intensity of pixels along a line in a water-filled phantom (Jang et al. 2011). It is likely that a random change in grey value due to the reconstruction kernel would not significantly affect the QCT/FEA modulus distributions because we are using a binning procedure with a bin size of 50 HU to calculate elastic material properties. Therefore, even a grey value increase or decrease by the maximum shift value of 75HU may only shift the assigned modulus by one or two bins – up or down – thus insufficient to meaningfully change the assigned material properties. We believe that tube current has a greater effect on the FE outcome. Studies using CT phantoms are currently underway at our institution to quantify these differences.
The use of QCT/FEA as a tool for hip fracture prediction has been suggested by many authors working in the field (Bessho et al. 2009; Cody et al. 1999; Dragomir-Daescu et al. 2011; Keaveny 2010; Keyak 2001). A number of these groups, using high resolution QCT scanning of cadaveric samples, have developed highly accurate models validated through experimental testing. Using these cadaveric QCT/FEA studies as proof of concept they have then proceeded to employ their parameters to model clinical data with no intermediate studies to prove feasibility when using patient equivalent lower resolution data (Amin et al. 2011; Keaveny et al. 2010; Keaveny et al. 2012; Keyak et al. 2011; Orwoll et al. 2009). It should be noted that most of these studies were successful at showing that QCT/FEA femoral strength predictions outperform aBMD as a predictor for fracture for their respective datasets. When using clinical CT data for strength prediction, only a QCT/FEA model specifically optimized for low (patient) resolution scans with decreased out-of-plane resolution and lower tube current can guarantee accurate failure predictions and true stress-strain bone material behavior. Our current study has thus contributed to filling the gap in QCT/FEA modeling for prediction of hip fracture. We provided evidence that studies using specifically optimized high resolution QCT parameters may not necessarily translate well to patient models obtained at lower resolution if using the same FEA parameters when processing the clinical scans, however, the errors appear to be systematic and can be compensated for using the procedures outlined in this work.
In conclusion, this study showed that the estimations, in particular for bone strength, obtained from low resolution and high resolution QCT scans were very different, requiring independent model verification and parameter refinement. These results also indicated that users at different laboratories could potentially obtain distinctly dissimilar linear regression models to predict strength or stiffness, if handling the CT settings and reconstructed images differently. It is therefore necessary to further explore and understand the promises but also the limitations of QCT/FEA modeling. We believe that with additional improvements robust models from varied QCT datasets can be used in the clinic with increased capability to predict patient specific hip fracture strength.
Acknowledgments
The authors wish to thank Rachel Entwistle, Jim Bronk, Sean McEligot, Vishwas Mathur, Ian Gerstel, Viorel Hodis, Dr. Ramesh Ragupathy, Dr. Sudeep Sastry, Dr. Jodie Christner, Dr. Cynthia McCollough, Mike Burke, and Larry Berglund for their valuable contributions to this study. This study was financially supported by the Grainger Foundation: Grainger Innovation Fund and NIH grant AR027065Z-30S1. Study sponsors had no involvement in study design, data analysis collection or interpretation, or writing of the manuscript. This publication was made possible by CTSA Grant Number UL1 TR000135 from the National Center for Advancing Translational Sciences (NCATS), a component of the National Institutes of Health (NIH). The authors thank the Opus CT Imaging Resource of Mayo Clinic (NIH construction grant RR018898) for CT imaging.
Footnotes
Publisher's Disclaimer: This is a PDF file of an unedited manuscript that has been accepted for publication. As a service to our customers we are providing this early version of the manuscript. The manuscript will undergo copyediting, typesetting, and review of the resulting proof before it is published in its final citable form. Please note that during the production process errors may be discovered which could affect the content, and all legal disclaimers that apply to the journal pertain.
Conflicts of Interest
The authors have no conflicts to disclose.
References
- Amin S, Kopperdhal DL, Melton LJ, 3rd, Achenbach SJ, Therneau TM, Riggs BL, Keaveny TM, Khosla S. Association of hip strength estimates by finite-element analysis with fractures in women and men. J Bone Miner Res. 2011 Jul;26(7):1593–600. doi: 10.1002/jbmr.347. [DOI] [PMC free article] [PubMed] [Google Scholar]
- Bessho M, Ohnishi I, Matsuyama J, Matsumoto T, Imai K, Nakamura K. Prediction of strength and strain of the proximal femur by a CT-based finite element method. J Biomech. 2007;40:1745–53. doi: 10.1016/j.jbiomech.2006.08.003. [DOI] [PubMed] [Google Scholar]
- Bessho M, Ohnishi I, Matsumoto T, Ohashi S, Matsuyama J, Tobita K, et al. Predication of proximal femur strength using a CT-based nonlinear finite element method: Differences in predicated fracture load and site with changing load and boundary conditions. Bone. 2009;45:226–31. doi: 10.1016/j.bone.2009.04.241. [DOI] [PubMed] [Google Scholar]
- Center JR, Nguyen TV, Schneider D, Sambrook PN, Eisman JA. Mortality after all major types of osteoporotic fracture in men and women: an observational study. Lancet. 1999 Mar 13;353(9156):878–82. doi: 10.1016/S0140-6736(98)09075-8. [DOI] [PubMed] [Google Scholar]
- Cody DD, Gross GJ, Hou FJ, Spencer HJ, Goldstein SA, Fyhrie DP. Femoral strength is better predicted by finite element models than QCT and DXA. J Biomech. 1999 Oct;32(10):1013–20. doi: 10.1016/s0021-9290(99)00099-8. [DOI] [PubMed] [Google Scholar]
- Cong A, Buijs JO, Dragomir-Daescu D. In situ parameter identification of optimal density-elastic modulus relationships in subject-specific finite element models of the proximal femur. Medical Engineering & Physics. 2011 Mar;33(2):164–173. doi: 10.1016/j.medengphy.2010.09.018. [DOI] [PMC free article] [PubMed] [Google Scholar]
- Courtney AC, Wachtel EF, Myers ER, Hayes WC. Age-related reductions in the strength of the femur tested in a fall-loading configuration. J Bone Joint Surg Am. 1995 Mar;77(3):387–95. doi: 10.2106/00004623-199503000-00008. [DOI] [PubMed] [Google Scholar]
- de Bakker PM, Manske SL, Ebacher V, Oxland TR, Cripton PA, Guy P. During sideways falls proximal femur fractures initiate in the superolateral cortex: evidence from high-speed video of simulated fractures. J Biomech. 2009 Aug 25;42(12):1917–25. doi: 10.1016/j.jbiomech.2009.05.001. [DOI] [PubMed] [Google Scholar]
- Dragomir-Daescu D, Op Den Buijs J, McEligot S, Dai Y, Entwistle RC, Salas C, et al. Robust QCT/FEA models of proximal femur stiffness and fracture load during a sideways fall on the hip. Ann Biomed Eng. 2011;39(2):742–55. doi: 10.1007/s10439-010-0196-y. [DOI] [PMC free article] [PubMed] [Google Scholar]
- Duchemin L, Bousson V, Raossanaly C, Bergot C, Laredo JD, Skalli W, et al. Prediction of mechanical properties of cortical bone by quantitative computed tomography. Med Eng Phys. 2008;30:321–28. doi: 10.1016/j.medengphy.2007.04.008. [DOI] [PubMed] [Google Scholar]
- Genant HK, Gordon C, Jiang Y, Lang TF, Link TM, Majumdar S. Advanced imaging of bone macro and micro structure. Bone. 1999;25:149–52. doi: 10.1016/s8756-3282(99)00109-x. [DOI] [PubMed] [Google Scholar]
- Jang KJ, Kweon DC, Lee J, Choi J, Goo E, Dong K, Lee J, Jin GH, Seo S. Measurement of image quality in CT images reconstructed with different kernels. J Korean Phys Soc. 2011;58(2):334–42. [Google Scholar]
- Kanis JA, Johnell O, DeLaet C, Johansson H, Oden A, Delmas P, et al. A meta-analysis of previous fracture and subsequent fracture risk. Bone. 2004;35:375–82. doi: 10.1016/j.bone.2004.03.024. [DOI] [PubMed] [Google Scholar]
- Keaveny TM. Biomechanical computed tomography-noninvasive bone strength analysis using clinical computed tomography scans. Ann N Y Acad Sci. 2010 Mar;1192:57–65. doi: 10.1111/j.1749-6632.2009.05348.x. Review. [DOI] [PubMed] [Google Scholar]
- Keaveny TM, Kopperdahl DL, Melton LJ, 3rd, Hoffmann PF, Amin S, Riggs BL, Khosla S. Age-dependence of femoral strength in white women and men. J Bone Miner Res. 2010 May;25(5):994–1001. doi: 10.1359/jbmr.091033. [DOI] [PMC free article] [PubMed] [Google Scholar]
- Keaveny TM, McClung MR, Wan X, Kopperdahl DL, Mitlak BH, Krohn K. Femoral strength in osteoporotic women treated with teriparatide or alendronate. Bone. 2012 Jan;50(1):165–70. doi: 10.1016/j.bone.2011.10.002. [DOI] [PubMed] [Google Scholar]
- Keyak JH. Improved prediction of proximal femur fracture load using nonlinear finite element models. Med Eng Phys. 2001;23:165–73. doi: 10.1016/s1350-4533(01)00045-5. [DOI] [PubMed] [Google Scholar]
- Keyak JH, Rossi SA, Jones KA, Les CM, Skinner HB. Prediction of fracture location in the proximal femur using finite element models. Med Eng Phys. 2001;23:657–64. doi: 10.1016/s1350-4533(01)00094-7. [DOI] [PubMed] [Google Scholar]
- Keyak JH, Kaneko TS, Tehranzadeh J, Skinner HB. Predicting proximal femoral strength using structural engineering models. Clin Orthop Rel Res. 2005;437:219–28. doi: 10.1097/01.blo.0000164400.37905.22. [DOI] [PubMed] [Google Scholar]
- Keyak JH, Sigurdsson S, Karlsdottir G, Oskarsdottir D, Sigmarsdottir A, Zhao S, Kornak J, Harris TB, Sigurdsson G, Jonsson BY, Siggeirsdottir K, Eiriksdottir G, Gudnason V, Lang TF. Male-female differences in the association between incident hip fracture and proximal femoral strength: a finite element analysis study. Bone. 2011 Jun 1;48(6):1239–45. doi: 10.1016/j.bone.2011.03.682. [DOI] [PMC free article] [PubMed] [Google Scholar]
- Morgan EF, Bayraktar HH, Keaveny TM. Trabecular bone modulus-density relationships depend on anatomic site. J Biomech. 2003 Jul;36(7):897–904. doi: 10.1016/s0021-9290(03)00071-x. [DOI] [PubMed] [Google Scholar]
- Morin S, Lix LM, Azimaee M, Metge C, Caetano P, Leslie WD. Mortality rates after incident non-traumatic fractures in older men and women. Osteoporos Int. 2011 Sep;22(9):2439–48. doi: 10.1007/s00198-010-1480-2. [DOI] [PubMed] [Google Scholar]
- Orwoll ES, Marshall LM, Nielson CM, Cummings SR, Lapidus J, Cauley JA, Ensrud K, Lane N, Hoffmann PR, Kopperdahl DL, Keaveny TM, Osteoporotic Fractures in Men Study Group Finite element analysis of the proximal femur and hip fracture risk in older men. J Bone Miner Res. 2009 Mar;24(3):475–83. doi: 10.1359/JBMR.081201. [DOI] [PMC free article] [PubMed] [Google Scholar]
- Paul J, Krauss B, Banckwitz R, Maentele W, Bauer RW, Vogl TJ. Relationships of clinical protocols and reconstruction kernels with image quality and radiation dose in a 128-slice CT scanner: Study with an anthropomorphic and water phantom. Eur J Radiol. 2012 May;81(5):e699–703. doi: 10.1016/j.ejrad.2011.01.078. [DOI] [PubMed] [Google Scholar]
- Roberts BJ, Thrall E, Muller JA, Bouxsein ML. Comparison of hip fracture risk prediction by femoral aBMD to experimentally measured factor of risk. Bone. 2010 Mar;46(3):742–6. doi: 10.1016/j.bone.2009.10.020. [DOI] [PubMed] [Google Scholar]
- Schileo E, Dall’Ara E, Taddei F, Malandrino A, Schotkamp T, Baleani M, et al. An accurate estimation of bone density improves the accuracy of subject-specific finite element models. J Biomech. 2008;41:2483–91. doi: 10.1016/j.jbiomech.2008.05.017. [DOI] [PubMed] [Google Scholar]
- Schileo E, Taddei F, Cristofolini L, Viceconti M. Subject-specific finite element models implementing a maximum principal strain criterion are able to estimate failure risk and fracture location on human femurs tested in vitro. J Biomech. 2008;41:356–67. doi: 10.1016/j.jbiomech.2007.09.009. [DOI] [PubMed] [Google Scholar]
- Taddei F, Cristofolini L, Martelli S, Gill HS, Viceconti M. Subject-specific finite element models of long bones: An in vitro evaluation of the overall accuracy. J Biomech. 2006;39:2457–67. doi: 10.1016/j.jbiomech.2005.07.018. [DOI] [PubMed] [Google Scholar]
- Taddei F, Schileo E, Helgason B, Cristofolini L, Viceconti M. The material mapping strategy influences the accuracy of CT-based finite element models of bones: An evaluation against experimental measurements. Med Eng Phys. 2007;29:973–79. doi: 10.1016/j.medengphy.2006.10.014. [DOI] [PubMed] [Google Scholar]
- Tanck E, van Aken JB, van der Linden YM, Schreuder HWB, Binkowski M, Huizenga H, et al. Pathological fracture prediction in patients with metastatic lesions can be improved with quantitative computed tomography based computer models. Bone. 2009;45:777–83. doi: 10.1016/j.bone.2009.06.009. [DOI] [PubMed] [Google Scholar]
- Viceconti M, Davinelli M, Taddei F, Cappello A. Automatic generation of accurate subject-specific bone finite element models to be used in clinical studies. J Biomech. 2004;37:1597–1605. doi: 10.1016/j.jbiomech.2003.12.030. [DOI] [PubMed] [Google Scholar]
- Viceconti M, Bellingeri L, Cristofolini L, Toni A. A comparative study on different methods of automatic mesh generation of human femurs. Med Eng Phys. 1998 Jan;20(1):1–10. doi: 10.1016/s1350-4533(97)00049-0. Erratum in: Med Eng Phys. 2000 Jun;22(5):379–80. [DOI] [PubMed] [Google Scholar]


