

Summary
Absorption of light by visual pigments initiates the phototransduction pathway that results in degradation of the intracellular pool of cyclic–GMP (cGMP). This hydrolysis promotes the closing of cGMP–gated cation channels and consequent hyperpolarization of rod and cone photoreceptor cell membranes. Guanylate Cyclase Activating Proteins (GCAPs) are a family of proteins that regulate retinal guanylate cyclase (GC) activity in a Ca2+–dependent manner. At high [Ca2+], typical of the dark–adapted state (~500 nM), GCAPs inhibit retinal GCs. At the low [Ca2+] (~50 nM) that occur after the closing of cGMP-gated channels, GCAPs activate retinal GCs to replenish dark–state cGMP levels. Here, we report the crystal structure of unmyristoylated human GCAP3 with Ca2+ bound. GCAP3 is an EF–hand Ca2+–binding protein with Ca2+ bound to EF2, 3 and 4, while Ca2+ binding to EF–hand 1 is disabled. GCAP3 contains two domains with the EF–hand motifs arranged in a tandem array similar to GCAP2 and members of the recoverin subfamily of Ca2+–binding proteins. Residues not involved in Ca2+ binding, but conserved in all GCAPs, cluster around EF1 in the N–terminal domain and may represent the interface with GCs. Five point mutations in the closely related GCAP1 have been linked to the etiology of cone dystrophies. These residues are conserved in GCAP3 and the structure suggests important roles for these amino acids. We present a homology model of GCAP1 based on GCAP3 that offers insight into the molecular mechanism underlying the autosomal dominant cone dystrophies produced by GCAP1 mutations.
Introduction
Absorption of light by the retina initiates the phototransduction pathway, a cascade of events that culminates in an electrical signal being sent to the brain. Phototransduction is a complex pathway tightly regulated at several levels (for a review see 1). Briefly, the pathway is initiated with visual pigment activation when a photon is absorbed by the 11–cis–retinal chromophore covalently linked to rhodopsin. Rhodopsin and cone pigments activation initiates a cascade of events that leads to the activation of a phosphodiesterase that degrades cGMP. The drop in cGMP concentration results in the closure of cGMP–gated cation channels and a drop in intracellular [Ca2+]. This change in [Ca2+] is sensed by Ca2+–binding proteins that trigger the mechanisms of the “recovery phase” in which the photoreceptor recovers its initial “dark” potential. One of these mechanisms is the Ca2+–dependent activation of the guanylate cyclase (GC) which replenishes the pool of cGMP to its “dark–state” level.
Changes in the concentration of cGMP link light detection to synaptic signaling. Therefore, its turnover needs to be tightly regulated 2. The appropriate level of cGMP in photoreceptors is controlled by two opposing activities: a phosphodiesterase (PDE), which hydrolyzes cGMP, and GC, which synthesizes cGMP. PDE is activated through visual pigment–G protein mediated signaling, while GCs (GC–E and GC–F) are activated in low [Ca2+] conditions that follow the closure of the cation channels, to promote the recovery of the photoreceptor's dark potential 3. Ca2+ does not regulate the activity of GCs directly. A specific family of Ca2+–binding proteins termed Guanylate Cyclase Activating Proteins (GCAPs) mediate the regulation 3; 4. These are N–terminally acylated proteins containing EF–hand motifs for Ca2+ binding.
Three homologous isoforms of GCAP have been described in humans (GCAP1, 2 and 3). All three GCAPs regulate GCs in a Ca2+–dependent manner 5; 6; 7; 8; 9; 10. The proper regulation of GC activity by GCAPs is necessary not only for efficient phototransduction but also for photoreceptor viability 11. A number of retinal dystrophies are associated with mutations in GC1 or GCAP1. Loss of GC1 function due to mis–sense mutations is the cause of Leber's Congenital Amaurosis which leads to retinal degeneration with severe visual impairment 12. Other mutations in GC1 have been associated with a variety of cone–rod dystrophies 13; 14. They are characterized by the initial loss of cone function with loss of central vision, visual acuity, and color discrimination, followed by rod degeneration. To date, no human disease associated with GC2 has been reported.
Point mutations in GCAP1 are also responsible for dominant cone or cone–rod dystrophies 15; 16; 17; 18; 19; 20. These mutations impair the regulatory function of GCAP1 and result in constitutive activation of GCs leading to retinal degeneration 21; 22. A mutation of Tyr99 (Y99C) in GCAP1 leads to a constitutively activated GC that synthesizes cGMP at all [Ca2+]. This results in a well characterized dominant cone dystrophy with partial or total loss of central field vision 11; 18. Another GCAP1 mutation, I143NT, was recently shown to cause autosomal dominant cone degeneration 16. However, the molecular mechanisms for the loss of function caused by Y99C, I143NT, and other mutations remain unclear.
GCAP3 is more closely related to GCAP1 (47% identity) than to GCAP2 (35% identity) and it regulates GC1 with a [Ca2+] profile similar to that of GCAP1 6; 10. Here, we present the crystal structure of unmyristoylated GCAP3 with three Ca2+ ions bound, and analyze it in comparison to other Ca2+–binding proteins. A model of GCAP1 derived from GCAP3 reveals new insight into how mutations in GCAP1 cause structural perturbations that lead to dominant cone dystrophies.
Results and Discussion
GCAP3 Structure Determination and Overall Architecture
Initial crystallization screening for Ca2+–saturated, unmyristoylated GCAP3 was carried out by vapor diffusion using commercial, as well as laboratory developed sparse matrices. Conditions producing showers of needle–like crystals were identified and their refinement yielded small single crystals amenable to data collection. The crystals belonged to the tetragonal space group P43 with two protomers per asymmetric unit, and diffracted to 3.0 Å at a synchrotron source. We attempted to solve the GCAP3 structure by molecular replacement using several Ca2+–binding proteins as search models. In spite of all these proteins sharing 42–61% sequence similarities with GCAP3, no molecular replacement solution could be unambiguously identified. Crystals of Se–Met substituted protein diffracting to 3.3Å resolution were then used in a MAD experiment to obtain experimental phases. Data collection and phasing statistics are shown in Supplemental Table 1. The MAD phased electron density map was readily interpretable in spite of the relatively modest resolution. A model for the two GCAP3 molecules contained in the crystallographic asymmetric unit was built and finally refined to 3.0 Å resolution using native data. The refinement statistics are summarized in Supplemental Table 1. The two GCAP3 molecules in the crystallographic asymmetric unit are essentially identical, superimposing with an RMS deviation of 0.072 Å. In both molecules, and in spite of different packing contacts, 19 amino acids from the N–terminus and 24 from the C– terminus could not be traced, presumably due to conformational flexibility. It is worth noting that both protein ends were easily proteolyzed in the Ca2+–bound form of the closely related GCAP1 23, suggesting inherent conformational flexibility in GCAPs.
GCAP3 belongs to the EF–hand superfamily of Ca2+–binding proteins, of which calmodulin is the best–studied member 24; 25. As in calmodulin, GCAP3 arranges its four EF–hand motifs into two domains. EF1 (aa 21–43) and EF2 (aa 53–82) form the N–terminal domain, which is connected by a linker to a C–terminal domain containing EF3 (aa 90–122) and EF4 (aa 131–159) (Figure 1). A kinked helix at the C–terminus (aa 162–185, colored green in Figure 1) also ties the two domains together in GCAP3. The structures of the C–terminal domains of calmodulin and GCAP3 superimpose well, with an RMS deviation of 1.26 Å (Figure 1B). However, the relative arrangement of the two domains is quite different. While calmodulin adopts a dumbbell shape, GCAP3 has a compact structure with all four EF–hand motifs in a tandem array (Figure 1A). This compact arrangement is typical of recoverin and other Ca2+–binding proteins in the “recoverin branch” of the EF–hand superfamily.
Figure 1. Crystal Structure of GCAP3.
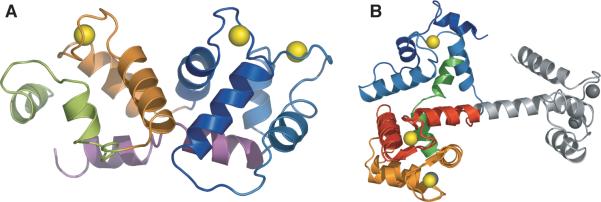
(A) Ribbon diagram of GCAP3. The segments of polypeptide containing the four EF–hands are colored as follows: EF–hand 1 is deep blue (amino acids 21–47), EF–hand 2 is light blue (amino acids 48–87), EF–hand 3 is red (amino acids 88–125), EF–hand 4 is orange (amino acids 126–161); the C–terminal helix is colored green (amino acids 162–185). (B) Superposition of GCAP3 and calmodulin based on EF–hands 3 and 4. The color scheme is the same as in A, with the N–terminal domain of calmodulin colored grey. All figures were prepared using Pymol 55
The crystal structure of GCAP3 shows three EF–hand motifs with Ca2+–bound while, as expected for a GCAP family member, Ca2+ binding to EF1 is disabled as observed in the NMR structure of GCAP2 26. The loop connecting the two helices in EF1 is one amino acid shorter than the canonical EF loop and also contains a Pro residue (Pro30 in GCAP3) that restricts the loop conformation. At the amino acid sequence level, EF1 is missing three of the Ca2+ coordinating side chains.
Comparison of GCAP3 to other Ca2+–Binding Proteins (CBPs)
The structures of several members of the “recoverin branch” of EF–hand superfamily have been solved. These include the NMR structure of GCAP2 26 and the crystal structures of recoverin 27, neurocalcin 28, frequenin 29, calcineurin 30 and the Ca2+–and–Integrin–Binding protein (CIB) 31. These proteins display remarkable structural similarity in spite of a relatively modest, 42–61% sequence similarity (all sequence alignments were calculated using the BLOSUM62 substitution matrix). The conformation of the EF– hand motifs is well conserved as illustrated by the similar interhelical angles observed in each of the EF–hands (Table 1). In addition, both the topology and arrangement of the N and C–terminal domains is also conserved as shown by the overall structural superposition shown in Figure 2A. Superimposing the structures based on the C–terminal domain highlights the main structural difference among these proteins: the relative orientation of the N– and C–terminal domain (Figure 2B).
Table 1.
Crystallographic Data and Refinement Statistics
| A. Data Collectiona | ||||||
|---|---|---|---|---|---|---|
| Wavelength (Å) | Resolution (Å) | % Complete | Rsymb | % I/σ > 3 | Redundancy | |
| MAD Phasing | 0.9795 (peak) | 25 – 3.25 | 93.8 (97.1) | 0.074 (0.323) | 72.4 (36.2) | 1.9 (1.9) |
| 0.9797 (edge) | 25 – 3.25 | 94.2 (96.9) | 0.072 (0.319) | 73.1 (37.7) | 1.9 (1.9) | |
| 0.9643 (remote) | 25 – 3.25 | 94.2 (97.1) | 0.073 (0.315) | 73.1 (38.5) | 1.9 (1.9) | |
| B. Refinement | ||||||
|---|---|---|---|---|---|---|
| Data | Wavelength (Å) | Resolution (Å) | % Complete | Rsym | % I/σ > 3 | Redundancy |
| 1.000 | 25-3.0 (3.11-3.00) | 94.4 (96.1) | 0.057 (0.351) | 80.3 (46.5) | 6.8 (6.7) | |
| Model | Rcrystc | Rfree | Protein atoms | Average B | Rmsd bonds (Å) | Rmsd Angles (°) |
| 0.256 | 0.292 | 2606 | 69 | 0.009 | 1.56 | |
Values in parentheses are for the highest resolution shell: 2.59-2.50 Å for the MAD phasing data sets.
Rsym=ΣhΣi |(Ii(h)-< I(h)>|/ ΣhΣi Ii(h), where Ii(h) is the I-th measurement of reflection h, and <I(h)> is the weighted mean of all measurements of h. Bijvoet measurements were treated as independent reflections for the MAD phasing data sets.
Rcryst = Σ|Fobs-Fcalc|/ΣFobs where Fobs = observed structure factor amplitude and Fcalc = structure factor calculated from model. Rfree is computed in the same manner as Rcryst, using the test set of reflections.
Figure 2. Structural Superposition of Ca2+–Binding Proteins.

(A) Overall superposition of the Ca2+–bound forms of GCAP3, GCAP2, recoverin, neurocalcin, calcineurin, Ca2+–integrin–binding protein, and frequenin. Secondary structure elements are color–ramped from blue (N–terminus) to red (C–terminus). (B) Same proteins described in (A) but superimposed on EF–hands 3 and 4, highlighting the change in the relative orientation between the N– and C–terminal domains. (C and D) GCAP3 (dark blue) superimposed on recoverin (N–terminus: magenta, C–terminus light blue) in its Ca2+–bound form (C) and Ca2+–free form (D). The superposition is based on the C–terminal EF–hands 3 and 4 and highlights the change in relative orientation of the N and C–terminal domains that occurs in recovering upon Ca2+ binding. Ca2+ ions are gray (GCAP3) or violet (recoverin)
A change in the relative orientations of the N and C–terminal domains is also thought to be part of the conformational change triggered by Ca2+ binding to these proteins. In the case of recoverin, direct evidence is available, as the structure has been solved in both Ca2+ bound and Ca2+–free forms 32; 33 (Figure 2C–D). The structure of the EF–hand motifs is not significantly different in the two states but the relative orientation of the two domains changes dramatically.
Proteins in the “recoverin branch” of CBPs, including GCAPs, are N–terminally modified with fatty acid groups (reviewed in ref 3). It has been shown for recoverin that the structural transition triggered by Ca2+ binding changes the location and accessibility of the N–terminal lipid 33. In the Ca2+–free state, the myristoyl group is sequestered into a hydrophobic cleft and hidden from the solvent. Upon Ca2+ binding, the myristoyl moiety is extruded out of the binding pocket and exposed. This phenomenon has been termed the “Ca2+–myristoyl switch” and it allows recoverin to be recruited to the membrane in the Ca2+–bound state, which is crucial for the physiological role of recoverin 33. GCAPs are also N–terminally acylated with long–chain fatty acids 34; 35, and many of the amino acid residues that form the hydrophobic pocket where the myristoyl group is sequestered in recoverin are conserved in GCAPs. However, two Phe residues in a loop at the bottom of the binding pocket that interact with the end of the myristoyl moiety (C11–C14) are not conserved in GCAPs. Those positions are filled by variable, more hydrophilic amino acids in GCAPs such as Gln56 and Gly57 in GCAP3. While GCAPs may still have a change in myristoyl exposure upon Ca2+ binding, the lipid does not appear to be strictly required for GCAP activity and regulation. While non–myristoylated GCAP1 can regulate GC activity in response to Ca2+ with a slightly different Ca2+ sensitivity 36; 37, myristoylation of GCAP2 had no significant effect in its ability to regulate GC activity 36; 37; 38.
Most CBPs carry out their biological function by binding to an effector protein in a Ca2+–dependent manner 25. Typically, the conformational change induced by Ca2+, presents a different set of surface residues in each state and affords effector–binding capacity to only one of the states. For example, when calmodulin is in the Ca2+–bound conformation it is able to bind and activate or inhibit its effectors, while the Ca2+–free form is not capable of effector binding. In contrast, GCAPs bind and regulate their GC effector in both the Ca2+–bound and Ca2+–free conformations 4. When [Ca2+] is high in the dark– adapted photoreceptor, the Ca2+–bound forms of GCAPs inhibit GC. The drop in [Ca2+] that follows a light detection event promotes a switch to the Ca2+–free form of GCAP that activates the GCs. Thus, GCAPs are thought to bind GCs at all times with the Ca2+ induced conformational change in GCAP being transmitted to GC to promote its activation or inhibition. An alternative model has also been proposed, in which dimerization of GCAPs is central to the GC regulation mechanism 39; 40; 41.
GCAP1, 2 and 3 can all activate GC1 and GC2, often across species boundaries. For example, zebrafish GCAPs can regulate bovine GCs 6. In addition, the Guanylate Cyclase Inhibitory Protein (GCIP), a GCAP related protein of the frog retina, is able to inhibit bovine GC in the Ca2+–bound form 42. We therefore mapped the conserved residues among GCIP and GCAP isoforms from different species onto the surface of GCAP3 to search for clusters that might mediate GC binding. As shown in Figure 3, the conserved residues cluster along an extended surface but only on one face of GCAP3. Many strictly conserved residues in GCAPs are part of the EF–hand motif, are involved in Ca2+ binding, and are unlikely to mediate protein–protein interactions. Excluding those EF–hand residues (cyan in Figure 3) from the analysis reveals that most strictly conserved and highly conserved residues cluster around the N–terminal EF–hand 1, suggesting that it might be involved in the GCAP–GC interface. This is in agreement with previous biochemical studies showing that (i) mutations in the EF–hand 1 of GCAP2 affect its interaction with GC 43, and (ii) the N–terminal domain of GCAP1 is crucial for its activity and that a peptide derived from its N–terminus is a potent inhibitor of GC activation by GCAP 34; 35.
Figure 3. Surface residue conservation in GCAPs.

Residues conserved among GCAPs and GCIP (see text) were mapped onto the surface of GCAP3. Strictly conserved residues that do not participate in Ca2+ coordination (non–EF–hand) are colored deep blue. Highly conserved residues are colored medium blue. Conserved EF–hand residues are colored cyan. (A) Side view with the N–terminal domain up and the C–terminus down (a cartoon representation of GCAP3 colored as in Figure 1 is shown for); (B) Side view rotated 180° with respect to (A); (C) Top view rotated 90° with respect to (A) shows the N–terminal domain of GCAP3; (D) Bottom view, rotated 180° with respect to (C) showing the C– terminal domain.
A homology model of GCAP1 based on GCAP3
Of the three isoforms of GCAP present in humans (GCAP1, 2 and 3), only mutations in GCAP1 have been associated with retinal disease 4. Five independent single amino acid mutations in GCAP1, Y99C, E155G, I143NT, L151F and P50L are linked to cone dystrophies 15; 16; 17; 18; 19; 20. The structure of human GCAP3 presented here represents the closest available relative to human GCAP1 (47% identity, 71% similarity). Using the program MODELLER44 and our GCAP3 structure, we generated a homology model of GCAP1 to aid in the identification of the molecular basis for GCAP1 malfunction in these mutations.
In this GCAP1, three of the mutations are clustered around the EF4 Ca2+ binding loop (Figure 4A). The residue E155 directly coordinates the Ca2+ ion and its replacement with Gly would interfere with Ca2+ binding as suggested previously. The side chains of Leu151 and Ile143 lie in a hydrophobic pocket that stabilizes the structure of the loop and helices that make up EF4. We speculate that the introduction of hydrogen–bonding capable residues such as Asn or Thr at position 143 (I143NT) may destabilize the hydrophobic core of EF4. The case of the L151F mutation is more difficult to rationalize as it replaces a hydrophobic residue for a hydrophobic aromatic. We notice, however, that the L151F substitution might promote ring–stacking interactions with Phe140 and Phe156 that may constrain the conformation of the EF4 Ca2+–binding loop.
Figure 4. GCAP1 model based on the crystal structure of GCAP3.

(A) Cartoon representation of the GCAP1 model. Residues mutated in forms of GCAP1 associated with human cone dystrophies, and shown to impair GCAP1 function in vitro are colored in green (Tyr99, Ile143, Leu151, Glu155). Residue Pro50 whose mutation to Leu appears to reduce GCAP1 stability is shown in pale yellow. (B) Close up of residues around residue Tyr99 showing the hydrogen bonding interaction with Ser173 from the kinked C– terminal helix (colored pale orange). (C) Close up of the Ca2+–binding loops of EF–hand 3 and 4 highlighting the Ca2+–coordinating function of Glu155 and the hydrophobic pocket that accommodates residues Ile143 and Leu151.
Residue Tyr99 is in EF3 and its mutation to a Cys does not interfere with the ability of mutant GCAP1 to activate GC at low [Ca2+]. Instead, it prevents Ca2+–bound GCAP1 from inhibiting GC thus making GC constitutively active under all physiological [Ca2+]. In both the GCAP3 structure and our GCAP1 model, Tyr99 hydrogen bonds to a serine in the C–terminal helix (Ser173, Figure 4B). The hydrogen bond network may also involve Tyr55 (Figure 4B). The Y99C mutation would disrupt this network and may destabilize the specific inter–domain orientation observed in the Ca2+–bound form of GCAP3 thus accounting for the inability of Y99C GCAP1 to inhibit GCs at high [Ca2+]. The hydrogen bonding interactions described above are not observed in the NMR structure of GCAP2, and may explain why the corresponding mutant Y104C in GCAP2 failed to reproduce the phenotype observed in Y99C GCAP1.
The P50L mutation does not change the Ca2+ sensitivity of GCAP1 or its ability to regulate GC making recombinant GCAP1 (P50L) indistinguishable from the wild type 45; 46. Instead, the mutation appears to alter the folding stability as it makes the mutant more susceptible to proteolysis 45; 46. In our GCAP1 model, Pro50 is part of the N–cap of the EF2 helix (Figure 4A). The substitution for Leu with its high helix propensity may favor the formation of a longer helix that would destabilize the packing between EF1 and EF2 increasing its protease sensitivity 45.
In summary, we have determined the three–dimensional structure of Ca2+–bound, unmyristoylated GCAP3 and identified a potential interaction interface with GC. By comparison with other Ca2+–binding proteins, we favor a model in which Ca2+–binding to GCAPs induces a change in the relative orientation of the N– and C–terminal domains and this conformational change is propagated to the GC to regulate its activity. These data are consistent with previous biophysical/biochemical studies of GCAP1 analyzed by chemical modification as well as fluorescence and EPR spectroscopies 47; 48. Finally, the analysis of a homology model of GCAP1 based on the crystal structure of GCAP3 suggests a molecular mechanism for a series of GCAP1 mutations that cause cone dystrophies and lead to severe loss of vision.
Materials and Methods
Cloning Expression and Purification
The human GCAP3 was subcloned from a pFastBac vector 10 into pMS122 (a modified pET41b vector with a His–tag cleavable by the tobacco etch virus (TEV) protease) using NdeI and SacI restriction sites. The resulting expression plasmid (pMS255) was used to transform Rosetta(DE3) cells (Novagen) grown in 6L LB media supplemented with 50 µg kanamycin. When the culture reached an optical density of 0.6, the cells were cooled to room temperature and protein expression was induced with 0.5 mM IPTG. After an overnight incubation at room temperature, cells were spun down (7,000 RPM 15 min). The pellets were resuspended in lysis buffer (50 mM NaH2PO4, pH 8.0, containing 300 mM NaCl, 5 mM ß–mercaptoethanol (BME) and 10 mM imidazole), frozen at –80 °C and then thawed and sonicated. Cell debris was removed by centrifugation at 19,000 rpm for 15 min and the supernatant was applied to a 20 mL Ni–NTA column equilibrated in lysis buffer. The Ni–NTA column was washed with 3 column volumes of wash buffer (50 mM NaH2PO4, pH 8.0, containing 300 mM NaCl, 5 mM BME, 25 mM imidazole) and the protein eluted with 4 column volumes of elution buffer (50 mM NaH2PO4, pH 8.0, containing 300 mM NaCl, 5 mM BME, 250 mM imidazole). The GCAP3 containing fractions were pooled and supplemented with 10 mM DTT and incubated with His–tagged TEV protease 49 at 4 °C for 48–74 hr. The preparation was then dialyzed into lysis buffer and reapplied to the Ni–NTA column to remove the cleaved tag, TEV protease, and any uncleaved hGCAP3. The flow through fraction containing purified GCAP3 was applied to a HiLoad 26/60 Superdex 200 size exclusion column (Amersham Pharmacia Biotech), equilibrated in 20 mM Tris–Cl, pH 8.0, 5 mM BME, and 150 mM NaCl. Fractions containing GCAP3 were dialyzed into 20 mM Tris–Cl, pH 8.0, containing 5 mM BME and concentrated to 5–10 mg/mL.
For the preparation of SeMet substituted GCAP3, cells transformed with the pMS255 plasmid were grown in 2 L of minimal media consisting of M9 salts, 2mM MgSO4, 0.1mM CaCl2, 0.4% glucose, and 50 μg/ml kanamycin to OD600 ~0.6. Cultures were then supplemented with 100 μg/ml D–lys, D–Phe, D–Thr, 50μg/ml D–Ile, D–Val, and 60 μg/ml SeMet and grown for an additional 20 minutes before addition of 0.5mM IPTG to induce protein expression. After an overnight incubation at room temperature, the cells were harvested and SeMet substituted GCAP3 purified as described above.
Crystallization and Structure Determination
Crystals were grown using the hanging drop method at 16 °C (protein/precipitant, 1.5 μL:1.5 μL). Native crystals were grown in 0.1 M MES 6.5; 5% PEG 6000; 5% MPD. Se–Met crystals were grown in 0.1 M HEPES 7.0; 5% PEG 6000; 5% MPD. Crystals grew within 5–15 days with dimensions up to 30 × 30 × 200 μm. Before data collection, the crystals were transferred to solutions of mother liquor supplemented with 5% increments of ethylene glycol to a final concentration of 30% and flash frozen in a nitrogen stream at 100 °K. The GCAP3 structure was solved using a 3 wavelength MAD data set to 3.3 Å resolution collected at beamline 8.2.1 of the Advanced Light Source (Lawrence Berkeley National Laboratory) using a Quantum–4 CCD detector (Area Detector Systems Corporation). The refinement was carried out with native data to 3.0 Å resolution collected under similar conditions. All crystallographic data was processed using the HKL program suite 50. The crystals belonged to space group p43 with unit cell dimensions a=b=88.12 Å, c= 71.02 and two GCAP3 molecules. Anomalous Patterson maps were calculated with the program Solve 51; 52 using data collected at the peak absorption wavelength for Se. The automated Patterson search routine of Solve identified 12 of 18 possible Se–Met sites. Phases were calculated from these sites using Solve, and further improved by solvent flipping and histogram matching as implemented in the program CNS 53. The resulting map allowed the modeling of several secondary structure elements and the identification of the non–crystallographic symmetry operation relating the two GCAP3 molecules in the asymmetric unit. The refinement of the model was carried out with native data to 3.0Å resolution using CNS. Iterative cycles of refinement and manual model building were performed with the program O 54 until no improvement in the crystallographic free R factor was observed. Data collection and refinement statistics are summarized in Supplemental Table 1.
Supplementary Material
Table 2.
Interhelical Angles in EF-Hand Motifs of Ca2+-Binding Proteins
| EF-hand 1 | EF-hand 2 | EF-hand 3 | EF-hand 4 | |
|---|---|---|---|---|
| Recoverin | (26-34, 48-56) 103.9° |
(62-72, 83-91) 127.1° |
(100-108, 118-131) 103.8° |
(148-158, 168-176) 102.9° |
| GCAP2 | (22-32, 44-49) 110.1° |
(58-68, 79-87) 108.7° |
(96-104, 114-127) 92.7° |
(147-157, 167-175) 98.8° |
| GCAP3 | (21-29, 38-43) 99.6° |
(53-63, 74-82) 103.1° |
(90-99, 109-122) 103.8° |
(131-141, 151-159) 109.7° |
| Neurocalcin | (25-34, 47-52) 100.2° |
(62-72, 83-91) 103.7° |
(100-108, 118-130) 100.3° |
(146-156, 166-174) 103.8° |
| Calcineurin | (17-26, 39-43) 100.2° |
(54-61, 72-80) 109.4° |
(90-98, 108-117) 94.1° |
(130-139, 149-156) 103.8° |
| Frequenin | (25-34, 47-52) 102.4° |
(62-72, 83-91) 102.9° |
(100-108, 118-130) 95.6° |
(146-156, 166-174) 102.1° |
| CIB | (17-26, 47-51) 101.0° |
(62-69, 81-89) 108.5° |
(99-107, 117-126) 93.9° |
(143-152, 162-167) 104.8° |
The interhelical angles for each EF-hand motif were calculated using the program interhlx (K. Yap, University of Toronto, http://nmr.uhnres.utoronto.ca/ikura/interhlx/). The numbers in parenthesis are the amino acid residue numbers defining the two helices in the EF-hands used in the calculation.
Acknowledgements
We would like to thank Dr. Slawomir Filipek for the preparation of initial figures. We are indebted to Gerry McDermott, Corie Ralston, James Holton and the staff at the ALS for assistance in collecting crystallographic data. This work is based upon research carried out at the Advanced Light Source, which is funded by the Department of Energy. Structural biology research at the University of Colorado at Boulder is supported in part by a grant from the William M Keck Foundation. This work was supported in part, by National Institutes of Health Grants EY08061 (to K.P.).
Abbreviations used
- GC
guanylate cyclase
- GCAP
guanylate cyclase–activating protein
- CBP
calcium–binding protein
- EF
EF–hand motif
Footnotes
Crystallographic data deposition: coordinates and structure factors for GCAP3 were deposited in the Protein Data Bank under accession number XXX.
Contributor Information
Ricardo Stephen, Department of Chemistry and Biochemistry University of Colorado at Boulder Boulder, CO 80309.
Krzysztof Palczewski, Department of Pharmacology Case Western Reserve University Cleveland, OH 44106, USA.
Marcelo C. Sousa, Department of Chemistry and Biochemistry University of Colorado at Boulder Boulder, CO 80309
References
- 1.Ridge KD, Abdulaev NG, Sousa M, Palczewski K. Phototransduction: crystal clear. Trends Biochem Sci. 2003;28:479–87. doi: 10.1016/S0968-0004(03)00172-5. [DOI] [PubMed] [Google Scholar]
- 2.Dizhoor AM. Regulation of cGMP synthesis in photoreceptors: role in signal transduction and congenital diseases of the retina. Cell Signal. 2000;12:711–9. doi: 10.1016/s0898-6568(00)00134-0. [DOI] [PubMed] [Google Scholar]
- 3.Polans A, Baehr W, Palczewski K. Turned on by Ca2+! The physiology and pathology of Ca(2+)-binding proteins in the retina. Trends Neurosci. 1996;19:547–54. doi: 10.1016/s0166-2236(96)10059-x. [DOI] [PubMed] [Google Scholar]
- 4.Palczewski K, Polans AS, Baehr W, Ames JB. Ca(2+)-binding proteins in the retina: structure, function, and the etiology of human visual diseases. Bioessays. 2000;22:337–50. doi: 10.1002/(SICI)1521-1878(200004)22:4<337::AID-BIES4>3.0.CO;2-Z. [DOI] [PubMed] [Google Scholar]
- 5.Imanishi Y, Yang L, Sokal I, Filipek S, Palczewski K, Baehr W. Diversity of guanylate cyclase-activating proteins (GCAPs) in teleost fish: characterization of three novel GCAPs (GCAP4, GCAP5, GCAP7) from zebrafish (Danio rerio) and prediction of eight GCAPs (GCAP1-8) in pufferfish (Fugu rubripes). J Mol Evol. 2004;59:204–17. doi: 10.1007/s00239-004-2614-y. [DOI] [PMC free article] [PubMed] [Google Scholar]
- 6.Imanishi Y, Li N, Sokal I, Sowa ME, Lichtarge O, Wensel TG, Saperstein DA, Baehr W, Palczewski K. Characterization of retinal guanylate cyclase-activating protein 3 (GCAP3) from zebrafish to man. Eur J Neurosci. 2002;15:63–78. doi: 10.1046/j.0953-816x.2001.01835.x. [DOI] [PMC free article] [PubMed] [Google Scholar]
- 7.Dizhoor AM, Olshevskaya EV, Henzel WJ, Wong SC, Stults JT, Ankoudinova I, Hurley JB. Cloning, sequencing, and expression of a 24-kDa Ca(2+)-binding protein activating photoreceptor guanylyl cyclase. J Biol Chem. 1995;270:25200–6. doi: 10.1074/jbc.270.42.25200. [DOI] [PubMed] [Google Scholar]
- 8.Gorczyca WA, Gray-Keller MP, Detwiler PB, Palczewski K. Purification and physiological evaluation of a guanylate cyclase activating protein from retinal rods. Proc Natl Acad Sci U S A. 1994;91:4014–8. doi: 10.1073/pnas.91.9.4014. [DOI] [PMC free article] [PubMed] [Google Scholar]
- 9.Gorczyca WA, Polans AS, Surgucheva IG, Subbaraya I, Baehr W, Palczewski K. Guanylyl cyclase activating protein. A calcium-sensitive regulator of phototransduction. J Biol Chem. 1995;270:22029–36. doi: 10.1074/jbc.270.37.22029. [DOI] [PubMed] [Google Scholar]
- 10.Haeseleer F, Sokal I, Li N, Pettenati M, Rao N, Bronson D, Wechter R, Baehr W, Palczewski K. Molecular characterization of a third member of the guanylyl cyclase-activating protein subfamily. J Biol Chem. 1999;274:6526–35. doi: 10.1074/jbc.274.10.6526. [DOI] [PubMed] [Google Scholar]
- 11.Newbold RJ, Deery EC, Payne AM, Wilkie SE, Hunt DM, Warren MJ. Guanylate cyclase activating proteins, guanylate cyclase and disease. Adv Exp Med Biol. 2002;514:411–38. doi: 10.1007/978-1-4615-0121-3_25. [DOI] [PubMed] [Google Scholar]
- 12.Perrault I, Rozet JM, Calvas P, Gerber S, Camuzat A, Dollfus H, Chatelin S, Souied E, Ghazi I, Leowski C, Bonnemaison M, Le Paslier D, Frezal J, Dufier JL, Pittler S, Munnich A, Kaplan J. Retinal-specific guanylate cyclase gene mutations in Leber's congenital amaurosis. Nat Genet. 1996;14:461–4. doi: 10.1038/ng1296-461. [DOI] [PubMed] [Google Scholar]
- 13.Perrault I, Rozet JM, Gerber S, Kelsell RE, Souied E, Cabot A, Hunt DM, Munnich A, Kaplan J. A retGC-1 mutation in autosomal dominant cone-rod dystrophy. Am J Hum Genet. 1998;63:651–4. doi: 10.1086/301985. [DOI] [PMC free article] [PubMed] [Google Scholar]
- 14.Kelsell RE, Gregory-Evans K, Payne AM, Perrault I, Kaplan J, Yang RB, Garbers DL, Bird AC, Moore AT, Hunt DM. Mutations in the retinal guanylate cyclase (RETGC-1) gene in dominant cone-rod dystrophy. Hum Mol Genet. 1998;7:1179–84. doi: 10.1093/hmg/7.7.1179. [DOI] [PubMed] [Google Scholar]
- 15.Jiang L, Katz BJ, Yang Z, Zhao Y, Faulkner N, Hu J, Baird J, Baehr W, Creel DJ, Zhang K. Autosomal dominant cone dystrophy caused by a novel mutation in the GCAP1 gene (GUCA1A). Mol Vis. 2005;11:143–51. [PubMed] [Google Scholar]
- 16.Nishiguchi KM, Sokal I, Yang L, Roychowdhury N, Palczewski K, Berson EL, Dryja TP, Baehr W. A novel mutation (I143NT) in guanylate cyclase-activating protein 1 (GCAP1) associated with autosomal dominant cone degeneration. Invest Ophthalmol Vis Sci. 2004;45:3863–70. doi: 10.1167/iovs.04-0590. [DOI] [PMC free article] [PubMed] [Google Scholar]
- 17.Sokal I, Dupps WJ, Grassi MA, Brown J, Jr., Affatigato LM, Roychowdhury N, Yang L, Filipek S, Palczewski K, Stone EM, Baehr W. A novel GCAP1 missense mutation (L151F) in a large family with autosomal dominant cone-rod dystrophy (adCORD). Invest Ophthalmol Vis Sci. 2005;46:1124–32. doi: 10.1167/iovs.04-1431. [DOI] [PMC free article] [PubMed] [Google Scholar]
- 18.Payne AM, Downes SM, Bessant DA, Taylor R, Holder GE, Warren MJ, Bird AC, Bhattacharya SS. A mutation in guanylate cyclase activator 1A (GUCA1A) in an autosomal dominant cone dystrophy pedigree mapping to a new locus on chromosome 6p21.1. Hum Mol Genet. 1998;7:273–7. doi: 10.1093/hmg/7.2.273. [DOI] [PubMed] [Google Scholar]
- 19.Downes SM, Holder GE, Fitzke FW, Payne AM, Warren MJ, Bhattacharya SS, Bird AC. Autosomal dominant cone and cone-rod dystrophy with mutations in the guanylate cyclase activator 1A gene-encoding guanylate cyclase activating protein-1. Arch Ophthalmol. 2001;119:96–105. [PubMed] [Google Scholar]
- 20.Wilkie SE, Li Y, Deery EC, Newbold RJ, Garibaldi D, Bateman JB, Zhang H, Lin W, Zack DJ, Bhattacharya SS, Warren MJ, Hunt DM, Zhang K. Identification and functional consequences of a new mutation (E155G) in the gene for GCAP1 that causes autosomal dominant cone dystrophy. Am J Hum Genet. 2001;69:471–80. doi: 10.1086/323265. [DOI] [PMC free article] [PubMed] [Google Scholar]
- 21.Sokal I, Li N, Surgucheva I, Warren MJ, Payne AM, Bhattacharya SS, Baehr W, Palczewski K. GCAP1 (Y99C) mutant is constitutively active in autosomal dominant cone dystrophy. Mol Cell. 1998;2:129–33. doi: 10.1016/s1097-2765(00)80121-5. [DOI] [PubMed] [Google Scholar]
- 22.Dizhoor AM, Boikov SG, Olshevskaya EV. Constitutive activation of photoreceptor guanylate cyclase by Y99C mutant of GCAP-1. Possible role in causing human autosomal dominant cone degeneration. J Biol Chem. 1998;273:17311–4. doi: 10.1074/jbc.273.28.17311. [DOI] [PubMed] [Google Scholar]
- 23.Rudnicka-Nawrot M, Surgucheva I, Hulmes JD, Haeseleer F, Sokal I, Crabb JW, Baehr W, Palczewski K. Changes in biological activity and folding of guanylate cyclase-activating protein 1 as a function of calcium. Biochemistry. 1998;37:248–57. doi: 10.1021/bi972306x. [DOI] [PubMed] [Google Scholar]
- 24.Lewit-Bentley A, Rety S. EF-hand calcium-binding proteins. Curr Opin Struct Biol. 2000;10:637–43. doi: 10.1016/s0959-440x(00)00142-1. [DOI] [PubMed] [Google Scholar]
- 25.Bhattacharya S, Bunick CG, Chazin WJ. Target selectivity in EF- hand calcium binding proteins. Biochim Biophys Acta. 2004;1742:69–79. doi: 10.1016/j.bbamcr.2004.09.002. [DOI] [PubMed] [Google Scholar]
- 26.Ames JB, Dizhoor AM, Ikura M, Palczewski K, Stryer L. Three-dimensional structure of guanylyl cyclase activating protein-2, a calcium- sensitive modulator of photoreceptor guanylyl cyclases. J Biol Chem. 1999;274:19329–37. doi: 10.1074/jbc.274.27.19329. [DOI] [PubMed] [Google Scholar]
- 27.Flaherty KM, Zozulya S, Stryer L, McKay DB. Three- dimensional structure of recoverin, a calcium sensor in vision. Cell. 1993;75:709–16. doi: 10.1016/0092-8674(93)90491-8. [DOI] [PubMed] [Google Scholar]
- 28.Vijay-Kumar S, Kumar VD. Crystal structure of recombinant bovine neurocalcin. Nat Struct Biol. 1999;6:80–8. doi: 10.1038/4956. [DOI] [PubMed] [Google Scholar]
- 29.Bourne Y, Dannenberg J, Pollmann V, Marchot P, Pongs O. Immunocytochemical localization and crystal structure of human frequenin (neuronal calcium sensor 1). J Biol Chem. 2001;276:11949–55. doi: 10.1074/jbc.M009373200. [DOI] [PubMed] [Google Scholar]
- 30.Griffith JP, Kim JL, Kim EE, Sintchak MD, Thomson JA, Fitzgibbon MJ, Fleming MA, Caron PR, Hsiao K, Navia MA. X-ray structure of calcineurin inhibited by the immunophilin-immunosuppressant FKBP12-FK506 complex. Cell. 1995;82:507–22. doi: 10.1016/0092-8674(95)90439-5. [DOI] [PubMed] [Google Scholar]
- 31.Padmanabhan B, Kuzuhara T, Adachi N, Horikoshi M. The crystal structure of CCG1/TAF(II)250-interacting factor B (CIB). J Biol Chem. 2004;279:9615–24. doi: 10.1074/jbc.M312165200. [DOI] [PubMed] [Google Scholar]
- 32.Tanaka T, Ames JB, Harvey TS, Stryer L, Ikura M. Sequestration of the membrane-targeting myristoyl group of recoverin in the calcium-free state. Nature. 1995;376:444–7. doi: 10.1038/376444a0. [DOI] [PubMed] [Google Scholar]
- 33.Ames JB, Ishima R, Tanaka T, Gordon JI, Stryer L, Ikura M. Molecular mechanics of calcium-myristoyl switches. Nature. 1997;389:198–202. doi: 10.1038/38310. [DOI] [PubMed] [Google Scholar]
- 34.Palczewski K, Subbaraya I, Gorczyca WA, Helekar BS, Ruiz CC, Ohguro H, Huang J, Zhao X, Crabb JW, Johnson RS, et al. Molecular cloning and characterization of retinal photoreceptor guanylyl cyclase- activating protein. Neuron. 1994;13:395–404. doi: 10.1016/0896-6273(94)90355-7. [DOI] [PubMed] [Google Scholar]
- 35.Otto-Bruc A, Buczylko J, Surgucheva I, Subbaraya I, Rudnicka-Nawrot M, Crabb JW, Arendt A, Hargrave PA, Baehr W, Palczewski K. Functional reconstitution of photoreceptor guanylate cyclase with native and mutant forms of guanylate cyclase-activating protein 1. Biochemistry. 1997;36:4295–302. doi: 10.1021/bi963000d. [DOI] [PubMed] [Google Scholar]
- 36.Hwang JY, Koch KW. The myristoylation of the neuronal Ca2+ - sensors guanylate cyclase-activating protein 1 and 2. Biochim Biophys Acta. 2002;1600:111–7. doi: 10.1016/s1570-9639(02)00451-x. [DOI] [PubMed] [Google Scholar]
- 37.Hwang JY, Koch KW. Calcium- and myristoyl-dependent properties of guanylate cyclase-activating protein-1 and protein-2. Biochemistry. 2002;41:13021–8. doi: 10.1021/bi026618y. [DOI] [PubMed] [Google Scholar]
- 38.Olshevskaya EV, Hughes RE, Hurley JB, Dizhoor AM. Calcium binding, but not a calcium-myristoyl switch, controls the ability of guanylyl cyclase-activating protein GCAP-2 to regulate photoreceptor guanylyl cyclase. J Biol Chem. 1997;272:14327–33. doi: 10.1074/jbc.272.22.14327. [DOI] [PubMed] [Google Scholar]
- 39.Olshevskaya EV, Ermilov AN, Dizhoor AM. Dimerization of guanylyl cyclase-activating protein and a mechanism of photoreceptor guanylyl cyclase activation. J Biol Chem. 1999;274:25583–7. doi: 10.1074/jbc.274.36.25583. [DOI] [PubMed] [Google Scholar]
- 40.Yu H, Olshevskaya E, Duda T, Seno K, Hayashi F, Sharma RK, Dizhoor AM, Yamazaki A. Activation of retinal guanylyl cyclase-1 by Ca2+-binding proteins involves its dimerization. J Biol Chem. 1999;274:15547–55. doi: 10.1074/jbc.274.22.15547. [DOI] [PubMed] [Google Scholar]
- 41.Peshenko IV, Olshevskaya EV, Dizhoor AM. Ca(2+)-dependent conformational changes in guanylyl cyclase-activating protein 2 (GCAP-2) revealed by site-specific phosphorylation and partial proteolysis. J Biol Chem. 2004;279:50342–9. doi: 10.1074/jbc.M408683200. [DOI] [PubMed] [Google Scholar]
- 42.Li N, Fariss RN, Zhang K, Otto-Bruc A, Haeseleer F, Bronson D, Qin N, Yamazaki A, Subbaraya I, Milam AH, Palczewski K, Baehr W. Guanylate-cyclase-inhibitory protein is a frog retinal Ca2+-binding protein related to mammalian guanylate-cyclase-activating proteins. Eur J Biochem. 1998;252:591–9. doi: 10.1046/j.1432-1327.1998.2520591.x. [DOI] [PubMed] [Google Scholar]
- 43.Ermilov AN, Olshevskaya EV, Dizhoor AM. Instead of binding calcium, one of the EF-hand structures in guanylyl cyclase activating protein-2 is required for targeting photoreceptor guanylyl cyclase. J Biol Chem. 2001;276:48143–8. doi: 10.1074/jbc.M107539200. [DOI] [PubMed] [Google Scholar]
- 44.Fiser A, Sali A. Modeller: generation and refinement of homology-based protein structure models. Methods Enzymol. 2003;374:461–91. doi: 10.1016/S0076-6879(03)74020-8. [DOI] [PubMed] [Google Scholar]
- 45.Newbold RJ, Deery EC, Walker CE, Wilkie SE, Srinivasan N, Hunt DM, Bhattacharya SS, Warren MJ. The destabilization of human GCAP1 by a proline to leucine mutation might cause cone-rod dystrophy. Hum Mol Genet. 2001;10:47–54. doi: 10.1093/hmg/10.1.47. [DOI] [PubMed] [Google Scholar]
- 46.Sokal I, Li N, Verlinde CL, Haeseleer F, Baehr W, Palczewski K. Ca(2+)-binding proteins in the retina: from discovery to etiology of human disease(1). Biochim Biophys Acta. 2000;1498:233–51. doi: 10.1016/s0167-4889(00)00099-9. [DOI] [PubMed] [Google Scholar]
- 47.Sokal I, Haeseleer F, Arendt A, Adman ET, Hargrave PA, Palczewski K. Identification of a guanylyl cyclase-activating protein-binding site within the catalytic domain of retinal guanylyl cyclase 1. Biochemistry. 1999;38:1387–93. doi: 10.1021/bi982512k. [DOI] [PubMed] [Google Scholar]
- 48.Sokal I, Li N, Klug CS, Filipek S, Hubbell WL, Baehr W, Palczewski K. Calcium-sensitive regions of GCAP1 as observed by chemical modifications, fluorescence, and EPR spectroscopies. J Biol Chem. 2001;276:43361–73. doi: 10.1074/jbc.M103614200. [DOI] [PMC free article] [PubMed] [Google Scholar]
- 49.Lucast LJ, Batey RT, Doudna JA. Large-scale purification of a stable form of recombinant tobacco etch virus protease. Biotechniques. 2001;30:544–6. 548, 550 passim. doi: 10.2144/01303st06. [DOI] [PubMed] [Google Scholar]
- 50.Otwinowski Z, Minor W. Processing of X-ray diffraction data collected in oscillation mode. Meth. Enzymol. 1997;276:307–326. doi: 10.1016/S0076-6879(97)76066-X. [DOI] [PubMed] [Google Scholar]
- 51.Terwilliger TC. SOLVE: An Automated Crystallographic Structure Solution Program for MIR and MAD 1.04 edit. Los Alamos National Laboratory; 1997. www.solve.lanl.gov. [Google Scholar]
- 52.Terwilliger TC. SOLVE and RESOLVE: automated structure solution and density modification. Methods Enzymol. 2003;374:22–37. doi: 10.1016/S0076-6879(03)74002-6. [DOI] [PubMed] [Google Scholar]
- 53.Brünger AT, Adams PD, Clore GM, DeLano WL, Gros P, Grosse-Kunstleve RW, Jiang JS, Kuszewski J, Nilges M, Pannu NS, Read RJ, Rice LM, Simonson T, Warren GL. Crystallography & NMR system: A new software suite for macromolecular structure determination. Acta Crystallogr D Biol Crystallogr. 1998;54:905–921. doi: 10.1107/s0907444998003254. [DOI] [PubMed] [Google Scholar]
- 54.Jones A. A Graphics Model Building and Refinement System for Macromolecules. J. Appl. Cryst. 1978;11:268–272. [Google Scholar]
- 55.DeLano WL. The PyMOL Molecular Graphics System. 2002 http://www.pymol.org.
Associated Data
This section collects any data citations, data availability statements, or supplementary materials included in this article.