

Abstract
Overexpression of the transcription factor (TF) ATOH1 is known to induce the transformation of nonsensory cells in the organ of Corti into hair cells (HCs). Evaluating DNA 5′ to the coding sequence of the pou4f3 gene, a target of ATOH1 in HCs, we identified in three regions containing clustered binding sites for ATOH1 and several other TFs that are expressed in developing inner ear sensory epithelia at the time of HC specification. These regions and sites are highly conserved across evolutionarily distant mammalian species. To test the hypothesis that the identified TFs act in combination to regulate the pou4f3 gene, we transfected by electroporation neonatal cochlear sensory epithelium from mice expressing GFP under the control of an 8.5 kb 5′ pou4f3 genomic fragment. Plasmids encoding 21 TFs c-transfected with human ATOH1 (hATOH1). Co-transfection with hETV4, hNMYC or hETS2 produced significantly more pou4f3/GFP and myosin7A positive nonsensory cells than hATOH1 alone. Co-transfection of hATOH1 with hHES1, hHES5 or hNEUROD1 reduced the effects of hATOH1. Chromatin immunoprecipitation (ChIP) of DNA from an inner ear cell line transfected with hNMYC, hETV4 or hETS2 revealed binding to a conserved region immediately proximal to the coding sequence. ChIP similarly revealed binding of hGATA3, hNMYC and hTFE2 to a region several kb distal to the coding sequence, which we have previously shown to bind ATOH1. The results suggest that ATOH1 acts in concert with a subset of other TFs to directly regulate the pou4f3 gene, and more broadly to regulate the HC phenotype.
Keywords: ATOH1, NMYC, ETS2, ETV4, POU4F3, hair cell, gene regulation
INTRODUCTION
Sensorineural hearing loss (SNHL) that results from the loss of hair cells (HCs) in the organ of Corti (OC) is one of the most frequent neurosensory disorders. In the mature OC of the mammalian inner ear, once a HC dies, it is not regenerated. However, recently the development of innovative molecular biological techniques has increased our understanding of the genes and cellular interactions that mediate the development of the inner ear. Based on this information, gene therapy has shown the potential to stimulate HC regeneration and replace HC’s lost due to hereditary or environmental causes.
In this context, a number of studies have demonstrated that the basic helix-loop-helix (bHLH) transcription factor (TF) ATOH1 (also known as Math1) is a commitment factor that drives prosensory cells in the inner ear to develop as HCs. Thus, absence of ATOH1 results in a complete loss of HCs [1–2], while overexpression of ATOH1 has been shown to induce the transformation of supporting cells (SCs) in the inner ear into HCs [3–8], and to improve vestibular function [9]. Recently, ATOH1 was shown to induce the differentiation of human umbilical cord mesenchymal stromal cells into cells that resembled HCs [10].
The TF POU4F3 (also known as Brn-3.1, Brn-3c) is necessary for late HC differentiation, including their functional transduction and synaptic specializations, and for HC survival in the inner ear [11,12]. Mutations in the pou4f3 gene are responsible for DFNA15, an autosomal dominant disorder characterized by progressive, non-syndromic, sensorineural hearing loss [13,14]. Pou4f3 mRNA is expressed in the inner ear very soon after the onset of ATOH1 mRNA, suggesting that ATOH1 may regulate the pou4f3 gene.
Evaluating potential regulatory regions upstream of the pou4f3 coding sequences, we previously identified paired binding sites for ATOH1 using bioinformatic analysis, a feature that was highly conserved among four mammalian species including mouse, human, dog, and cow [15]. We demonstrated binding of ATOH1 to this region by chromatin immunoprecipitation. We also identified conserved binding sites for three additional TFs, adjacent to these for ATOH1. We tested these TFs (TFE2, GATA3 and SP1) and found that two (TFE2 and GATA3) enhanced the ability of ATOH1 to activate the pou4f3 gene and induce myosin7A expression in the nonsensory cells of the neonatal OC [16]. This provided evidence that the conserved TF binding site can identify transcriptionally associated factors that co-regulate the pou4f3 gene and, more generally, the HC phenotype.
Based on these results, we performed a more detailed bioinformatic analysis of 8.5kb of DNA 5′ to the pou4f3 ATG, and identified additional highly conserved regions and TF binding motifs. We then determined whether any of these TFs can also act in combination with ATOH1 to co-regulate the pou4f3 gene and the HC phenotype.
Material and Method
Animals
The local animal subjects committee of the VA San Diego Healthcare System approved all procedures in accordance with the guidelines laid down by the National Institutes of Health regarding the care and use of animals for experimental procedures.
Postnatal 1.5 (P 1.5) wild type CBA/J or pou4f3/GFP transgenic mice on a CBA/J background were used. In the transgenic mice, 8.5 kb of DNA 5′ to the pou4f3 start codon drove the expression of eGFP (pou4f3/GFP). Robust pou4f3/GFP expression is noted in neonatal cochlear and vestibular HCs, and not in other cochlear cell types (Fig. 1).
Figure 1.
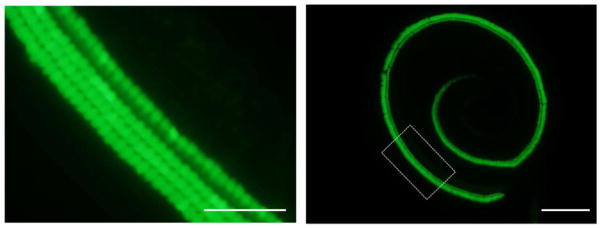
A pou4f3/GFP transgenic. Neonatal cochlea of a transgenic mouse (post natal 1.5 day, P1.5) in which GFP, driven by the 8.5kb of 5′ pou4f3 DNA illustrated above, is expressed only in hair cells (HCs). The scale bar = 50 μm (left) and 200 μm (right).
Bioinformatics analysis
Homology analysis was performed on 8.5 kb 5′ to the murine pou4f3 ATG using stepwise alignment of human, mouse, dog and cow genome sequences. Three regions of high sequence homology were detected: −400 to 0 bp, immediately 5′ to the start codon (91% conserved, hereafter referred to as the proximal homology region), ~70 bp located at −1700 bp from the ATG (78% conserved, distal homology region I), in addition to the ~285 bp located at −8200 bp from the ATG (85% conserved, distal homology region II) as described previously [15]. These were considered to be candidate regulatory sequences. We also analyzed these sequences for TF binding sites that were conserved across all four species, using rVISTA. We then assessed TF expression in the inner ear sensory epithelium as reported in the literature and/or in the GenePaint expression database (http://www.genepaint.org/Frameset.html), as present at embryonic day 14.5 (e14.5), the time of onset of pou4f3 expression, to explore their potential for involvement in pou4f3 gene regulation.
Cochlear explant cultures and electroporation
Cochlear explants isolated from P1.5 mice were electroporated and cultured as previously described, with modifications [16,17]. Briefly, cochlear sensory epithelia was isolated in cold DMEM/F12. A Millipore filter membrane (30 mm diameter culture plate insert; Millipore, Billerica, MA USA) was placed in a sterile 60 mm diameter petri dish. Five hundred μl HBSS was placed at the center of a dish electrode (2 mm diameter flat round electrode; CUY700P2E, NEPA GENE, Chiba, Japan). Five μl of expression plasmid in HBSS was applied to the sensory epithelium while confirming that the tissue was well attached to the filter membrane. A cover electrode (2 mm diameter flat round electrode; CUY700P2L, NEPA GENE) was placed above the tissue. An electroporator (CUY21EDIT, NEPA GENE) was used to apply five rectangular pulses (14 V, 30 ms duration with an interval of 970 ms). The filter membrane with the tissue was cut in adequate size to be transferred into 8 well Lab-Tek slides (Nunc, Naperville, IL USA). After they were transferred to the slides, explants were filled with 250 μl of pre-warmed culture medium (high glucose DMEM, 10% fetal bovine serum, 25 mM HEPES, 10 mg/ml ciprofloxin; Sigma-Aldrich, St. Louis, MO USA). The explants were cultured in an incubator at 37°C with 5% CO2 and 95% humidity for 2–3 hours, and then 500 L fresh culture medium was added into the well. Thereafter, the culture medium was replaced with 500 L fresh culture medium every 24 hours. The explants were imaged daily using an inverted fluorescent microscope (IX70, Olympus, Tokyo, Japan) and native HCs were followed to differentiate them from transdifferentiated pou4f3/GFP+ cells induced by transfection with plasmids.
Transfection of sensory epithelia with TFs and imaging for pou4f3/GFP and myosin 7A expression
The plasmids used included human ATOH1 (hATOH1), hTFE2, hCUX1, hE2F1, hETS2, hETV4, hFOXM1, hHES1, hHES5, hGABPA, hGATA1, hGATA2, hGATA3, hMAX, hMAZ, hMEIS, hNERF, hNFE2, hNMYC, hCMYC, hPATZ1, hSOX2 and hNEUROD1 (Fig 2). All plasmids were purchased from OriGene (Rockville, MD USA). Five days after transfection, GFP fluorescence was evaluated, and immunolabelling was carried out to detect myosin VIIa, which in the inner ear is a specific marker for the HC phenotype [18]. For immunolabelling, the explants were fixed with 4% PFA for 15 min, permeabilized with 0.5% Triton X-100 (Sigma) for 15 min and blocked with 10% fetal bovine serum for 15 min. They were then incubated overnight at 4°C with anti-myosin VIIa antibody (1:500; Proteus Biosciences; Ramona, CA USA). Texas-Red-conjugated anti-rabbit antibody (1:100; Jackson Immuno Research, West Grove, PA USA) was used as the secondary antibody. The fluorescent signal was visualized using an inverted fluorescent microscopy system (FSX-100, Olympus). Each cochlear epithelium was then divided into three equal sections by length which were defined as the apical, middle, and basal turns. The number of pou4f3/GFP− and myosin VIIa-positive cells were then counted for each turn.
Figure 2.
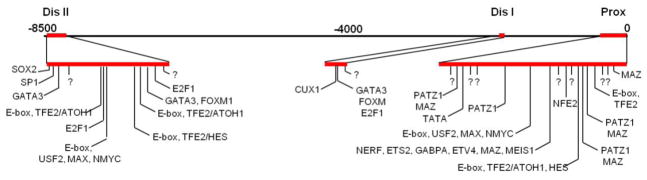
The region 5′ to the pou4f3 gene contains three regions (red) that are highly conserved across the human, mouse, dog and cow genomes. Within these regions, motifs for TF binding are also highly conserved. Those that correspond to TFs that are expressed in the developing sensory epithelium are indicated. Motifs that are highly conserved, but which do not correspond to known TF binding sites are indicated with question marks.
Chromatin immunoprecipitation
To determine whether hTFE2, hETS2, hETV4, hGATA3 and hNMYC bind to any of the conserved regions of the Pou4f3 gene, chromatin immunoprecipitation was performed as previously reported [15].
Each of six 75 cm2 flasks of VOT-E36 cells were grown in MEM with 10% FBS and 50 U/ml of γ-IFN (Invitrogen). After the cells were 80% confluent (3 × 10⁷ cells/flask), they were transfected with either Lipofectamine (Invitrogen) alone (negative control) or 10 μg of hAtoh1-flg with Lipofectamine in serum-free media. 18h later, the transfection was stopped and the cells were allowed to grow for 48h total. Cells were then treated with formaldehyde to a final concentration of 1% for 10 minutes to crosslink DNA to protein. Cells were then washed in ice-cold PBS and collected using a cell scraper. The samples were sonicated to lyse the cells and shear the DNA/chromatin complexes into 700 bp lengths. After cleanup of DNA, samples were immunoprecipitated with no antibody (control) or 15 μg of anti-flg (Abcam) antibody overnight at 4°C. Samples were then coupled to Protein-A beads and washed to purify immunoprecipitated DNA. Decrosslinking was performed by Proteinase K treatment at 65°C overnight. Samples were cleaned using Affymetrix cDNA cleanup columns and polymerase chain reaction (PCR) was performed on control and precipitated DNA, using primers that amplified DNA from the proximal conserved region (forward: CTG GGA CAG GAC AGA GGT TTA GG; reverse: GCG GGG GAG ATG GAA TCA AG), distal conserved region I (forward: TTT CCA CAC TCT GCC CCC TC; reverse: CCT CTT AGC CTC CTC TTC TTC CTT TAG), or distal conserved region II (forward: AGA GAA AGA GAG AGG AAG GCA AGG; reverse: GGG CAG TTA GTT GGA ACC ACA G).
Data analysis
To evaluate the level of pou4f3/GFP expression in each cell, the average brightness of individual HCs was measured on Image J (U. S. National Institutes of Health, Bethesda, Maryland USA; [16,19]. For each sample, 10 pou4f3/GFP cells in the GER were measured for the brightness of GFP expression The average GFP brightness of the cells were standardized against the average GFP brightness of native HCs in the same images, to correct for difference in image exposure.
The number of pou4f3/GFP+ and myosin7a+ cells in the GER of each cochlear turn was counted for each transfected explant. One-way ANOVA with Dunnett’s multiple comparisons test was used to evaluate differences between individual conditions using SPSS statistics ver. 20 (IBM, Chicago, IL USA). Differences with a corrected p value less than 0.05 were considered significant. The data were presented as means and standard deviations.
RESULTS
Motif analysis of 5′ DNA binding sites in the Pou4f3 gene
We analyzed three regions of highly conserved sequence (proximal homology region and distal homology regions I and II) for TF binding sites that were conserved across all four species, using rVISTA. We also determined the expression of factors in inner ear sensory epithelia as reported in the literature and/or determined by in situ hybridization in the Gene Paint expression database (http://www.genepaint.org/Frameset.html) at E14.5. Sites for which TF expression was not confirmed were eliminated.
This analysis resulted in 21 predicted TF sites, some of which can support binding by multiple factors (Fig. 2). Several of these TFs are already known to influence HC development.
Of particular interest were clustered E-boxes within these regions, three of which are known to be recognized by ATOH1 [20], including two of which were closely spaced in the distal-most conserved region. Additional conserved sequences that did not correspond to known TF binding sites were also identified. Using these procedures, we identified 22 TFs as candidates that might potentially regulate the Pou4f3 gene in cooperation with ATOH1: hTFE2, hCUX1, hE2F1, hETS2, hETV4, hFOXM1, hHES1, hHES5, hGABPA, hGATA1, hGATA2, hGATA3, hMAX, hMAZ, hMEIS, hNERF, hNFE2, hNMYC, hCMYC, hPATZ1, hSOX2 and NEUROD1.
Co-transfection of hATOH1 with hETV4, hNMYC or hETS2 produced significantly more pou4f3/GFP+ and myosin7A+ cells in the GER than hATOH1 alone
In our P1.5 pou4f3/GFP transgenic OC, we found that transfection of hATOH1 alone induced pou4f3/GFP+ cells in the GER (n = 8). We next tested the co-transfection of hATOH1 with either hTFE2, hCUX1, hE2F1, hETS2, hETV4, hFOXM1, hHES1, hHES5, hGABPA, hGATA1, hGATA2, hGATA3, hMAX, hMAZ, hMEIS, hNERF, hNFE2, hNMYC, hCMYC, hPATZ1, hSOX2 or hNEUROD1 (n = 5–7 in each group). Co-transfection of hATOH1 with either hETV4, hNMYC or hETS2 at 0.5 μg/μL induced significantly more pou4f3/GFP+ and myosin7A+ cells in GER than 0.5 μg/μL hATOH1 alone (Fig. 3, 4) (p < 0.05). As a positive control, co-transfection of hATOH1 and hTFE2 induced more pou4f3/GFP+ and myosin7A+ cells in GER than hATOH1 alone, consistent with our previous research [16]. Transfection of plasmid encoding hTFE2 by itself also induced pou4f3/GFP+ cells in the GER as also noted previously [16]. In contrast, transfection of hGATA3 alone, hETV4 alone, hETS2 alone or hNMYC alone did not induce any pou4f3/GFP+ cells in the GER (Fig. 4).
Figure 3.

Representative micrographs of transfection with hATOH1 alone (upper left) which induced pou4f3/GFP+ GER cells well inside the native HCs (arrowheads). hATOH1 in combination with hHES1 induced fewer GFP+ cells than hATOH1 alone (upper left). Transfection of hATOH1 in combination with hNMYC (lower left) or hETV4 (lower right) induced significantly more GFP+ cells than hATOH1 alone. Lower micrographs show a higher magnification of pou4f3/GFP and myosin7a expression after Atoh1/hNMYC transfection (box). Most GFP+ cells (left) were also myosinVIIa+ (middle), although a few cells were GFP+ but myosin VIIA- (arrows). The scale bar = 200 μm (upper) and 100 μm (lower).
Figure 4.

The number of pou4f3/GFP+ cells (upper) and Myo7A+ cells (lower) observed in the GER following transfection with plasmids encoding hATOH1 alone or the targeted TFs in combination with hATOH1. GER cells observed along the entire length of the sensory epithelium are shown separately. * (increase) and # (decrease) indicate a significant difference at p < 0.05 from hATOH1 alone by one-way ANOVA with Dunnett’s multiple comparison test. Error bars represent SD.
Co-transfection of hATOH1 with hHES1, hHES5 or hNEUROD1 produced significantly less pou4f3/GFP+ and myosin7A+ cells in the GER than hATOH1 alone
In contrast, co-transfection with hATOH1 with hHES1, hHES5 or hNEUROD1 produced less pou4f3/GFP+ and myosin7A+ cells in the GER than hATOH1 alone. These differences were statistically significant (p < 0.05) (Fig. 4).
Co-transfection with the other TFs: hCUX1, hE2F1, hFOXM1, hGABPA, hGATA1, hGATA2, hMAX, hMAZ, hMEIS, hNERF, hNFE2, hPATZ1 and hSOX2 did not alter the effects of hATOH1 (Fig. 4).
Co-transfection of hATOH1 with double or triple TFs produced significantly more pou4f3/GFP+ and myosin7A+ cells in the GER than hATOH1 alone
To determine whether or not there were additional combinational effects between the TFs identified in this and the proceeding study (hTFE2, hGATA3, hETV4, hETS2 and hNMYC), explants were transfected with hATOH1 plus various combinations of these TFs (n = 6 or 7). Co-transfection of hATOH1 plus these TFs at 0.5 μg/μL were statistically more effective than hATOH1 alone at 0.5 μg/μL, but the various combinations did not alter the effect compared to the double combinations of hATOH1 plus hTFE2, hATOH1 plus hETV4, hATOH1 plus hETS2 or hATOH1 plus hNMYC at 0.5 μg/μL, respectively (Fig. 7).
Figure 7.

The number of pou4f3/GFP+ cells (upper) and Myo7A+ cells (lower) observed in the GER following transfection with plasmids encoding hATOH1 alone or the combination of TFs listed below the graph. + indicates transfection of 0.5 μg/μL concentration. * indicates a significant difference at p < 0.05 from hATOH1 alone by one-way ANOVA with Dunnett’s multiple comparison test. Error bars represent SD.
Co-transfection of hATOH1 with hETS2, hE2F1 or hFOXM induced significantly brighter GFP than hATOH1 alone
We evaluated the level of GFP fluorescence in pou4f3/GFP+/myosin 7A+ GER cells in each group. The pou4f3/GFP+/myosin VIIa+ GER cells resulting from transfection of hATOH1 alone were similar in GFP intensity to endogenous pou4f3/GFP+ native HCs. The co-transfection of hATOH1 with hETS2, hE2F1 or hFOXM induced small but significant increases in brightness when compared to hATOH1 alone (p < 0.05) (Fig. 6).
Figure 6.
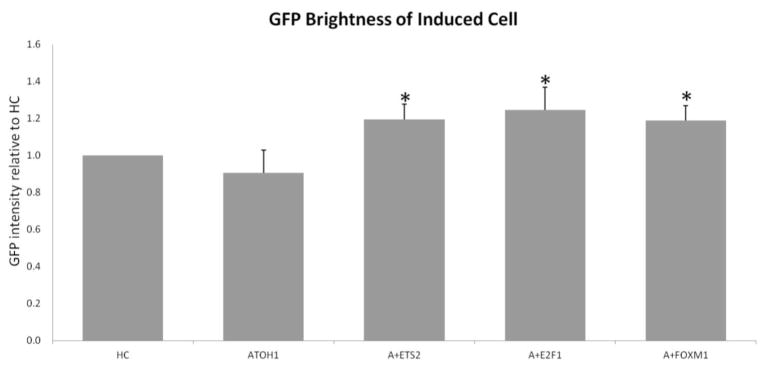
The level of GFP fluorescence in pou4f3/GFP+/myosin 7A+ GER cells were evaluated in each group. The pou4f3/GFP+/myosin VIIa+ GER cells of co-transfection of hATOH1 with hETS2, hE2F1 or hFOXM induced a significant increase in brightness when compared to hATOH1 alone (p < 0.05). * indicates a significant difference at p < 0.05 from hATOH1 alone by one-way ANOVA with Dunnett’s multiple comparison test. Error bars represent SD.
Immunoprecipitation of conserved regions from VOT-E36 cells by transfection hGATA3, hNMYC, hTFE2, hETV4 or hETS2
To determine whether hTFE2, hGATA3, hNMYC, hETV4 or hETS2 binds to conserved regulatory regions in the pou4f3 gene, we transfected VOT-E36 cells with hGATA3-flg, hNMYC-flg, hTFE2-flg, hETV4-flg or hETS2-flg. After 72 h, Chromatin immunoprecipitation (ChIP) was performed with an anti-flg antibody. Immunoprecipitated and unselected DNA were amplified with primers specific for the conserved homology proximal region, or for conserved homology distal regions I or II.
PCR products produced by amplification of DNA from the proximal homology region of hNMYC, hETV4 and hETS2 selected DNA were much stronger than those produced from unselected DNA. More intense bands for the distal conserved homology region II were observed for hGATA3, hNMYC and hTFE2. With distal homology region I primers, PCR bands were comparable between unselected and immunoprecipitated DNA for all factors (Fig. 8).
Figure 8.

PCR of DNA immunoprecipitated with anti-myc following transfection of VOT-E36 cells with hGATA3, hNMYC, hTFE2, hETV4 or hETS2-myc/flg. The hNMYC and hETV4 and hETS2 showed a much more intense band for proximal region than was observed with unselected DNA (upper). PCR bands produced amplification of DNA from the distal homology region I were comparable between unselected and immunoprecipitated DNA (middle). The hGATA3, hNMYC and hTFE2 showed a much more intense band for distal region II than was observed with unselected DNA (lower).
The lack of enrichment obtained for distal homology region I with all antibodies, the negative ChIP results for the proximal homology region with GATA3 and TFE2 precipitation, and the negative results for distal homology region II with ETV4 and ETS2 precipitation, all serve as controls for the specificity of immunoprecipitation in positive ChIP reactions.
DISCUSSION
Result summary
ATOH1 is known to be required for hair cell fate determination. However, at sites outside the inner ear, ATOH1 is also involved in the determination of very different cell phenotypes: it plays a significant role in the development of Merkel cells, cutaneous touch receptors [21], cerebellar granule cells [22], and secretory cells in the colon [23], as well as regulating mucin gene expression in various mucosal epithelia [24]. We speculated that tissue and cell-specific factors must exist to differentiate the role of ATOH1 in inner ear HC formation. Because it is known that combinatorial TF codes can contribute to specific cell phenotype determination [25], we hypothesized that this might be true of HC specification as well. We used bioinformatics to identify conserved TF binding sites in the pou4f3 gene, a target of ATOH1 in HCs. The results presented here demonstrate that several of these factors can act in combination with ATOH1, to regulate the number of nonsensory cells in the GER that express GFP under the control of 8.5kb of DNA 5′ to the pou4f3 ATG. A partially overlapping set of TFs also enhanced the brightness of GFP expression in converted nonsensory GER cells. Enhancement of myosin7a co-expression in most GFP+ cells also provides evidence that these TFs more broadly affect adoption of the HC phenotype. Negative regulation of ATOH1 effects was also observed for HES1, HES5 and NEUROD1, which reduced ATOH1 induced expression of the pou4f3/GFP trans-gene and adoption of the HC phenotype. We have previously shown that Atoh1 binds directly to the regulatory sequence used to drive GFP expression in this study, and more specifically to distal homology region II [15]. The presence of highly conserved binding sites suggests the possibility that those TFs that influence the effects of ATOH1 do so by direct interaction on nearby DNA. Our ChIP results confirm direct binding of different combinations of TFs to distal homology region II and the proximal homology conserved region.
ATOH1 induces pou4f3/GFP and myosin7A+ expression in the GER and this effect is enhanced by NMYC
Myc (C-Myc, N-Myc and L-Myc) plays a role in virtually every cellular activity, but a primary function is in cellular proliferation [26]. Myc is a bHLH protein that dimerizes with Max to bind E box sequences, and activate transcription [27]. In the inner ear, two bHLH proto-oncogenes, N-Myc and L-Myc, are typically co-expressed [28,29], whereas a third gene of the same family, C-Myc, seems to play little if any role [30]. Moreover, conditional deletion of N-Myc in the ear shows a massive reduction of labyrinth growth, mediated through reduced proliferation [28]. Consistently, overexpression of N-Myc results in increased labyrinthine size through increased proliferation [30]. L-Myc appears to be of lesser importance in inner ear development [31]. These data are consistent with our results that only hN-MYC altered the effects of hATOH1. Two of the clustered E-boxes (one in distal homology region II and the other in the proximal homology region; Fig. 2) are consistent with binding by N-MYC. The N-MYC site in distal homology region II is immediately adjacent to a binding site preferred by ATOH1. However, interaction between ATOH1 bound to this region and N-MYC bound to the proximal homology region could also be achieved, via appropriate DNA looping. Our data demonstrated that an antibody against tagged hN-MYC preferentially immunoprecipitated both conserved proximal and distal region II DNA from hAtoh1-transfected VOT-E36 cells, providing strong evidence of direct binding of hN-MYC at these sites. The interactive mechanism by which N-MYC might influence ATOH1 is not clear. However, MYC TFs are well known to influence chromatin structure [32] and thus gene expression, which could be involved in the present case. Alternatively, ATOH7 has recently been identified as a direct binding partner of C-MYC [33], raising the possibility of a direct N-MYC/ATOH1 interaction.
ETV4 and ETS2 also enhance the effect of ATOH1 on pou4f3/GFP and myosin7A+ expression in the GER
ETV4 and ETS2 are the members of the ETS family of TFs. ETS proteins regulate multiple biological processes including cell proliferation, apoptosis and differentiation of multiple cell lineages [34,35]. The dysregulation of ETS family proteins is associated with many human cancers [36,37].
Interactions between ETS factors and bHLH TFs have been reported in other tissues. For example, transcriptional synergy between bHLH proteins is dependent upon ETS on the immunoglobulin μ heavy-chain gene enhancer [38]. ETS factors interact with bHLH proteins through their HLH-like domains [39]. The ETS domain binds DNA over a region spanning 12 to 15bp, but it displays sequence preference for only ~9bp with a central, invariant 5′-GGA(A/T)-− core [40]. ETV4 and ETS2 are predicted to bind the same conserved motif in the proximal homology region of the pou4f3 gene (Fig. 2). Moreover, our immunoprecipitated data provides strong evidence of direct binding of hETV4 and hETS2 at this region. As above, DNA conformational changes could bring ATOH1 into proximity with these TFs to mediate direct interactions.
HES1 and HES5 reduce the effect of ATOH1 on pou4f3/GFP and myosin7A+ expression
During normal development, progenitor cells that become supporting cells are prevented from expressing ATOH1 by Notch signaling. The Notch effector genes Hes1 and Hes5 are expressed in the developing mouse cochlea and influence cell fate determination by acting as negative regulators to inhibit the action of bHLH-positive regulators [41]. Cochleas from Hes1 knockout mice exhibit a significant increase in the number of IHCs, whereas cochleas from Hes5 knockout mice show a significant increase in the number of OHCs [42,43].
We identified potential HES-binding N-boxes that overlap two of the highly conserved E-boxes within pou4f3 regulatory DNA that can bind TFE2/ATOH1 heterodimers. It is therefore not surprising that HES1 and HES5 reduce the effect of ATOH1 on pou4f3/GFP and more generally on the HC phenotype expression. These results are consistent with a role for HES1/HES5 as a negative regulation of the pou4f3 gene via direct DNA binding.
NEUROD1 also reduces the effect of ATOH1 on pou4f3/GFP and myosin7A+ expression
NEUROD1 (Neuronal differentiation 1) also reduced the effects of ATOH1 in our study. This result is consistent with our current understanding of NEUROD1 and ATOH1 in the inner ear. Three proneural bHLH TFs (ATOH1, NEUROD1, NEUROG1) define and differentiate the cochleas sensory neurons and hair cells; NEUROG1 is necessary to induce sensory neurons [44], NEUROD1 is necessary for sensory neuron survival and differentiation [45], ATOH1 is necessary for hair cell induction [1]. While there is no consensus binding site for NEUROD1 in the transgene, it’s preferred E-box binding motif differs by only one nucleotide from ATOH1 binding motifs [46]. Thus direct competition for DNA binding is a possible mechanism of interaction.
SOX2 does not enhance the effect of ATOH1 on pou4f3/GFP expression in the GER
Sox2 is a High Mobility Group (HMG) box domain transcription factor that belongs to the B1 subfamily of Sox proteins [47]. Sox2 shows two seemingly contradictory functions in the developing inner ear. At an early development stage (embryo E12.5), ATOH1 is activated by SOX2; however, hair cell differentiation is prevented at later stages (E16.5) by the parallel activation of negative regulators of ATOH1 function [48,49]. In our study, SOX2 had no significant influence on either pou4f3 or myosin 7A expression, which may be due to the age (P1.5 day) used in our study.
Most TFs with conserved binding sites in the pou4f3 gene did not enhance the effect of ATOH1 on pou4f3/GFP expression in the GER
The remaining TFs; hCUX1, hE2F1, hFOXM1, hGABPA, hGATA1, hGATA2, hMAX, hMAZ, hMEIS, hNERF, hNFE2, hPATZ1 and hUSF2 did not alter the effects of hATOH1 in p1.5 GER cells. There are several possible explanations for this. While motifs that support binding of these factors are conserved in the pou4f3 gene, they may not support functional binding. The number of functional sites in the genome is well known to be significantly lower than the number of predicted sites [50]. Alternatively, these TFs may co-regulate to ATOH1 in other cell types and could be inactivated due to epigenetic effects in the inner ear. Another possibility is that these sites are functional in HCs at different stages of development, but are inactive at p1.5.
Triple or quadruple TF combinations are not more effective than double TF combinations in HC induction
To detect whether combinations of TFs greater than two further influence the effects of hATOH1, all potential triple or quadruple combinations of hATOH1 plus hTCF3, hGATA3, hETV4 or hNMYC were performed. None of the triple or quadruple TF combinations enhanced the effect of hATOH1 in induction of GFP+ or myosin7A+ cells over that seen with the double TF combinations. It is possible that HC induction is saturated at P1.5. These data also provide an additional control demonstrating that increasing the amount of plasmid, by itself, does not alter the effects of a fixed amount of hATOH1 plasmid.
Interestingly, transfection of 0.25 μg/μL hAtoh1 plus hTCF3 plus hNMYC or hETV4 did not increase Pou4f3/GFP expression compared with 0.5 μg/μL hAtoh1 alone. Low levels of ATOH1 do not drive cochlear neural progenitors into mature HCs [51]. Moreover, the level and duration of ATOH1 expression played a significant role not only in the survival of HCs, but also in their degree of differentiation or even HC type [52]. This negative interaction might result from the low level of ATOH1 or the other TFs in GER.
Conformational interactions in 5′ pou4f3 DNA
Regulatory elements that control the transcription of genes interact physically at the site of transcription initiation. These interactions are facilitated by the mediator complex, which can link DNA binding proteins at distant sites, and by conformational changes in DNA that bring distant DNA elements into proximity [53]. Many other DNA binding and nucleosomal proteins can also induce bending of DNA (e.g. 54). Closely spaced palindromic sequences may induce hair-pin turns in DNA, and several palindromic A/T and D/C repeats are present in the DNA separating distal homology region II from the proximal homology region. In addition, the inherent sequence structure of DNA affects its flexibility and shape [55]. We assessed the curvature of DNA in the 8.5 kb of 5′ pou4f3 DNA, using the ICGEB bend-it tool (http://hydra.icgeb.trieste.it/dna/bend_it.html). DNA curvature in the three highly conserved regions was very low. However, there were four sharp peaks of predicted curvature between 2.5 and 6.5 kB 5′ from the ATG, and one peak just 5′ to the proximal homology region, which could serve to bring distal homology region II to the transcriptional start site.
Supplementary Material
The number of pou4f3/GFP+ cells observed in the GER following transfection with plasmids encoding hATOH1 alone or the targeted TFs in combination with hATOH1. GER cells observed in the apical turn (upper), in the middle turn (middle) and in the basal turn (lower) of the sensory epithelium are shown separately. * (increase) and # (decrease) indicate a significant difference at p < 0.05 from hATOH1 alone by one-way ANOVA with Dunnett’s multiple comparison test. Error bars represent SD.
The number of Myo7A+ cells observed in the GER following transfection with plasmids encoding hATOH1 alone or the targeted TFs in combination with hATOH1. GER cells observed in the apical turn (upper), in the middle turn (middle) and in the basal turn (lower) of the sensory epithelium, are shown separately. * (increase) and # (decrease) indicate a significant difference at p < 0.05 from hATOH1 alone by one-way ANOVA with Dunnett’s multiple comparison test. Error bars represent SD.
Figure 5.

Time course of pou4f3/GFP expression in the GER of explant transfected with hATOH1 alone (A) and hATOH1 plus hNMYC (B). GER cells showed increasing expression of pou4f3/GFP from postoperative day 1 to 5, while pou4f3/GFP+ HCs spread outward and some of the outer HCs were lost. The scale bar = 200 μm.
Acknowledgments
Supported by grants from the Research Service of the Veterans Administration (BX001205, AFR), the NIH/NIDCD (R01DC000139). Julie Lightner formatted the manuscript and Dr. Masatsugu Masuda provided useful comments. Their assistance is gratefully acknowledged.
References
- 1.Bermingham NA, Hassan BA, Price SD, Vollrath MA, Ben-Arie N, Eatock RA, Bellen HJ, Lysakowski A, Zoghbi HY. Math1: an essential gene for the generation of inner ear hair cells. Science. 1999;284 (5421):1837–1841. doi: 10.1126/science.284.5421.1837. [DOI] [PubMed] [Google Scholar]
- 2.Chen P, Johnson JE, Zoghbi HY, Segil N. The role of Math1 in inner ear development: Uncoupling the establishment of the sensory primordium from hair cell fate determination. Development. 2002;129 (10):2495–2505. doi: 10.1242/dev.129.10.2495. [DOI] [PubMed] [Google Scholar]
- 3.Gubbels SP, Woessner DW, Mitchell JC, Ricci AJ, Brigande JV. Functional auditory hair cells produced in the mammalian cochlea by in utero gene transfer. Nature. 2008;455 (7212):537–541. doi: 10.1038/nature07265. nature07265 [pii] [DOI] [PMC free article] [PubMed] [Google Scholar]
- 4.Woods C, Montcouquiol M, Kelley MW. Math1 regulates development of the sensory epithelium in the mammalian cochlea. Nat Neurosci. 2004;7 (12):1310–1318. doi: 10.1038/nn1349. nn1349 [pii] [DOI] [PubMed] [Google Scholar]
- 5.Zheng JL, Gao WQ. Overexpression of Math1 induces robust production of extra hair cells in postnatal rat inner ears. Nat Neurosci. 2000;3 (6):580–586. doi: 10.1038/75753. [DOI] [PubMed] [Google Scholar]
- 6.Mulvaney J, Dabdoub A. Atoh1, an essential transcription factor in neurogenesis and intestinal and inner ear development: function, regulation, and context dependency. J Assoc Res Otolaryngol. 2012;13 (3):281–293. doi: 10.1007/s10162-012-0317-4. [DOI] [PMC free article] [PubMed] [Google Scholar]
- 7.Driver EC, Sillers L, Coate TM, Rose MF, Kelley MW. The Atoh1-lineage gives rise to hair cells and supporting cells within the mammalian cochlea. Dev Biol. 2013 doi: 10.1016/j.ydbio.2013.01.005. S0012–1606(13)00010-9 [pii] [DOI] [PMC free article] [PubMed] [Google Scholar]
- 8.Izumikawa M, Minoda R, Kawamoto K, Abrashkin KA, Swiderski DL, Dolan DF, Brough DE, Raphael Y. Auditory hair cell replacement and hearing improvement by Atoh1 gene therapy in deaf mammals. Nat Med. 2005;11 (3):271–276. doi: 10.1038/nm1193. nm1193 [pii] [DOI] [PubMed] [Google Scholar]
- 9.Schlecker C, Praetorius M, Brough DE, Presler RG, Jr, Hsu C, Plinkert PK, Staecker H. Selective atonal gene delivery improves balance function in a mouse model of vestibular disease. Gene Ther. 2011;18(9):884–890. doi: 10.1038/gt.2011.33. [DOI] [PMC free article] [PubMed] [Google Scholar]
- 10.Devarajan K, Forrest ML, Detamore MS, Staecker H. Adenovector-mediated gene delivery to human umbilical cord mesenchymal stromal cells induces inner ear cell phenotype. Cell Reprogram. 2013;15(1):43–54. doi: 10.1089/cell.2011.0097. [DOI] [PMC free article] [PubMed] [Google Scholar]
- 11.Erkman L, McEvilly RJ, Luo L, Ryan AK, Hooshmand F, O’Connell SM, Keithley EM, Rapaport DH, Ryan AF, Rosenfeld MG. Role of transcription factors Brn-3.1 and Brn-3.2 in auditory and visual system development. Nature. 1996;381 (6583):603–606. doi: 10.1038/381603a0. [DOI] [PubMed] [Google Scholar]
- 12.Xiang M, Gao WQ, Hasson T, Shin JJ. Requirement for Brn-3c in maturation and survival, but not in fate determination of inner ear hair cells. Development. 1998;125 (20):3935–3946. doi: 10.1242/dev.125.20.3935. [DOI] [PubMed] [Google Scholar]
- 13.Vahava O, Morell R, Lynch ED, Weiss S, Kagan ME, Ahituv N, Morrow JE, Lee MK, Skvorak AB, Morton CC, Blumenfeld A, Frydman M, Friedman TB, King MC, Avraham KB. Mutation in transcription factor POU4F3 associated with inherited progressive hearing loss in humans. Science. 1998;279 (5358):1950–1954. doi: 10.1126/science.279.5358.1950. [DOI] [PubMed] [Google Scholar]
- 14.Collin RW, Chellappa R, Pauw RJ, Vriend G, Oostrik J, van Drunen W, Huygen PL, Admiraal R, Hoefsloot LH, Cremers FP, Xiang M, Cremers CW, Kremer H. Missense mutations in POU4F3 cause autosomal dominant hearing impairment DFNA15 and affect subcellular localization and DNA binding. Hum Mutat. 2008;29 (4):545–554. doi: 10.1002/humu.20693. [DOI] [PMC free article] [PubMed] [Google Scholar]
- 15.Masuda M, Dulon D, Pak K, Mullen LM, Li Y, Erkman L, Ryan AF. Regulation of POU4F3 gene expression in hair cells by 5′ DNA in mice. Neuroscience. 2011;197:48–64. doi: 10.1016/j.neuroscience.2011.09.033. S0306-4522(11)01087-6 [pii] [DOI] [PMC free article] [PubMed] [Google Scholar]
- 16.Masuda M, Pak K, Chavez E, Ryan AF. TFE2 and GATA3 enhance induction of POU4F3 and myosin VIIa positive cells in nonsensory cochlear epithelium by ATOH1. Dev Biol. 2012;372 (1):68–80. doi: 10.1016/j.ydbio.2012.09.002. S0012-1606(12)00506-4 [pii] [DOI] [PMC free article] [PubMed] [Google Scholar]
- 17.Parker M, Brugeaud A, Edge AS. Primary culture and plasmid electroporation of the murine organ of Corti. J Vis Exp. 2010;(36) doi: 10.3791/1685. 1685 [pii] [DOI] [PMC free article] [PubMed] [Google Scholar]
- 18.Hasson T, Gillespie PG, Garcia JA, MacDonald RB, Zhao Y, Yee AG, Mooseker MS, Corey DP. Unconventional myosins in inner-ear sensory epithelia. J Cell Biol. 1997;137 (6):1287–1307. doi: 10.1083/jcb.137.6.1287. [DOI] [PMC free article] [PubMed] [Google Scholar]
- 19.Murray JW, Thosani AJ, Wang P, Wolkoff AW. Heterogeneous accumulation of fluorescent bile acids in primary rat hepatocytes does not correlate with their homogenous expression of ntcp. Am J Physiol Gastrointest Liver Physiol. 2011;301 (1):G60–68. doi: 10.1152/ajpgi.00035.2011. ajpgi.00035.2011 [pii] [DOI] [PMC free article] [PubMed] [Google Scholar]
- 20.Klisch TJ, Xi Y, Flora A, Wang L, Li W, Zoghbi HY. In vivo Atoh1 targetome reveals how a proneural transcription factor regulates cerebellar development. Proc Natl Acad Sci U S A. 2011;108 (8):3288–3293. doi: 10.1073/pnas.1100230108. 1100230108 [pii] [DOI] [PMC free article] [PubMed] [Google Scholar]
- 21.Leonard JH, Cook AL, Van Gele M, Boyle GM, Inglis KJ, Speleman F, Sturm RA. Proneural and proneuroendocrine transcription factor expression in cutaneous mechanoreceptor (Merkel) cells and Merkel cell carcinoma. Int J Cancer. 2002;101 (2):103–110. doi: 10.1002/ijc.10554. [DOI] [PubMed] [Google Scholar]
- 22.Gazit R, Krizhanovsky V, Ben-Arie N. Math1 controls cerebellar granule cell differentiation by regulating multiple components of the Notch signaling pathway. Development. 2004;131(4):903–913. doi: 10.1242/dev.00982131/4/903. [pii] [DOI] [PubMed] [Google Scholar]
- 23.Yang Q, Bermingham NA, Finegold MJ, Zoghbi HY. Requirement of Math1 for secretory cell lineage commitment in the mouse intestine. Science. 2001;294(5549):2155–2158. doi: 10.1126/science.1065718. 294/5549/2155 [pii] [DOI] [PubMed] [Google Scholar]
- 24.Sekine A, Akiyama Y, Yanagihara K, Yuasa Y. Hath1 up-regulates gastric mucin gene expression in gastric cells. Biochem Biophys Res Commun. 2006;344 (4):1166–1171. doi: 10.1016/j.bbrc.2006.03.238. S0006-291X(06)00795-9 [pii] [DOI] [PubMed] [Google Scholar]
- 25.Ma Q. Transcriptional regulation of neuronal phenotype in mammals. J Physiol. 2006;575 (Pt 2):379–387. doi: 10.1113/jphysiol.2006.113449. jphysiol.2006.113449 [pii] [DOI] [PMC free article] [PubMed] [Google Scholar]
- 26.Kopecky BJ, Decook R, Fritzsch B. N-Myc and L-Myc are essential for hair cell formation but not maintenance. Brain Res. 2012;1484:1–14. doi: 10.1016/j.brainres.2012.09.027. S0006-8993(12)01509-0 [pii] [DOI] [PMC free article] [PubMed] [Google Scholar]
- 27.Blackwood EM, Eisenman RN. Max: a helix-loop-helix zipper protein that forms a sequence-specific DNA-binding complex with Myc. Science. 1991;251 (4998):1211–1217. doi: 10.1126/science.2006410. [DOI] [PubMed] [Google Scholar]
- 28.Kopecky B, Santi P, Johnson S, Schmitz H, Fritzsch B. Conditional deletion of N-Myc disrupts neurosensory and non-sensory development of the ear. Dev Dyn. 2011;240 (6):1373–1390. doi: 10.1002/dvdy.22620. [DOI] [PMC free article] [PubMed] [Google Scholar]
- 29.Romand R, Hirning-Folz U, Ehret G. N-myc expression in the embryonic cochlea of the mouse. Hear Res. 1994;72 (1–2):53–58. doi: 10.1016/0378-5955(94)90205-4. [DOI] [PubMed] [Google Scholar]
- 30.Dominguez-Frutos E, Lopez-Hernandez I, Vendrell V, Neves J, Gallozzi M, Gutsche K, Quintana L, Sharpe J, Knoepfler PS, Eisenman RN, Trumpp A, Giraldez F, Schimmang T. N-myc controls proliferation, morphogenesis, and patterning of the inner ear. J Neurosci. 2011;31 (19):7178–7189. doi: 10.1523/JNEUROSCI.0785-11.2011. 31/19/7178 [pii] [DOI] [PMC free article] [PubMed] [Google Scholar]
- 31.Kopecky BJ, Jahan I, Fritzsch B. Correct timing of proliferation and differentiation is necessary for normal inner ear development and auditory hair cell viability. Dev Dyn. 2013;242 (2):132–147. doi: 10.1002/dvdy.23910. [DOI] [PMC free article] [PubMed] [Google Scholar]
- 32.Knoepfler PS, Kenney AM. Neural precursor cycling at sonic speed: N-Myc pedals, GSK-3 brakes. Cell Cycle. 2006;5(1):47–52. doi: 10.4161/cc.5.1.2292. 2292 [pii] [DOI] [PubMed] [Google Scholar]
- 33.Agrawal P, Yu K, Salomon AR, Sedivy JM. Proteomic profiling of Myc-associated proteins. Cell Cycle. 2010;9(24):4908–4921. doi: 10.4161/cc.9.24.14199. 14199 [pii] [DOI] [PMC free article] [PubMed] [Google Scholar]
- 34.Sharrocks AD. The ETS-domain transcription factor family. Nat Rev Mol Cell Biol. 2001;2(11):827–837. doi: 10.1038/35099076. 35099076 [pii] [DOI] [PubMed] [Google Scholar]
- 35.Hollenhorst PC, McIntosh LP, Graves BJ. Genomic and biochemical insights into the specificity of ETS transcription factors. Annu Rev Biochem. 2011;80:437–471. doi: 10.1146/annurev.biochem.79.081507.103945. [DOI] [PMC free article] [PubMed] [Google Scholar]
- 36.Hsu T, Trojanowska M, Watson DK. Ets proteins in biological control and cancer. J Cell Biochem. 2004;91 (5):896–903. doi: 10.1002/jcb.20012. [DOI] [PMC free article] [PubMed] [Google Scholar]
- 37.Delattre O, Zucman J, Melot T, Garau XS, Zucker JM, Lenoir GM, Ambros PF, Sheer D, Turc-Carel C, Triche TJ, et al. The Ewing family of tumors--a subgroup of small-round-cell tumors defined by specific chimeric transcripts. N Engl J Med. 1994;331 (5):294–299. doi: 10.1056/NEJM199408043310503. [DOI] [PubMed] [Google Scholar]
- 38.Dang W, Sun XH, Sen R. ETS-mediated cooperation between basic helix-loop-helix motifs of the immunoglobulin mu heavy-chain gene enhancer. Mol Cell Biol. 1998;18 (3):1477–1488. doi: 10.1128/mcb.18.3.1477. [DOI] [PMC free article] [PubMed] [Google Scholar]
- 39.Maira SM, Wurtz JM, Wasylyk B. Net (ERP/SAP2) one of the Ras-inducible TCFs, has a novel inhibitory domain with resemblance to the helix-loop-helix motif. EMBO J. 1996;15 (21):5849–5865. [PMC free article] [PubMed] [Google Scholar]
- 40.Wang CY, Petryniak B, Ho IC, Thompson CB, Leiden JM. Evolutionarily conserved Ets family members display distinct DNA binding specificities. J Exp Med. 1992;175 (5):1391–1399. doi: 10.1084/jem.175.5.1391. [DOI] [PMC free article] [PubMed] [Google Scholar]
- 41.Kelley MW. Regulation of cell fate in the sensory epithelia of the inner ear. Nat Rev Neurosci. 2006;7 (11):837–849. doi: 10.1038/nrn1987. nrn1987 [pii] [DOI] [PubMed] [Google Scholar]
- 42.Zine A, Aubert A, Qiu J, Therianos S, Guillemot F, Kageyama R, de Ribaupierre F. Hes1 and Hes5 activities are required for the normal development of the hair cells in the mammalian inner ear. J Neurosci. 2001;21(13):4712–4720. doi: 10.1523/JNEUROSCI.21-13-04712.2001. 21/13/4712 [pii] [DOI] [PMC free article] [PubMed] [Google Scholar]
- 43.Zheng JL, Shou J, Guillemot F, Kageyama R, Gao WQ. Hes1 is a negative regulator of inner ear hair cell differentiation. Development. 2000;127 (21):4551–4560. doi: 10.1242/dev.127.21.4551. [DOI] [PubMed] [Google Scholar]
- 44.Ma Q, Chen Z, del Barco Barrantes I, de la Pompa JL, Anderson DJ. neurogenin1 is essential for the determination of neuronal precursors for proximal cranial sensory ganglia. Neuron. 1998;20(3):469–482. doi: 10.1016/s0896-6273(00)80988-5. S0896-6273(00)80988-5 [pii] [DOI] [PubMed] [Google Scholar]
- 45.Liu M, Pereira FA, Price SD, Chu MJ, Shope C, Himes D, Eatock RA, Brownell WE, Lysakowski A, Tsai MJ. Essential role of BETA2/NeuroD1 in development of the vestibular and auditory systems. Genes Dev. 2000;14 (22):2839–2854. doi: 10.1101/gad.840500. [DOI] [PMC free article] [PubMed] [Google Scholar]
- 46.Bertrand N, Castro DS, Guillemot F. Proneural genes and the specification of neural cell types. Nat Rev Neurosci. 2002;3(7):517–530. doi: 10.1038/nrn874. nrn874 [pii] [DOI] [PubMed] [Google Scholar]
- 47.Uchikawa M, Kamachi Y, Kondoh H. Two distinct subgroups of Group B Sox genes for transcriptional activators and repressors: their expression during embryonic organogenesis of the chicken. Mech Dev. 1999;84(1–2):103–120. doi: 10.1016/s0925-4773(99)00083-0. S0925-4773(99)00083-0 [pii] [DOI] [PubMed] [Google Scholar]
- 48.Dabdoub A, Puligilla C, Jones JM, Fritzsch B, Cheah KS, Pevny LH, Kelley MW. Sox2 signaling in prosensory domain specification and subsequent hair cell differentiation in the developing cochlea. Proc Natl Acad Sci U S A. 2008;105 (47):18396–18401. doi: 10.1073/pnas.0808175105. 0808175105 [pii] [DOI] [PMC free article] [PubMed] [Google Scholar]
- 49.Neves J, Uchikawa M, Bigas A, Giraldez F. The prosensory function of Sox2 in the chicken inner ear relies on the direct regulation of Atoh1. PLoS One. 2012;7(1):e30871. doi: 10.1371/journal.pone.0030871. PONE-D-11-23386 [pii] [DOI] [PMC free article] [PubMed] [Google Scholar]
- 50.Tan K, Moreno-Hagelsieb G, Collado-Vides J, Stormo GD. A comparative genomics approach to prediction of new members of regulons. Genome Res. 2001;11 (4):566–584. doi: 10.1101/gr.149301. [DOI] [PMC free article] [PubMed] [Google Scholar]
- 51.Hu X, Huang J, Feng L, Fukudome S, Hamajima Y, Lin J. Sonic hedgehog (SHH) promotes the differentiation of mouse cochlear neural progenitors via the Math1-Brn3.1 signaling pathway in vitro. J Neurosci Res. 2010;88 (5):927–935. doi: 10.1002/jnr.22286. [DOI] [PMC free article] [PubMed] [Google Scholar]
- 52.Pan N, Jahan I, Kersigo J, Duncan JS, Kopecky B, Fritzsch B. A novel Atoh1 “self-terminating” mouse model reveals the necessity of proper Atoh1 level and duration for hair cell differentiation and viability. PLoS One. 2012;7(1):e30358. doi: 10.1371/journal.pone.0030358. PONE-D-11-19095 [pii] [DOI] [PMC free article] [PubMed] [Google Scholar]
- 53.Poss ZC, Ebmeier CC, Taatjes DJ. The Mediator complex and transcription regulation. Crit Rev Biochem Mol Biol. 2013;48(6):575–608. doi: 10.3109/10409238.2013.840259. [DOI] [PMC free article] [PubMed] [Google Scholar]
- 54.Kang HJ, Kendrick S, Hecht SM, Hurley LH. The transcriptional complex between the BCL2 i-motif and hnRNP LL is a molecular switch for control of gene expression that can be modulated by small molecules. J Am Chem Soc. 2014;136(11):4172–4185. doi: 10.1021/ja4109352. [DOI] [PMC free article] [PubMed] [Google Scholar]
- 55.Gabrielian A, Vlahovicek K, Pongor S. Distribution of sequence-dependent curvature in genomic DN. FEBS Letters. 1997;406:69–74. doi: 10.1016/s0014-5793(97)00236-6. [DOI] [PubMed] [Google Scholar]
Associated Data
This section collects any data citations, data availability statements, or supplementary materials included in this article.
Supplementary Materials
The number of pou4f3/GFP+ cells observed in the GER following transfection with plasmids encoding hATOH1 alone or the targeted TFs in combination with hATOH1. GER cells observed in the apical turn (upper), in the middle turn (middle) and in the basal turn (lower) of the sensory epithelium are shown separately. * (increase) and # (decrease) indicate a significant difference at p < 0.05 from hATOH1 alone by one-way ANOVA with Dunnett’s multiple comparison test. Error bars represent SD.
The number of Myo7A+ cells observed in the GER following transfection with plasmids encoding hATOH1 alone or the targeted TFs in combination with hATOH1. GER cells observed in the apical turn (upper), in the middle turn (middle) and in the basal turn (lower) of the sensory epithelium, are shown separately. * (increase) and # (decrease) indicate a significant difference at p < 0.05 from hATOH1 alone by one-way ANOVA with Dunnett’s multiple comparison test. Error bars represent SD.