

Abstract
The pharmacokinetics, mass balance, and metabolism of deleobuvir, a hepatitis C virus (HCV) polymerase inhibitor, were assessed in healthy subjects following a single oral dose of 800 mg of [14C]deleobuvir (100 μCi). The overall recovery of radioactivity was 95.2%, with 95.1% recovered from feces. Deleobuvir had moderate to high clearance, and the half-life of deleobuvir and radioactivity in plasma were ∼3 h, indicating that there were no metabolites with half-lives significantly longer than that of the parent. The most frequently reported adverse events (in 6 of 12 subjects) were gastrointestinal disorders. Two major metabolites of deleobuvir were identified in plasma: an acyl glucuronide and an alkene reduction metabolite formed in the gastrointestinal (GI) tract by gut bacteria (CD 6168), representing ∼20% and 15% of the total drug-related material, respectively. Deleobuvir and CD 6168 were the main components in the fecal samples, each representing ∼30 to 35% of the dose. The majority of the remaining radioactivity found in the fecal samples (∼21% of the dose) was accounted for by three metabolites in which deleobuvir underwent both alkene reduction and monohydroxylation. In fresh human hepatocytes that form biliary canaliculi in sandwich cultures, the biliary excretion for these excretory metabolites was markedly higher than that for deleobuvir and CD 6168, implying that rapid biliary elimination upon hepatic formation may underlie the absence of these metabolites in circulation. The low in vitro clearance was not predictive of the observed in vivo clearance, likely because major deleobuvir biotransformation occurred by non-CYP450-mediated enzymes that are not well represented in hepatocyte-based in vitro models.
INTRODUCTION
Each year, 3 to 4 million people become infected with hepatitis C virus (HCV), and approximately 130 to 150 million people are currently chronically infected worldwide. About 350,000 to 500,000 people die every year from HCV-related liver disease (1). At least 6 genotypes of HCV have been identified (2), with genotype 1 being the most prevalent (75%) in the United States (3–5). For many years, the treatment regimen consisted of a combination of pegylated interferon alfa-2a and ribavirin. Recently, the addition of direct-acting antiviral therapies, such as boceprevir, telaprevir, sofosbuvir, simeprevir, and daclatasvir, to this combination treatment has been shown to significantly improve the sustained viral response (SVR) in both treatment-naive and treatment-experienced patients with HCV genotype 1 (6–10). Deleobuvir (BI 207127) is a novel, specific, potent, and reversible nonnucleoside analog inhibitor of HCV nonstructural 5B protein (NS5B) RNA polymerase that binds covalently to thumb-pocket I of NS5B, thereby achieving potent and specific antiviral activity (11). Deleobuvir, in combination with faldaprevir and ribavirin for treatment of HCV infection, has achieved high SVR rates in treatment-naive and treatment-experienced patients with chronic genotype 1 infection (12).
A clinical study in healthy male human volunteers was conducted to determine the pharmacokinetics of deleobuvir and the total radioactivity, including mass balance, excretion pathways, and metabolism after oral administration of a single dose of [14C]deleobuvir. Although there are known differences in deleobuvir dispositions between healthy volunteers and HCV-infected patients, this study was conducted in healthy volunteers due to ethical reasons, as a single-dose study in HCV-positive patients presents a risk for developing cross-resistance via viral mutation. The pharmacokinetics of the two major circulating metabolites identified in this study, namely, deleobuvir-acyl glucuronide, or deleobuvir AG, and CD 6168 (an alkene reduction metabolite), were also monitored using synthetic standards. CD 6168 also has a carboxylic acid group with the potential to form an acyl glucuronide. Hence, using a synthetic standard, the pharmacokinetics of this secondary metabolite, CD 6168-acyl glucuronide (CD 6168-AG), was also monitored, since regulatory guidance suggests that some acyl glucuronides may have implications for adverse events, such as idiosyncratic drug reactions.
In vitro metabolic stability and biliary elimination studies were conducted with deleobuvir during development using in vitro hepatocyte models. A retrospective comparison was also conducted to assess whether the in vitro clearance data would elucidate the pathways of disposition observed in vivo.
MATERIALS AND METHODS
Subjects.
Twelve healthy male subjects age 18 to 55 years, with a body mass index of 18.5 to 29.9 kg/m2 and who were nonsmokers, were enrolled in the study. All subjects provided written informed consent prior to participation. The exclusion criteria included any evidence of clinically relevant disease, history of gastrointestinal surgery (except appendectomy), central nervous system (CNS) and neurological disorders, marked baseline prolongation of the QT/QTc interval, history of photosensitivity, irregular defecation pattern, orthostatic hypotension, hypersensitivity, and drug, tobacco, or alcohol abuse. Prescription drugs, including antibiotics, over-the-counter drugs, herbal preparations, and supplements, foods or beverages containing caffeine, and grapefruit and citrus juices were restricted within 14 days prior to the administration of the study drug, as was the prior use of long-half-life (>24 h) drugs (within 1 month) and participation in another trial with an investigational drug (within 2 months).
Clinical study design.
This was a phase I, single-arm, and open-label clinical study to investigate the disposition of deleobuvir in healthy male subjects. The study was conducted at Covance (Madison, WI) in accordance with the International Conference on Harmonisation guideline for good clinical practice and the principles of the Declaration of Helsinki, and it was reviewed and approved by the local ethics committee. The study was also conducted in accordance with the Wisconsin Department of Health Services (DHS) radiation protection division regulations in DHS 157.63(1). The subjects received a single oral dose of 800 mg of [14C]deleobuvir. All doses were administered approximately 30 min after a standard clinic breakfast (50% carbohydrate, 30% fat, and 20% protein) to improve the gastrointestinal (GI) tolerability of deleobuvir and replicate routine clinical use. Standard meals and evening snacks were served approximately 4.5, 8, and 10.5 h after dosing. The subjects remained in the study center up to day 10 after dosing, when ≥90% of the administered radioactivity had been recovered or no more than 1% of the administered dose was recovered over 2 consecutive 24-h periods.
Study drugs and other chemicals.
Deleobuvir and [14C]deleobuvir were manufactured by Boehringer Ingelheim Pharmaceuticals, Inc., Ridgefield, CT, USA. The structure of deleobuvir and position of the 14C label are shown in Fig. 1. Deleobuvir and [14C]deleobuvir were supplied in powder form. [14C]Deleobuvir and deleobuvir were formulated into a solution for oral administration within 24 h prior to dosing. The formulation had a predose radiopurity of 96.4%, as determined by high-performance liquid chromatography (HPLC) coupled with flow scintillation detection. The specific activity of [14C]deleobuvir was 80.41 μCi/mg. The nominal [14C]deleobuvir dose of 100 μCi for each subject accommodated a mean of 798 mg of unlabeled deleobuvir on a free-form equivalent basis, to make the 800-mg target dose for each subject. The oral solution formulation excipients included sodium dodecyl sulfate, Tris(hydroxymethyl) aminomethane, and polyethylene glycol 400. The specific gravity of the final formulation was measured, and each dose was administered by weight. The actual dose administered for each patient, determined after an analysis of the remaining liquid in the bottle, was used for all relevant calculations.
FIG 1.
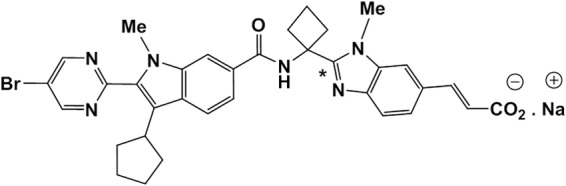
Structure of the sodium salt of deleobuvir. The asterisk denotes the location of the 14C label.
The standards for deleobuvir-AG, CD 6168, and CD 6168-AG quantitation were synthesized at Boehringer Ingelheim Pharmaceuticals, Inc. All other chemicals and reagents were purchased from Sigma or an equivalent supplier.
Sample collection.
The blood samples used for pharmacokinetics and metabolite profiling were collected in tubes containing sodium citrate to ensure the stability of the acyl glucuronide metabolite (0.355 ml of 2 M citric acid was added to each blood-drawing tube containing 7.4 ml of blood). The blood samples for plasma analyte pharmacokinetics and blood and plasma radioactivity were collected prior to dosing and at the following time points after [14C]deleobuvir administration: 0.5, 1, 1.5, 2, 2.5, 3, 3.5, 4, 5, 6, 8, 10, 12, 15, 24, 36, and 48 h, as well as at 24-h intervals thereafter until the end of the study period. Plasma was prepared by centrifugation of the blood samples at approximately 2,000 × g to 4,000 × g for 10 min at 4 to 8°C. Metabolite profiling was conducted with plasma samples taken at 2, 4, 6, 8, 10, and 12 h after the [14C]deleobuvir dose.
The urine samples were collected predose and then at the following intervals after [14C]deleobuvir dosing: 0 to 4 h, 4 to 8 h, 8 to 12 h, 12 to 24 h, and 24 to 36 h. The remaining urine samples were collected at 24-h intervals thereafter until the end of the study period. A fecal sample was collected within 24 h prior to dosing, and then all remaining fecal samples were collected over 24-h intervals until the end of the study period. The urine samples were collected in 1-liter capacity containers containing 13.5 ml of a 2 M citric acid solution (to stabilize any acyl glucuronides present) and 10 ml of a 10% polysorbate (Tween 20) solution. The times of fecal collections and weights of the samples were recorded.
The saliva samples were collected predose and at 1, 2, 4, 6, 10, 12, and 24 h after the [14C]deleobuvir dose.
The plasma and urine samples collected for the determination of concentrations of deleobuvir and its metabolites were stored at −70°C until analysis. The plasma, urine, fecal, and saliva samples used in metabolite profiling or radioactivity measurement were stored at or below −20°C until analysis.
Safety assessments.
Safety was assessed throughout the study by an evaluation of the laboratory safety test results, 12-lead electrocardiograms (EKGs), blood pressure and pulse rate measurements, and monitoring for adverse events.
Radioactivity measurement.
Briefly, blood, plasma, saliva, urine, and fecal samples were analyzed for radioactivity by liquid scintillation counting (LSC). Each sample was homogenized prior to radioanalysis. All samples were analyzed in duplicate if the sample size allowed. The fecal samples were diluted with ethanol-water prior to homogenization. The blood and fecal samples were combusted in a model 307 sample oxidizer (Packard Instrument Company), and the resulting 14CO2 was trapped in a mixture of Permafluor and Carbo-Sorb prior to LSC. All samples were analyzed for radioactivity in model 2900TR liquid scintillation counters (Packard Instrument Company) for ≥5 min or 100,000 counts using an Ultima Gold XR scintillation cocktail (PerkinElmer, Inc., Boston, MA). Total radioactivity in blood and plasma was expressed as ng equivalents (ng Eq) of deleobuvir. The lower limits of quantitation were 339 ng Eq/ml (blood), 288 ng Eq/ml (plasma), 279 ng Eq/ml (urine), 1,791 ng Eq/ml (feces), and 356 ng Eq/ml (saliva). For reporting, ng Eq/ml was converted to nmol Eq/ml using the molecular weight for radiolabeled deleobuvir.
Blood cell partitioning.
Using concentrations in the whole blood, plasma, and the hematocrit, the ratio of the concentration of total radioactivity in blood cells and plasma (Cbloodcells/Cplasma) was calculated according to the following equation at several time points following deleobuvir administration:
| (1) |
where Cbloodcells is the concentration in blood cells, Cplasma is the concentration in plasma, Cblood is the concentration in whole blood, and HC is the hematocrit level (determined using standard laboratory procedures).
Deleobuvir plasma assays.
The concentrations of deleobuvir, CD 6168, deleobuvir-AG, and CD 6168-AG in plasma were determined using two validated liquid chromatography-tandem mass spectrometry (LC-MS/MS) methods, using assay 1 for deleobuvir and CD 6168 and assay 2 for deleobuvir-AG and CD 6168-AG.
Assay 1.
In assay 1, the plasma samples were prepared using 96-well supported liquid extraction (SLE) plates. A supported liquid extraction (SLE) plate (Isolute SLE+ 96-well plate; Biotage, Charlotte, NC) was equilibrated with the SLE+ sorbent, and deleobuvir and CD 6168 were eluted with isopropyl acetate. The samples were evaporated to dryness, reconstituted with 0.1% acetic acid in a water-acetonitrile mixture (60:40 [vol/vol]), and then injected onto LC-MS for analysis. Chromatographic separation was achieved using a 50 mm by 2.0 mm, 5-μm-particle size Gemini C18 column (Phenomenex, Inc., Torrance, CA). The mobile phase consisted of 1 mM ammonium acetate–0.1% acetic acid in a water-acetonitrile mixture (60:40 [vol/vol]); the run time was 3 min. The detector used was an API 4000 triple quadrupole mass spectrometer (AB Sciex, Framingham, MA), equipped with an electrospray ion source, which was operated in multiple reaction monitoring (MRM) mode. The key MS operating parameters included an IonSpray voltage of 4,500 V and an ion source temperature of 400°C. Calibration standard curves with a range of 15.0 to 15,000 ng/ml for both deleobuvir and CD 6168 in human plasma were generated using a weighted 1/x2 quadratic regression. Quality control samples were used at concentrations of 45.0, 750, and 12,000 ng/ml.
Assay 2.
In assay 2, the plasma samples were prepared using a protein precipitation extraction (PPE) procedure in 96-well plates. The proteins were precipitated by adding acetonitrile to the samples. After centrifugation, the supernatant was diluted with an acetic acid-water mixture and injected onto an LC-MS for analysis. Chromatographic separation was achieved using a 100 mm by 2.0 mm, 3-μm-particle size Gemini-NX column (Phenomenex, Inc., Torrance, CA). Mobile phase A consisted of 3 mM ammonium acetate–0.1% acetic acid in water, and mobile phase B consisted of 3 mM ammonium acetate–0.2% acetic acid in acetonitrile. The run time was 4 min with a gradient elution program. The detector used was an API 4000 triple quadrupole mass spectrometer (AB Sciex, Framingham, MA) equipped with an electrospray ion source, which was operated in MRM mode. The key MS operating parameters included an IonSpray voltage of 5,000 V and an ion source temperature of 550°C. Calibration standard curves with a range of 50.0 to 50,000 ng/ml for deleobuvir-AG and a range of 10.0 to 10,000 ng/ml for CD 6168-AG in human plasma were generated using a weighted 1/x2 quadratic regression. Quality control samples were used at concentrations of 150, 2,510, and 20,000 ng/ml for deleobuvir-AG and 30.0, 500, and 4,000 ng/ml for CD 6168-AG.
The validation of the LC-MS/MS methods for quantitation included a stability assessment for the collection, storage, and freeze-thaw conditions.
Pharmacokinetic analysis.
Pharmacokinetic analyses of deleobuvir in plasma and radioactivity in blood and plasma were conducted by noncompartmental techniques using WinNonlin version 5.2 (Pharsight, Mountain View, CA, USA). The actual sampling times were used for all calculations except for the predose times, which were set to zero. The peak concentration of drug (Cmax) and time to first occurrence of Cmax (Tmax) were determined directly from the reported data for all analytes. The terminal elimination rate constant (λz) for deleobuvir was determined from a linear regression of the natural logarithm of the concentrations versus time over the terminal log-linear disposition portion of the concentration-time profiles (including ≥3 data points). The terminal elimination half-life (t1/2) was calculated as ln2/λz. The area under the concentration-time curve (AUC) was calculated using the linear-up/log-down trapezoidal method. If the analyte concentration was equal to or higher than the preceding concentration, the linear trapezoidal method was used, and if the analyte concentration was smaller than the preceding concentration, the logarithmic method was used. Apparent clearance after oral administration (CL/F) was calculated as the dose/AUC0–∞ (AUC from 0 h to infinity). The apparent volume of distribution after oral administration (Vz/F) was calculated as CL/F/λz. The total amounts of radioactivity excreted in the urine and feces are presented as a percentage of the [14C]deleobuvir dose (Fig. 2). Summary statistics are reported for all parameters (Table 1).
FIG 2.

Geometric mean (and standard deviation) cumulative excretion of radioactivity in urine and feces (% of dose) at specified time intervals after a single target 800-mg (100-μCi) oral dose of [14C]deleobuvir to healthy male subjects.
TABLE 1.
Summary of pharmacokinetic parameters for deleobuvir and its metabolites, deleobuvir-AG, CD 6168, and CD 6168-AG, and total radioactivity equivalents in plasmaa
| PK parameter | gMean (g%CV) |
||||
|---|---|---|---|---|---|
| Deleobuvir | Deleobuvir-AG | CD 6168 | CD 6168-AG | [14C]deleobuvir equivalentb | |
| AUC0–∞ (nmol · h/liter) | 19,300 (56.5) | 8,380 (44.8) | 5,240 (55.2) | 601 (80.8) | 25,800 (46.1) |
| Cmax (nmol/liter) | 3,620 (54.2) | 1,330 (45.5) | 824 (44.0) | 88.5 (74.0) | 4280 (42.3) |
| Tmax (h) (median [minimum–maximum]) | 3.50 (2.50–5.03) | 4.50 (3.50–5.03) | 4.00 (3.00–6.00) | 5.00 (3.50–6.00) | 4.00 (2.50–5.03) |
| t1/2 (h) | 2.84 (28.5) | 3.01 (30.5) | 2.90 (29.1) | 3.00 (40.6) | 2.89 (36.4) |
PK, pharmacokinetic; gMean, geometric mean; gCV%, geometric % coefficient of variation; n = 12 for all plasma PK parameters. Deleobuvir and its metabolites were quantitated by a validated LC-MS/MS method using synthetic standards.
Radioactivity counts were converted into deleobuvir equivalents using the [14C]deleobuvir molecular weight.
Metabolite sample extraction.
The 2-, 4-, 6-, 8-, 10-, and 12-h plasma samples from all subjects were pooled for metabolite profiling. Samples from the same time point were pooled across all subjects with equal volumes, which gave six plasma pools corresponding to 2, 4, 6, 8, 10, and 12 h, respectively. To each pooled plasma sample, equal volumes of water and 1% volume of acetic acid were added. The diluted samples were then subjected to solid-phase extraction (SPE) with Oasis MCX35cc/6g SPE cartridges (Waters, Milford, MA), which had been preconditioned with methanol and 0.1% acetic acid. After loading, the SPE cartridges were washed sequentially with 0.1% acetic acid and 10%, 20%, or 50% methanol containing 0.1% acetic acid, and the samples were then eluted with 0.5% ammonium hydroxide in methanol. The eluate was spiked with 2% glacial acetic acid and was evaporated to approximately 0.1 ml to 0.5 ml using a miVac Quattro concentrator at 30°C (Genevac-SP Industries, Stone Ridge, NY). The samples were reconstituted with acetonitrile–methanol–0.1% acetic acid. The overall extraction recovery from the plasma ranged from 92.1% to 101.4%.
The urine samples were collected over 216 h after the administration of [14C]deleobuvir. Due to the extremely low urine radioactivity, the urine samples collected from 0 to 8 h from all subjects were combined for metabolite profiling. Equal percentages (by volume) of the urine samples from each subject were combined to prepare the pool. This pooled sample represented essentially 57.6% of the total radioactivity ultimately recovered in urine. A 100-ml aliquot of pooled urine was extracted via SPE with Oasis MCX SPE cartridges (35 ml/6 g). After loading, the SPE cartridges were washed sequentially and processed as described above. The overall extraction recovery from the urine pool was 95.6%.
The fecal samples were collected over 216 h after the administration of [14C]deleobuvir. For metabolite profiling, fecal samples collected up to 168 h were pooled for each subject, and this represented 94.6% of the total radioactivity ultimately recovered in feces. A 3.28-ml aliquot of the pooled fecal homogenate was mixed with 6 ml of 1% formic acid. The sample was mixed for 30 min on a Titan plate shaker (Lab Line Instruments, Batavia, IL) and then centrifuged at 10,000 × g for 10 min using an Avanti J-E centrifuge (Beckman, Fullerton, CA). After the supernatant was separated, the pellet was extracted with 5 ml of 1% formic acid in acetonitrile. The extract was combined with the supernatant and processed as described above. The overall extraction recovery from the fecal pool was 99.3%.
Metabolite profiling and identification.
Metabolite profiling and metabolite identification were conducted for the plasma, urine, and fecal samples using an LC-radiochromatography-MS/MS system. This system consisted of an Agilent 1200 high-performance LC system (Agilent, Palo Alto, CA, USA) with a Thermo LTQ Orbitrap XL mass spectrometer (Thermo Scientific, San Jose, CA, USA) equipped with an electron spray ion source and a Gilson 204 fraction collector. The LC fractions were collected in 96-well ScintiPlates (PerkinElmer, Shelton, CT), which had solid scintillant imbedded. The plates were dried using a miVac modular concentrator at 35°C and then counted with a MicroBeta Trilux 1450 LSC and luminescence counter (PerkinElmer). Radiochromatograms were reconstructed using the ARC Data System software (AIM Research Co., Hockessin, DE). The MS data were processed with the Xcalibur 2.0 software (Thermo Scientific). Metabolite separation was achieved using a reversed-phase HPLC column (Waters Atlantis dC18, 150 mm by 3.9 mm, 3 μm; Waters, Milford, MA). Mobile phase A consisted of a 95:5 ratio of water to acetonitrile containing 0.1% acetic acid, and mobile phase B consisted of a 95:5 ratio of water to acetonitrile containing 0.1% acetic acid. The gradient conditions were as follows: 100% A at 0 min to 50% A over 50 min, and then to 0% A over 20 min, which was held for 10 min. The HPLC flow rate was 0.7 ml/min.
In vitro metabolic stability.
Human cryopreserved hepatocytes (Life Technologies) were rapidly thawed at 37°C and placed in a 24-well plate (1.0 × 10⁶ cells/well). After 15 min of acclimation, deleobuvir (0.1 and 1 μM final concentrations) was added to the cells. The cells were placed on a plate shaker at 37°C, and 50-μl aliquots were removed at several time points over 4 h, which were subsequently analyzed using LC-MS/MS. The intrinsic and hepatic clearance values were calculated from the half-life values (in min) using the well-stirred model by employing the following equations:
| (2) |
| (3) |
where Qh is species-specific hepatic blood flow, fu is the fraction of unbound drug (assumed to be 0.5), wt is weight, and CLint is the intrinsic clearance.
In vitro biliary clearance.
Biliary clearance and the biliary excretion index (BEI) values for deleobuvir and CD 6168 were assessed at Qualyst, Inc., using three preparations of sandwich-cultured hepatocytes, two of which were from fresh hepatocyte donors, and one of which used cryopreserved human hepatocytes (13, 14). The cells were preincubated for 20 min at 37°C with medium containing 4% bovine serum albumin (BSA) and the divalent cations Ca2+ and Mg2+ (plus buffer), which are required for the maintenance of the biliary canaliculi, or with medium devoid of the divalent cations (minus buffer). This was followed by incubation with deleobuvir (10 μM) in the plus buffer for 20 min. The hepatocytes were washed and lysed, and the lysates were analyzed by LC-MS/MS. The formation of deleobuvir-AG and CD 6168 was also measured in these lysates using authentic standards. The formation of hydroxyl metabolites M671/1, M671/2, and M671/3 from deleobuvir and M668/1, M668/2, and M668/3 from CD 6168 were monitored by MRM.
The in vitro biliary clearance (CLbiliary) was calculated using the following equation:
| (4) |
The %BEI was calculated using the following equation (with uptake measured in pmol/well):
| (5) |
In vitro protein binding.
The protein binding of deleobuvir to human plasma and human serum albumin was determined in vitro by equilibrium dialysis using Teflon dialysis cells and dialysis membranes (Spectra/Por), with a molecular weight cutoff of 12,000 to 14,000. Blank plasma spiked with [14C]deleobuvir at concentrations ranging from 0.1 to 40 μg/ml and a [14C]deleobuvir solution in phosphate buffer containing 4% human serum albumin at concentrations ranging from 0.3 to 100 μg/ml were utilized as a test matrix in this evaluation. The pH of both matrices was adjusted to 7.4 using 1 N sodium hydroxide. The final concentrations of ethanol in the plasma were ≤1%. The test matrix was added to one side of the dialysis cell, while 0.1 M sodium phosphate buffer (pH 7.4) was added to the other side. The dialysis cells were mixed and incubated at 37°C for 4 h, at which time equilibrium across the membrane was expected to be achieved, based on pilot studies. The plasma and buffer samples at each of the time points were collected, and the concentrations of [14C]deleobuvir were analyzed by liquid scintillation counting.
RESULTS
Subjects.
All 12 volunteers who were enrolled in the study completed the study. Of the 12 subjects entered in the trial, adverse events were reported for 6 (50.0%). Gastrointestinal disorders were the most frequently reported adverse event. All adverse events for the trial were of mild intensity. For 4 subjects (33.3%), adverse events were considered by the investigator to be drug related. All adverse events resolved by the end of the trial. There were no clinically significant changes in laboratory evaluations, vital sign measurements, or EKG measurements. Overall, the administration of a single dose of 800 mg [14C]deleobuvir was well tolerated.
Mass balance.
A mean of 95.1% of the dose was recovered in the fecal samples, and 0.137% was recovered in urine samples over all the collection intervals up to 216 h postdose, which was the last collection time point. Most (92%) of the administered radioactivity was recovered in the first 144 h. The levels of radioactivity were quantifiable through the last collection interval (ranging from 120 to 216 h postdose) for each subject in the fecal samples and fell below the limit of quantitation for all subjects by 36 h postdose in the urine samples. The overall geometric mean recovery of radioactivity in urine and fecal samples was 95.2% over the 216-h study, with recovery in individual subjects ranging from 93.2 to 97.2%. The cumulative percent radioactivity recovered in the urine and fecal samples is presented in Fig. 2.
Radioactivity in blood, plasma, and saliva samples.
The individual, mean, and geometric mean concentration-time exposure profiles for whole blood were very similar to the plasma exposure profiles, except for a slightly more rapid decline in the terminal phase in blood (Fig. 3A). The mean peak concentrations occurred at ∼4 h postdose for both matrices, with values of 3,970 nmol eq/liter and 4,280 nmol eq/liter for blood and plasma, respectively. The levels of radioactivity fell below the limit of quantitation for all subjects by 12 h postdose in blood and 24 h postdose in plasma. The geometric mean terminal half-lives in blood and plasma were 2.24 and 2.89 h, respectively. The amount of radioactivity was similar in plasma and blood, with mean blood-to-plasma ratios ranging from 0.847 to 1.01 at the time points through 12 h postdose. The maximum mean concentration of radioactivity in saliva was observed at 1 h postdose (1,090 nmol eq/liter). The levels of radioactivity in saliva fell below the limit of quantitation beyond 4 h postdose for all subjects.
FIG 3.

(A) Geometric mean radioactivity in blood and plasma and mean deleobuvir concentrations in plasma over time after a single target 800-mg (100-μCi) oral dose of [14C]deleobuvir to healthy male subjects (% coefficient of variation [%CV] for the geometric mean concentrations are not shown in order to enable a visual comparison of the central tendencies; the geometric %CV [gCV%] range for radioactivity is 33 to 56%, and that for deleobuvir is 41 to 97%). (B) Geometric mean plasma concentrations of deleobuvir and its metabolites over time after a single-target 800-mg (100-μCi) oral dose of [14C]deleobuvir to healthy male subjects (%CV for the geometric mean concentrations are not shown in order to enable visual comparison of the central tendencies. The gCV% ranges for individual plasma concentrations are as follows: 41 to 97% for deleobuvir, 33 to 56% for deleobuvir-AG, 34 to 97% for CD 6168, and 42 to 82% for CD 6168-AG).
The mean blood-to-plasma concentration ratios ranged from 0.789 to 1.12 through 12 h postdose, and the mean blood cell-to-plasma concentration ratios ranged from 0.543 to 1.27 through 12 h postdose. There was no relationship of the ratios to the time after dosing.
Deleobuvir and its metabolites in plasma and urine.
Deleobuvir and its three predominant metabolites were analyzed in plasma and urine by a validated HPLC-MS/MS method using synthetic standards. The urine and blood samples were acidified with citric acid at the time of collection to stabilize the two acyl glucuronide metabolites. After oral administration of a single 800-mg dose of [14C]deleobuvir, a pharmacokinetic assessment of deleobuvir and its metabolites deleobuvir-AG, CD 6168, and CD 6168-AG demonstrated similar time courses of plasma exposure for the parent compound and the metabolites, with Tmax values ranging from 3.5 to 5 h for the parent compound and all 3 metabolites (Table 1). A comparison of the total and peak exposures indicated that deleobuvir-AG is the major metabolite of deleobuvir, with AUC0–∞ and Cmax values of 43% and 37%, respectively, of the parent compound. For CD 6168, the corresponding values were 27% and 23%, and for CD 6168-AG, the values were 3.1% and 2.4%. The terminal half-life values were similar between deleobuvir (2.84 h) and its metabolites (3.01 h for deleobuvir-AG, 2.90 h for CD 6168, and 3.00 h for CD 6168-AG). The clearance (CL/F) and volume of distribution (Vz/F) for deleobuvir were 14.3 ml/min/kg of body weight and 245 liters, respectively. Urinary excretion was minimal for deleobuvir and its metabolites. For all 4 species, no more than a total of 0.05% of the administered dose was excreted into the urine. A comparison of the plasma concentration-time profiles for total radioactivity, deleobuvir, and the three metabolites is presented in Fig. 3B. The overall variability in plasma exposure was high for deleobuvir and its metabolites.
Metabolite profiles.
Metabolite profiling was conducted in plasma, urine, and fecal samples. A total of 12 metabolites were identified, and among these, M831/1, M655/1, M829/2, and M627/2 were confirmed using authentic standards. In addition, M667/2 (a methyl ester) was formed during sample preparation. Unchanged deleobuvir was the most abundant drug-related component in plasma and accounted for 49.5% to 74.3% of the plasma radioactivity (Table 2). There were two major metabolites, an acyl glucuronide conjugate of deleobuvir, M829/2 (15.2% to 25.6% of the plasma radioactivity), and the reduction metabolite M655/1 (7.5% to 24.9% of the plasma radioactivity). The remaining metabolites were much less abundant, including M829/1 (a deleobuvir glucuronide conjugate; 0.9% of the plasma radioactivity) and M627/2 (a carboxylic metabolite; 2.8% of the plasma radioactivity). Representative plasma radiochromatograms at three different time points are presented in Fig. 4.
TABLE 2.
Presence of deleobuvir and its metabolites in humans following oral dosing (800 mg, n = 12)
| Compound | % radioactivity in sample (concn) in plasma at indicated houra |
AUC0–12h |
Fecal samples |
|||||||
|---|---|---|---|---|---|---|---|---|---|---|
| 2 | 4 | 6 | 8 | 10 | 12 | Value (nmol · h/liter) | % total | % 14Cb | % dose | |
| Deleobuvir | 74.3 (1,750) | 65.6 | 60.2 | 53.6 | 51.3 | 49.5 | ND | ND | 32.6 | 30.4 |
| M671/1 | NDc | ND | ND | ND | ND | ND | ND | ND | 10.4 | 10.4 |
| M671/2 | ND | ND | ND | ND | ND | ND | ND | ND | 3.1 | 2.8 |
| M671/3 | ND | ND | ND | ND | ND | ND | ND | ND | 8.6 | 8.1 |
| M829/1 | ND | ND | 0.9 | ND | ND | ND | 49.2 | 0.2 | ND | ND |
| M655/1 (CD 6168) | 7.5 | 11.7 | 17.7 | 24.7 | 24.8 | 24.9 | 3590 | 15.3 | 37.1 | 34.6 |
| M829/2 (deleobuvir-AG) | 18.2 | 21.0 | 21.1 | 15.2 | 23.9 | 25.6 | 4740 | 20.2 | ND | ND |
| M627/2d | ND | ND | ND | 2.8 | ND | ND | 80.4 | 0.3 | 1.9 | 1.8 |
| M667/2 | ND | ND | ND | 3.6 | ND | ND | 105 | 0.4 | ND | |
| Total | 100 (2,350) | 98.3 (3,910) | 100 | 100 | 100 | 100 | 1,4800 | 63.0 | 93.7 | 87.4 |
% of plasma sample radioactivity.
% of total fecal radioactivity.
ND, not detected.
Artifact.
FIG 4.

Radiochromatograms for plasma samples showing deleobuvir and metabolites detected in plasma at 2 h (a), 8 h (b), and 12 h (c) (pooled sample) after the administration of [14C]deleobuvir.
In the fecal samples, deleobuvir accounted for an average of 32.6% of the fecal radioactivity (or 30.4% of the dose). The metabolite M655/1 accounted for 37.1% of the fecal radioactivity (or 34.6% of the dose). Other fecal metabolites included M671/1 (9.7% of the dose), M671/2 (2.8% of the dose), M671/3 (8.1% of the dose), and M627/2 (1.8% of the dose). The remaining fecal metabolites were each <1.3% of the dose. A representative fecal radiochromatogram is presented in Fig. 5. The metabolic pathways in humans are presented in Fig. 6.
FIG 5.
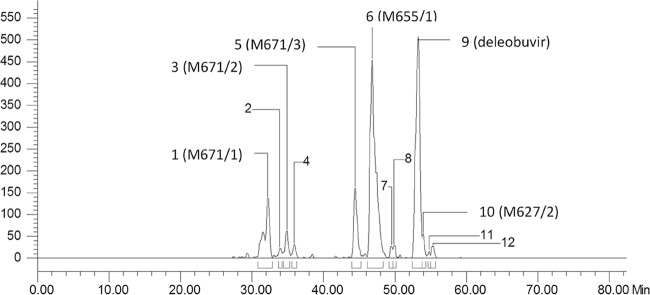
Radiochromatogram of fecal sample pool after the administration of [14C]deleobuvir.
FIG 6.

Proposed metabolic pathways of deleobuvir in humans.
Urine represented only 0.14% of radioactivity dose. All urine metabolites were <1.0% of the dose.
Metabolite identification.
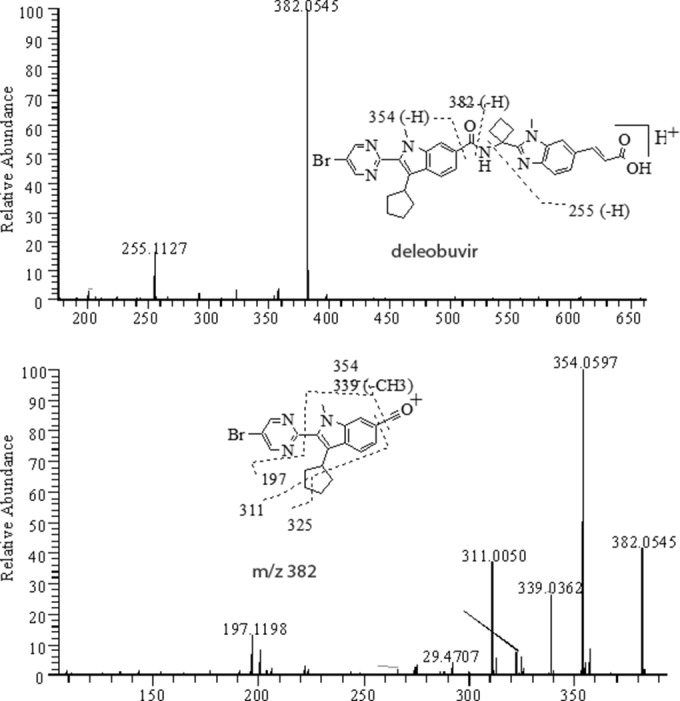
The metabolites were identified based on HPLC retention time, radiochromatography, and mass spectral analysis. MS/MS and MS3 analyses were performed for structure elucidation. The MS/MS and MS3 spectra of the deleobuvir reference standard, M655/1, M829/2, and M671/1 are shown in Fig. 7, 8, and 9, respectively. Accurate mass measurements were performed for the metabolites in positive ion mode to obtain the elemental composition, and the results are presented in Table 3. The identifications of the predominant metabolites M655/1, M829/2, M671/1, M671/2, M673, and CD 6168-AG are discussed here.
FIG 7.
Positive MS/MS of [MH]+ ion at m/z 653 (top) and MS3 of its fragment at m/z 382 (bottom) from deleobuvir standard.
FIG 8.
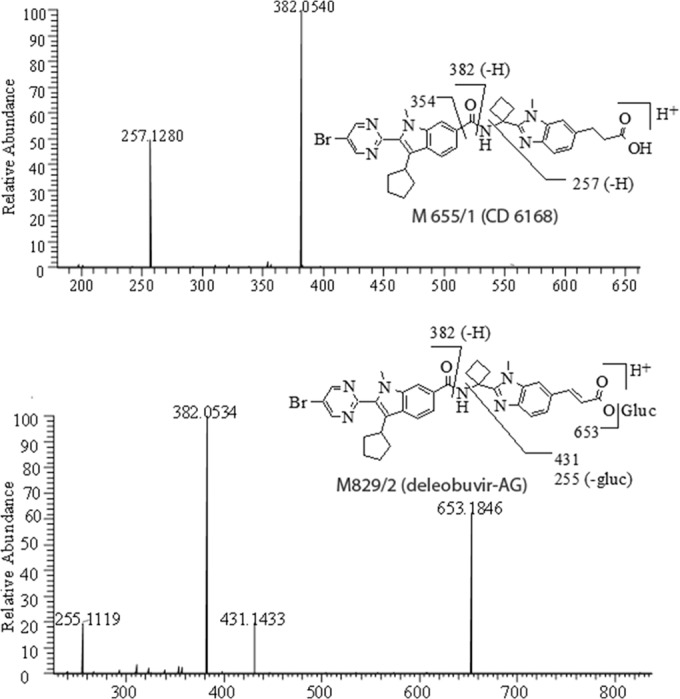
MS/MS of M655/1 [MH]+ ion at m/z 655 from fecal pool (top) and MS/MS of M829/2 [MH]+ ion at m/z 829 from 6-h plasma pool (bottom).
FIG 9.
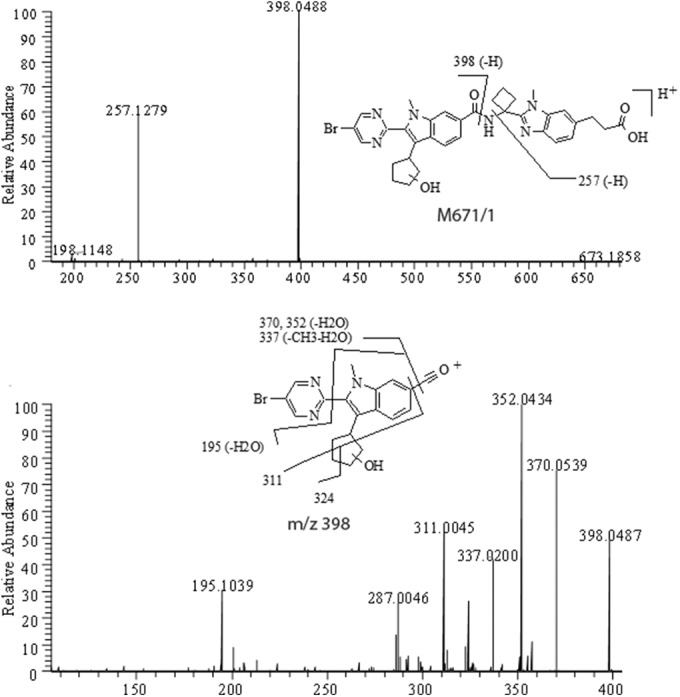
Positive MS/MS of [MH]+ ion at m/z 671 (top) and MS3 of its fragment at m/z 398 (bottom) from fecal pool.
TABLE 3.
Accurate mass measurements of deleobuvir and metabolites
| Compound | m/za | Elemental composition | Theoretical mass (Da) | Measured mass (Da) | Mass difference (ppm) |
|---|---|---|---|---|---|
| Deleobuvir | 653 | C34H34O3N6Br | 653.1870 | 653.1858 | −1.9 |
| M671/1 | 671 | C34H36O4N6Br | 671.1976 | 671.1971 | −0.7 |
| M845/1 | 845 | C40H42O10N6Br | 845.2140 | 845.2135 | −0.6 |
| M671/2 | 671 | C34H36O4N6Br | 671.1976 | 671.1962 | −2.1 |
| M669/2 | 669 | C34H34O4N6Br | 669.1819 | 669.1819 | 0.0 |
| M669/3 | 669 | C34H34O4N6Br | 669.1819 | 669.1812 | −1.1 |
| M671/3 | 671 | C34H36O4N6Br | 671.1976 | 671.1969 | −1.0 |
| M831/1 | 831 | C40H44O9N6Br | 831.2348 | 831.2337 | −1.3 |
| M829/1 | 829 | C40H42O9N6Br | 829.2191 | 829.2162 | −1.5 |
| M655/1 | 655 | C34H36O3N6Br | 655.2027 | 655.2017 | −3.5 |
| M829/2 | 829 | C40H42O9N6Br | 829.2191 | 829.2177 | −1.7 |
| M627/2 | 627 | C32H32O3N6Br | 627.1714 | 627.1695 | −3.0 |
| M667/2 | 667 | C35H36O3N6Br | 667.2027 | 667.2001 | −3.8 |
The m/z values correspond to positive ions.
Deleobuvir.
The HPLC retention time of deleobuvir was approximately 53.1 to 53.8 min. Deleobuvir had a protonated molecular ion MH+ at m/z 653, with an isotope ratio of roughly 1:1 for [M+2]/[M] due to the presence of one bromine atom. The positive MS/MS of deleobuvir produced fragment ions at m/z 382 via the amide bond cleavage, m/z 255 via the N–C bond cleavage, and m/z 354 via the loss of amide-containing moiety. The MS3 for the m/z 382 ion gave product ions at m/z 354 (−CO), m/z 339 (−CO-CH3) and m/z 197 and the cyclopentyl-ring cleavage fragments at m/z 325 and 311 (Fig. 7); these characteristic fragmentations were useful in the structural elucidation for the metabolites, as discussed below.
M655/1 (CD 6168).
M655/1 (CD 6168) eluted at 46.6 to 48.0 min and was found in plasma, urine, and fecal samples. M655/1 had an MH+ ion at m/z 655, which is 2 Da higher than that of deleobuvir. High-resolution MS revealed that the 2 Da was from the addition of two hydrogens (Table 3), which suggested that it was a reduction metabolite of deleobuvir. Furthermore, the isotope ratio of [M+2]/[M] was roughly 1:1, confirming that the bromine atom was retained. MS/MS of M655/1 showed the deleobuvir-like fragments at m/z 382 and 257 (Fig. 8). Compared to the MS/MS of deleobuvir, the reduction of the C=C double bond adjacent to the carboxylic group led to the formation of M655/1. The metabolite structure was further confirmed using a synthetic reference standard.
M829/2 (deleobuvir-AG).
M829/2 (deleobuvir-AG) eluted at 49.4 to 51.2 min and was found in plasma and urine samples. M829/2 had an MH+ ion at m/z 829, which is 176 Da (glucuronic group) more than that of deleobuvir, indicating a glucuronide conjugate of deleobuvir (Table 3). The isotope ratio of [M+2]/[M] was roughly 1:1, confirming that the bromine atom was retained. MS/MS showed the characteristic fragments at m/z 653 (loss of glucuronide) and deleobuvir-like fragments at m/z 382 and 255 (Fig. 8). In addition, a product ion at m/z 431 was present, which suggested an acyl glucuronide structure. The metabolite structure was further confirmed using a synthetic reference standard.
M671/1.
M671/1 eluted at 31.9 to 32.0 min and was found in urine and fecal samples. M671/1 had an MH+ ion at m/z 671, which is 18 Da higher than that of deleobuvir. MS revealed that the 18 Da was from the addition of [2H+O], as shown in Table 3, which suggested that it was a hydroxylation-double bond reduction metabolite of deleobuvir. Similar to the parent, the positive MS/MS of M671/1 gave an amide bond cleavage fragment at m/z 398 and the C–N bond cleavage fragment at m/z 257 (Fig. 9), which indicated that one oxygen was added to the left side of the amide while two hydrogens were added to the right side. The MS3 for the m/z 398 ion gave fragments at m/z 324 and 311, among others, further suggesting that oxidation took place on the cyclopentyl ring.
M671/2.
The radioactive peak of M671/2 eluting at approximately 34.1 to 34.8 min was observed in urine and fecal samples. It corresponded to a positive molecular ion at m/z 671, which is 18 Da higher than that of deleobuvir. High-resolution MS yielded the most likely molecular formula, C34H36O4N6Br (Table 3), which is the same as that for M671/1. The MS/MS and MS3 for the m/z 398 ion were also identical to those from M671/1, which indicated that M671/2 is an isomer of M671/1.
M671/3.
The radioactive peak of M671/3 eluting at approximately 44.3 min was observed in fecal samples only. It corresponded to a positive molecular ion at m/z 671, which is 18 Da higher than that of deleobuvir. High-resolution MS yielded the most likely formula, C34H36O4N6Br, which was [2H+O] higher than deleobuvir (Table 3). The MS/MS gave fragments at m/z 382, 273, 245, and 213. The formation of the m/z 382 ion indicated the left side moiety of the amide remained intact, while the formation of the m/z 273 suggested the addition of 18 Da [2H+O] on the right side moiety. MS3 of m/z 273 ion gave product ions at m/z 245 (−CO) and m/z 213 (−CH3COOH). Based on the mass spectral analyses, M671/3 was tentatively identified to be another hydroxyl-reduction metabolite with the hydroxylation on the cyclobutyl group.
M831/1 (CD 6168-AG).
The radioactive peak of M831/1 (CD 6168-AG) eluting at approximately 46.0 min was found in the urine samples only. It corresponded to a positive molecular ion at m/z 831, which is 178 higher than that of deleobuvir. High-resolution MS yielded the most likely formula, C40H44O9N6Br, suggesting that M831/1 is a glucuronide conjugate of a hydrogenated metabolite (Table 3). The MS/MS yielded product ions at m/z 655 (without glucuronide) and 382. The formation of the product ion at m/z 382 indicated that the left side moiety of the amide remained intact. M831/1 was therefore identified to be a glucuronide conjugate of CD 6168. The metabolite structure was further confirmed using a synthetic reference standard.
In vitro metabolic and biliary clearance.
The metabolic turnover of deleobuvir in the cryopreserved hepatocytes was very low. The half-life at 1 μM was >2,500 min. Using the well-stirred model, with an assumption that the unbound fraction was 1, resulted in a metabolic clearance rate of <1.9 ml/min/kg. Given that deleobuvir is highly protein bound in plasma and also demonstrates substantial microsomal binding at more realistic unbound drug levels of <50%, the clearance rate was calculated to be <1.2 ml/min/kg.
In sandwich-cultured human hepatocytes (SCHH), deleobuvir (10 μM) and CD 6168 (10 μM) demonstrated low mean biliary clearance rates of 3.6 and 0.95 ml/min/kg, respectively, despite very high intracellular accumulations of ∼20-fold and ∼14-fold, respectively. The biliary excretion index (BEI) was also calculated for the detected metabolites formed over the 20-min incubation. As shown in Table 4, when deleobuvir was incubated with SCHH, it demonstrated a low to moderate mean BEI of 11.2%. In the same incubations, only 1 to 2% of turnover to deleobuvir-AG and CD 6168 was observed, and they exhibited moderate to low BEI values of 22.7% and 8.73%, respectively. Notably, the hydroxylated metabolites (M668/1, M668/2, and M668/3) had the highest BEI, ranging from 26% to 44%. When CD 6168 (10 μM) was incubated with sandwich-cultured human hepatocytes, it also demonstrated low biliary clearance, as noted above, and a low biliary excretion index of 7.36%, which is similar to that observed when low levels of CD 6168 were formed in deleobuvir incubations. When CD 6168 was incubated in these cells, CD 6168-AG was formed and exhibited a moderate to high BEI. Deleobuvir was measured in these incubations with CD 6168 to assess the potential for a reversible reaction and was shown to be formed to a very low extent, at <1% of the incubated CD 6168. This was also confirmed in human liver microsomes incubated with CD 6168, wherein no discernible formation of deleobuvir was noted (data not shown). As such, it is unlikely that CD 6168 is oxidized back to deleobuvir in vivo. In these incubations with CD 6168, which are analogous to the deleobuvir incubations, hydroxylated metabolites of CD 6168 (M671/1, M671/2, and M671/3) had the highest BEI, at >45%.
TABLE 4.
In vitro biliary excretion index and cellular concentrations of the incubated compound and its metabolites (n = 3)
| Incubated compound (concn [μM]) | Monitored metabolite or parent | % BEI (mean [SD])a | Concn in cell lysates (mean [SD]) (μM) |
|---|---|---|---|
| Deleobuvir (10) | Deleobuvir | 11.2 (11.0) | 204 (36.5) |
| Deleobuvir-AG | 22.7 (1.80) | 2.02 (0.550) | |
| CD 6168 | 8.73 (10.1) | 3.39 (0.570) | |
| M669/1, M669/2 | 25.9 (24.6, 27.2)b | NQc | |
| M669/3 | 43.4 (47.3, 39.4)b | NQ | |
| CD 6168 (10) | CD 6168 | 7.36 (11.9) | 137 (33.3) |
| CD 6168-AG | 24.8 (24.7) | NQ | |
| Deleobuvir | 5.50 (7.78) | 0.890 (0.028) | |
| M671/1, M671/2 | 46.9 (25.8) | NQ | |
| M671/3 | 47.3 (19.5) | NQ |
BEI, biliary excretion index.
Individual values are reported, since these metabolites were undetected in one donor.
NQ, not quantitated but only monitored by MRM transition, as synthetic standards were not available at the time of study.
In vitro protein binding.
The mean protein binding of [14C]deleobuvir in human plasma and 4% human serum albumin was very high. [14C]deleobuvir was 99.3% bound in human plasma at all concentrations tested. Binding to 4% albumin ranged from 99.3 to 99.1% for deleobuvir concentrations of 0.3 μg/ml to 100 μg/ml. There was no evidence of concentration dependence or saturation of binding in human plasma at the concentrations evaluated.
DISCUSSION
In this study conducted in healthy male volunteers, [14C]deleobuvir, after a single oral dose of 800 mg, was well tolerated and exhibited a pharmacokinetic profile consistent with that in a previous phase Ia study in healthy volunteers (data on file). Deleobuvir had a large volume of distribution, and in vitro data indicated a high degree of hepatocyte accumulation. As such, the liver is likely an important distribution organ for deleobuvir. Deleobuvir exhibited a short half-life of 2.84 h. In clinical studies in HCV-positive patients receiving a combination of deleobuvir and faldaprevir, the viral load decreases rapidly upon first dose (12), and as such, pharmacokinetic-pharmacodynamic (PK-PD) modeling for predicting an efficacious dose or steady-state concentration is not a feasible approach. As such, half-life determination is not directly used for the determination of an efficacious dosing regimen, and an optimum dosing regimen will represent a balance of efficacy, resistance, and tolerability in the patient population.
Excretion via feces was the major route of elimination, with almost 95.1% of the dose found in the fecal samples. Urinary excretion of the drug and its metabolites was minimal (0.137% of dose). The renal uptake transporters OAT1, OAT3, and OCT2 are known to mediate the active urinary elimination of xenobiotics, while OATP1B1 and OATP1B3 are involved in the biliary elimination of xenobiotics into feces (15). These renal and hepatic (OATP1B1 and OATP1B3) uptake transporters were evaluated in vitro in HEK293 cells transiently transfected with individual transporters. To determine if deleobuvir was a substrate of a particular uptake transporter, its uptake into transporter-expressing cells was compared to the uptake observed in HEK293 cells not expressing the transporters of interest. Deleobuvir was determined to be a substrate of the hepatic but not renal uptake transporters. Thus, the deleobuvir elimination data from the clinical study showing predominant elimination via feces, but minimal into urine, are consistent with these uptake transporter substrate data (data on file at Boehringer Ingelheim, our unpublished data). In addition, deleobuvir and CD 6168 are highly albumin bound (>99%), and therefore, renal filtration was also not expected to be a clearance mechanism. The mass balance observed in this study was considered to be high, with >95% radioactivity eliminated in 168 h, indicating that the drug was not sequestered in any organ in large amounts.
According to International Conference on Harmonisation of Technical Requirements for Registration of Pharmaceuticals for Human Use (ICH) guideline R3(M2) (16), a metabolite is considered to be major if its exposure in human plasma is >10% of the total drug-related material. Further preclinical qualification, such as safe exposure in animals and drug interaction assessment, is required if its exposure levels in circulation are >10% of the total drug-related material. Although deleobuvir was the predominant drug-related component in the plasma, two major circulating metabolites, as defined by the criteria in the ICH guideline, were identified. These two metabolites, deleobuvir-AG and CD 6168, were also quantitated in plasma by both radiodetection and a validated LC-MS/MS method. The exposure levels (AUC0–∞) of deleobuvir-AG and CD 6168 were ∼20% and ∼15% of the total drug-related material based on the radiomatic quantitation, respectively (∼43% and ∼27% of the parent in plasma, respectively, based on the LC-MS/MS quantitation). Deleobuvir-AG and CD 6168 were found to be active against HCV polymerase, even though they were 3 to 10 times less potent than deleobuvir (data on file at Boehringer Ingelheim Pharmaceuticals, Inc.). Their lower potencies, together with a lower exposure than that of deleobuvir, suggest that the overall contribution of metabolites toward antiviral potency is expected to be low in vivo. Both major metabolites were also present in animals and were adequately qualified in nonclinical safety studies.
The pharmacokinetic profiles of deleobuvir and its major circulatory metabolites were notably similar. Deleobuvir-AG and CD 6168 had half-lives similar to that of the parent and as such demonstrated formation rate-limited kinetics. That is, the elimination rate of metabolites is governed by the elimination rate of the parent, and hence, the exposure levels are governed by rate and extent of formation of the metabolites from the parent.
CD 6168 is a reduction metabolite, and reduction reactions are not commonly found to occur in the liver, as it is a highly perfused and oxygenated organ. In rats administered deleobuvir, CD 6168 was found to be a major component of the feces (∼33% of the dose), but the bile in the bile-cannulated rats had minimal CD 6168 (∼1% of the dose), suggesting that the formation of CD 6168 occurs in the GI tract (data on file at Boehringer Ingelheim). Cinnamic acid, which also has a structurally identical αβ-unsaturated acid, is known to undergo alkene reduction in the GI tract by gut bacteria (17). Further studies using GI tract bacteria are ongoing to confirm the site of formation of CD 6168. CD 6168 underwent further glucuronidation to form CD 6168-AG. CD 6168-AG was detected in urine in the metabolite profiling study but was below the limit of radiomatic quantitation. Hence, it was expected that CD 6168-AG would also be present in plasma at low concentrations. The CD 6168-AG plasma levels were determined using a validated LC-MS/MS method to overcome the lower detection limits of radiomatic quantitation. CD 6168-AG was present in the plasma at ∼3.1% of the deleobuvir exposure and 1.8% of the quantitated drug-related material (including deleobuvir, CD 6168, deleobuvir-AG, and CD 6168-AG). As a result, CD 6168-AG was regarded as a minor metabolite of deleobuvir. While both deleobuvir and its structurally highly similar metabolite CD 6168 are both acids with a propensity to form acyl glucuronides, there appeared to be a stark difference between the extents to which both of these molecules were glucuronidated. For instance, based on LC-MS/MS quantitation, the plasma exposure (AUC0–∞) of deleobuvir-AG was ∼43% of that of deleobuvir. However, the plasma exposure (AUC0–∞) of CD 6168-AG was only ∼11% of that of CD 6168, suggesting a notable lower rate and extent of glucuronidation for CD 6168 than those of deleobuvir. The identification of enzymes responsible for the glucuronidation of these molecules and the involved enzyme kinetics are under further investigation. A schematic of the metabolism and disposition of deleobuvir, based on available in vitro and in vivo data, is shown in Fig. 10.
FIG 10.

Schematic for metabolism and disposition of deleobuvir.
In the fecal samples, deleobuvir and CD 6168 were the predominant species. However, in addition, three metabolites, M671/1, M671/2, and M671/3, were observed that were not found in plasma. Of these, M671/1 and M671/2 were found in urine samples, albeit to a very small extent, suggesting their presence in plasma at levels below detection in this study. These three metabolites had both the alkene reduction as in CD 6168 and a hydroxylation at either the cyclopentane ring (M671/1 and M671/2) or the cyclobutane ring (M671/3). If all of these three excretory metabolites are secondary metabolites of CD 6168, this may mean that almost 70% of CD 6168 is cleared metabolically. This can have implications for drug interactions, whereby the exposure of CD 6168 may increase if its hydroxylation is inhibited. This may also indicate that two structurally very similar compounds, that is, deleobuvir and CD 6168, have different hydroxylation rates, similar to the differences observed in the rates and extent of their glucuronidation. If these are primary hydroxylation metabolites of deleobuvir, the exact contribution of this pathway toward deleobuvir clearance will be difficult to assess, as the bioavailability and GI tract contributions to hydroxylation are not known. Further experiments are ongoing in order to evaluate whether these are primary hydroxylation metabolites of deleobuvir that further undergo alkene reduction or whether they are simply the hydroxylation metabolites of CD 6168.
Sandwich-cultured hepatocytes are known to form biliary canaliculi and polarized transporters mimicking in vivo hepatic drug transport (18, 19). These biliary canaliculi formed in vitro are disrupted in the absence of divalent cations, such as Ca2+ and Mg2+. The difference between the total accumulation (when canaliculi are intact) and cellular accumulation (when canaliculi are disrupted) is a measure of biliary elimination. Deleobuvir and CD 6168 had low to moderate biliary elimination in SCHH; in contrast, the hydroxylated metabolites had remarkably high biliary elimination, with BEI ranging from 26% to 45%. The high BEI observed for the hydroxyl metabolites in these 20-min incubations indicates that these metabolites can be formed intrahepatically and have the potential to be rapidly eliminated into the biliary canaliculi. These data support a hypothesis that the hydroxylated metabolites were observed only in feces and not in circulation, because they are rapidly eliminated into the bile following their formation in the liver. This phenomenon is similar to what was recently reported for the hydroxy metabolites of faldaprevir and LY2090314 (20, 21). While the in vitro data were useful in understanding the disposition of the hydroxyl metabolites in the feces, the extrapolation of the level of clearance in vitro to in vivo was understandably low. In humans, deleobuvir had an oral clearance (CL/F) of 14.3 ml/min/kg. However, when up to an ∼50% presystemic conversion of deleobuvir to CD 6168 is considered, bioavailability can be expected to be low, thus implying that deleobuvir is indeed a high-clearance compound. This is in contrast to the low metabolic turnover and low biliary elimination observed in vitro. As noted above, the biliary elimination of deleobuvir was low in sandwich-cultured human hepatocytes. In the same in vitro incubations with deleobuvir, only 1 to 2% of CD 6168 and deleobuvir-AG were formed, which is very low compared to their exposures observed in vivo. While further clearance of metabolites is not being considered in this comparison, a lack of in vitro to in vivo concordance is not surprising in retrospect, based on the nature of the two major metabolites being generated. For instance, CD 6168 is likely formed by gut bacteria presystemically, and these pathways are not represented in the standard in vitro hepatic models of biotransformation. Second, the other metabolite is a glucuronide and currently used in vitro models for glucuronidation, such as microsomes, and hepatocytes tend to underestimate the extent of glucuronidation (22, 23). Further, deleobuvir glucuronidation and bacterial reduction exhibited interspecies differences in the extent of formation and/or elimination in vivo. That is, although these metabolites were adequately represented in rats and mice, they were circulating at a much lower percentage of the parent deleobuvir than that in humans. With a higher prevalence of non-CYP450-mediated metabolism, newer integrative preclinical models and in silico tools need to be considered, validated, and implemented for better in vitro to in vivo correlations in the future.
In summary, deleobuvir pharmacokinetics in healthy human volunteers exhibited a moderate to high clearance, large volume of distribution (likely due to high liver uptake), and a short half-life. The metabolite profile presents an interesting combination of metabolic pathways, including hydroxylation, conjugation, and presystemic gut bacterium-mediated reduction. The two major circulating metabolites, deleobuvir-AG and CD 6168, along with excretory hydroxyl metabolites, complicate the bioavailability and drug interaction landscape for deleobuvir. Further research on the risk assessment of acyl glucuronide reactivity and the drug interaction potential of major metabolites is ongoing.
ACKNOWLEDGMENTS
We thank Donald Tweedie and Jeff Duggan for helpful discussions, Qihong Huang for her input on the assessment of metabolite exposure in toxicology studies, and Monica Keith-Luzzi for conducting the protein binding work.
REFERENCES
- 1.World Health Organization. 2014. Hepatitis C fact sheet. World Health Organization, Geneva, Switzerland: http://www.who.int/mediacentre/factsheets/fs164/en/. [Google Scholar]
- 2.Nakano T, Lau GM, Lau GM, Sugiyama M, Mizokami M. 2012. An updated analysis of hepatitis C virus genotypes and subtypes based on the complete coding region. Liver Int 32:339–345. doi: 10.1111/j.1478-3231.2011.02684.x. [DOI] [PubMed] [Google Scholar]
- 3.Alter MJ, Kruszon-Moran D, Nainan OV, McQuillan GM, Gao F, Moyer LA, Kaslow RA, Margolis HS. 1999. The prevalence of hepatitis C virus infection in the United States, 1988 through 1994. N Engl J Med 341:556–562. [DOI] [PubMed] [Google Scholar]
- 4.Manns MP, McHutchison JG, Gordon SC, Rustgi VK, Shiffman M, Reindollar R, Goodman ZD, Koury K, Ling M, Albrecht JK. 2001. Peginterferon alfa-2b plus ribavirin compared with interferon alfa-2b plus ribavirin for initial treatment of chronic hepatitis C: a randomised trial. Lancet 358:958–965. doi: 10.1016/S0140-6736(01)06102-5. [DOI] [PubMed] [Google Scholar]
- 5.Fried MW, Shiffman ML, Reddy KR, Smith C, Marinos G, Gonçales FL Jr, Häussinger D, Diago M, Carosi G, Dhumeaux D, Craxi A, Lin A, Hoffman J, Yu J. 2002. Peginterferon alfa-2a plus ribavirin for chronic hepatitis C virus infection. N Engl J Med 347:975–982. doi: 10.1056/NEJMoa020047. [DOI] [PubMed] [Google Scholar]
- 6.Jacobson IM, McHutchison JG, Dusheiko G, Di Bisceglie AM, Reddy KR, Bzowej NH, Marcellin P, Muir AJ, Ferenci P, Flisiak R, George J, Rizzetto M, Shouval D, Sola R, Terg RA, Yoshida EM, Adda N, Bengtsson L, Sankoh AJ, Kieffer TL, George S, Kauffman RS, Zeuzem S, ADVANCE Study Team . 2011. Telaprevir for previously untreated chronic hepatitis C virus infection. N Engl J Med 364:2405–2416. doi: 10.1056/NEJMoa1012912. [DOI] [PubMed] [Google Scholar]
- 7.Bacon BR, Gordon SC, Lawitz E, Marcellin P, Vierling JM, Zeuzem S, Poordad F, Goodman ZD, Sings HL, Boparai N, Burroughs M, Brass CA, Albrecht JK, Esteban R, HCV RESPOND-2 Investigators . 2011. Boceprevir for previously treated chronic HCV genotype 1 infection. N Engl J Med 364:1207–1217. doi: 10.1056/NEJMoa1009482. [DOI] [PMC free article] [PubMed] [Google Scholar]
- 8.Poordad F, McCone J Jr, Bacon BR, Bruno S, Manns MP, Sulkowski MS, Jacobson IM, Reddy KR, Goodman ZD, Boparai N, DiNubile MJ, Sniukiene V, Brass CA, Albrecht JK, Bronowicki JP, SPRINT-2 Investigators . 2011. Boceprevir for untreated chronic HCV genotype 1 infection. N Engl J Med 364:1195–1206. doi: 10.1056/NEJMoa1010494. [DOI] [PMC free article] [PubMed] [Google Scholar]
- 9.Zeuzem S, Andreone P, Pol S, Lawitz E, Diago M, Roberts S, Focaccia R, Younossi Z, Foster GR, Horban A, Ferenci P, Nevens F, Mullhaupt B, Pockros P, Terg R, Shouval D, van Hoek B, Weiland O, Van Heeswijk R, De Meyer S, Luo D, Boogaerts G, Polo R, Picchio G, Beumont M, REALIZE Study Team . 2011. Telaprevir for retreatment of HCV infection. N Engl J Med 364:2417–2428. doi: 10.1056/NEJMoa1013086. [DOI] [PubMed] [Google Scholar]
- 10.Weill Medical College. 2013. A special meeting review edition: advances in the treatment of hepatitis C virus infection from EASL 2013. Gastroenterol Hepatol (N Y) 9:1–18. [PMC free article] [PubMed] [Google Scholar]
- 11.Larrey D, Lohse AW, Trepo C, Bronowicki JP, Arastéh K, Bourlière M, Calleja JL, Stern JO, Nehmiz G, Abdallah N, Berger KL, Marquis M, Steffgen J, Kukolj G, BI 207127 Study Group . 2013. Antiviral effect, safety, and pharmacokinetics of five-day oral administration of deleobuvir (BI 207127), an investigational hepatitis C virus RNA polymerase inhibitor, in patients with chronic hepatitis C. Antimicrob Agents Chemother 57:4727–4735. doi: 10.1128/AAC.00565-13. [DOI] [PMC free article] [PubMed] [Google Scholar]
- 12.Zeuzem S, Asselah T, Angus P, Zarski JP, Larrey D, Müllhaupt B, Gane E, Schuchmann M, Lohse AW, Pol S, Bronowicki JP, Roberts S, Arasteh K, Zoulim F, Heim M, Stern JO, Nehmiz G, Kukolj G, Bocher WO, Mensa FJ. 2013. Faldaprevir (BI 201335), deleobuvir (BI 207127) and ribavirin oral therapy for treatment-naive HCV genotype 1: SOUND-C1 final results. Antivir Ther 18:1015–1019. doi: 10.3851/IMP2567. [DOI] [PubMed] [Google Scholar]
- 13.Ghibellini G, Vasist LS, Leslie EM, Heizer WD, Kowalsky RJ, Calvo BF, Brouwer KL. 2007. In vitro-in vivo correlation of hepatobiliary drug clearance in humans. Clin Pharmacol Ther 81:406–413. doi: 10.1038/sj.clpt.6100059. [DOI] [PubMed] [Google Scholar]
- 14.Ghibellini G, Leslie EM, Brouwer KL. 2006. Methods to evaluate biliary excretion of drugs in humans: an updated review. Mol Pharm 3:198–211. doi: 10.1021/mp060011k. [DOI] [PMC free article] [PubMed] [Google Scholar]
- 15.International Transporter Consortium, Giacomini KM, Huang SM, Tweedie DJ, Benet LZ, Brouwer KL, Chu X, Dahlin A, Evers R, Fischer V, Hillgren KM, Hoffmaster KA, Ishikawa T, Keppler D, Kim RB, Lee CA, Niemi M, Polli JW, Sugiyama Y, Swaan PW, Ware JA, Wright SH, Yee SW, Zamek-Gliszczynski MJ, Zhang L. 2010. Membrane transporters in drug development. Nat Rev Drug Discov 9:215–236. doi: 10.1038/nrd3028. [DOI] [PMC free article] [PubMed] [Google Scholar]
- 16.U.S. Food and Drug Administration. 2013. Guidance for industry: M3 (R2) nonclinical safety studies for the conduct of human clinical trials and marketing authorization for pharmaceuticals. U.S. Food and Drug Administration, Silver Spring, MD: http://www.fda.gov/downloads/drugs/guidancecomplianceregulatoryinformation/guidances/ucm292340.pdf. [Google Scholar]
- 17.Chamkha M, Labat M, Patel BK, Garcia JL. 2001. Isolation of a cinnamic acid-metabolizing Clostridium glycolicum strain from oil mill wastewaters and emendation of the species description. Int J Syst Evol Microbiol 51:2049–2054. doi: 10.1099/00207713-51-6-2049. [DOI] [PubMed] [Google Scholar]
- 18.Brouwer KL, Keppler D, Hoffmaster KA, Bow DA, Cheng Y, Lai Y, Palm JE, Stieger B, Evers R. 2013. In vitro methods to support transporter evaluation in drug discovery and development. Clin Pharmacol Ther 94:95–112. doi: 10.1038/clpt.2013.81. [DOI] [PubMed] [Google Scholar]
- 19.Swift B, Pfeifer ND, Brouwer KL. 2010. Sandwich-cultured hepatocytes: an in vitro model to evaluate hepatobiliary transporter-based drug interactions and hepatotoxicity. Drug Metab Rev 42:446–471. doi: 10.3109/03602530903491881. [DOI] [PMC free article] [PubMed] [Google Scholar]
- 20.Chen LZ, Rose P, Mao Y, Yong CL, St George R, Huang F, Latli B, Mandarino D, Li Y. 2014. Mass balance and metabolite profiling of steady-state faldaprevir, a hepatitis C virus NS3/4 protease inhibitor, in healthy male subjects. Antimicrob Agents Chemother 58:2369–2376. doi: 10.1128/AAC.02156-13. [DOI] [PMC free article] [PubMed] [Google Scholar]
- 21.Zamek-Gliszczynski MJ, Abraham TL, Alberts JJ, Kulanthaivel P, Jackson KA, Chow KH, McCann DJ, Hu H, Anderson S, Furr NA, Barbuch RJ, Cassidy KC. 2013. Pharmacokinetics, metabolism, and excretion of the glycogen synthase kinase-3 inhibitor LY2090314 in rats, dogs, and humans: a case study in rapid clearance by extensive metabolism with low circulating metabolite exposure. Drug Metab Dispos 41:714–726. doi: 10.1124/dmd.112.048488. [DOI] [PubMed] [Google Scholar]
- 22.Miners JO, Knights KM, Houston JB, Mackenzie PI. 2006. In vitro-in vivo correlation for drugs and other compounds eliminated by glucuronidation in humans: pitfalls and promises. Biochem Pharmacol 71:1531–1539. doi: 10.1016/j.bcp.2005.12.019. [DOI] [PubMed] [Google Scholar]
- 23.Miners JO, Mackenzie PI, Knights KM. 2010. The prediction of drug-glucuronidation parameters in humans: UDP-glucuronosyltransferase enzyme-selective substrate and inhibitor probes for reaction phenotyping and in vitro-in vivo extrapolation of drug clearance and drug-drug interaction potential. Drug Metab Rev 42:196–208. doi: 10.3109/03602530903210716. [DOI] [PubMed] [Google Scholar]