

Significance
Nucleation from solution is a ubiquitous process that plays important roles in physics, chemistry, engineering, and material science. Despite its importance, nucleation is far from being completely understood. In this work, we combine advanced molecular-dynamics simulation techniques and theory to provide a description of urea nucleation from aqueous solution. In particular, our analysis shows that a two-step nucleation mechanism is favorable and that two polymorphs are seen to compete in the early stages of the nucleation process. In our analysis, we have derived and validated a theoretical correction to finite-size effects to compute free-energy profiles in the limit of a macroscopic system at constant supersaturation.
Keywords: nucleation, solution, molecular dynamics, enhanced sampling, well-tempered metadynamics
Abstract
Despite its ubiquitous character and relevance in many branches of science and engineering, nucleation from solution remains elusive. In this framework, molecular simulations represent a powerful tool to provide insight into nucleation at the molecular scale. In this work, we combine theory and molecular simulations to describe urea nucleation from aqueous solution. Taking advantage of well-tempered metadynamics, we compute the free-energy change associated to the phase transition. We find that such a free-energy profile is characterized by significant finite-size effects that can, however, be accounted for. The description of the nucleation process emerging from our analysis differs from classical nucleation theory. Nucleation of crystal-like clusters is in fact preceded by large concentration fluctuations, indicating a predominant two-step process, whereby embryonic crystal nuclei emerge from dense, disordered urea clusters. Furthermore, in the early stages of nucleation, two different polymorphs are seen to compete.
The nucleation of crystals from solution plays an important role in a variety of chemical and engineering processes. However, the very small scale that characterizes the early stages of nucleation makes its experimental study rather challenging. In this regard, molecular simulations play an important role and much work has been devoted to the study of homogeneous nucleation in simple model systems like Lennard–Jones particles or hard spheres (1–3). More recently, growing attention has been paid to the computer simulation of nucleation from solution of organic and inorganic materials (4–11).
However, these simulations have to face an important challenge. Nucleation is a typical example of a rare event occurring on a timescale that is much longer than what atomistic simulations can typically afford. The problem is most easily understood if we focus on molecular dynamics (MD), which is the sampling method used here but it plagues other methods as well. In MD, the shortest timescale to be used for a correct integration of the equation of motion is dictated by the fastest atomic motions such as vibrations or rotations. Due to this constraint in the integration step, present MD simulations can reach timescales up to microseconds unless specific hardware, accessible only to few, is used. Even in this case the scale of the accessible times can be stretched only to the milliseconds range, a far cry from the much longer scale of nucleation phenomena.
These timescale limitations affect molecular simulations in several other research fields, such as ligand protein binding, protein folding, or slow chemical reactions, to name just a few. To overcome this limit, many enhanced sampling methods have been proposed (12–21). Several of them are based on the application of a suitable external bias potential (12–14) that speeds up configurational sampling and permits free energies to be evaluated and transition rates to be computed (22–24). Here, we shall use well-tempered (WT) metadynamics to enhance the nucleation of urea crystals from aqueous solutions and compute free-energy profile associated to this event (25). To this aim, we build on our recent study of homogeneous nucleation in pure urea where we have identified collective variables that well describe the process of nucleation (9). Our simulations allow a deep insight into the complex nucleation process, which involves the competition between two crystalline phases, the experimental one and a metastable polymorph previously identified in ref. 9. To interpret the free-energy profiles calculated from WT metadynamics, we describe in detail how classical nucleation theory can be extended to account for the coupling between the size of the nucleus and the chemical potential of the mother phase.
Reversible Work of Crystal Nucleation in a Simulation Box
Typical MD simulations are carried out in isothermal-isobaric (NPT) ensembles, defined by fixed number of atoms, temperature, and pressure. Let us now consider an isothermal-isobaric simulation box in which two phases, a crystal and a solution, coexist. Although the exchange of molecules between the two phases is allowed, the total number of molecules is fixed by construction. Such a constraint can be mathematically expressed through the material balance on the solute molecules, that reads as follows:
| [1] |
where is the total number of solute molecules in the whole simulation box, is the number of solute molecules in the liquid phase, and is the number of solute molecules in the crystal phase. For the sake of simplicity, let us assume that only solute molecules are exchanged between the two phases, whereas the solvent remains in the liquid phase, the concepts exposed in the following paragraph are, however, easily transferable to more complex phase equilibria. Let us now derive an expression for the free energy associated to the formation of a crystal nucleus composed of molecules under the constraint of Eq. 1. In this derivation, we proceed following an approach similar to that used to derive a free-energy profile associated with crystal growth from solution in a confined system reported in the supplementary material of ref. 26. Our final expression is in agreement with those derived by Veesler and coworker (27) for the nucleation of proteins in a droplet as well as with other theoretical results obtained for the description of first-order phase transitions in confined volumes (28–30). Consider the free energy of a system composed of solute molecules in the crystal state, solute molecules in solution, and solvent molecules. The free energy of the whole system, G, can be written as follows:
| [2] |
The chemical potential of both solute and solvent in the liquid phase can be written as and , respectively. In these expressions, x is the molar fraction of the solute in the liquid phase and is the molar fraction of the solvent; hence:
| [3] |
The terms represent the free energy of the crystal particle in suspension, where is the total number of solute molecules in the crystal phase, is the chemical potential of a molecule in the crystal bulk, σ is the surface tension, and A is the total surface area of the crystal. represents instead the free-energy contributions of the liquid phase. Exploiting the definition of thermodynamic equilibrium, we can write the chemical potential of the crystalline solid bulk as the chemical potential of a solution in thermodynamic equilibrium with the solid as follows:
| [4] |
where is the chemical potential of a reference state, is the solubility of the solute in the solvent considered, and its activity coefficient at equilibrium conditions.
Substituting the expressions for the chemical potentials into Eq. 2 yields the following:
| [5] |
In typical formulations of the free energy associated to nucleation, a spherical shape is assumed for the nucleus and the surface term is expressed as a function of the radius r. Corrections to this simple assumption have been found to be necessary to capture the actual shape of crystal clusters (3). As we aim at defining a shape-independent expression, we choose to write both the bulk and the surface terms as function of the number of atoms in the crystal. The free-energy cost associated to the formation of an interface between a crystalline particle and the solution is proportional to the surface area per unit volume of the particle. The surface term can thus be written as proportional to as commonly done in physics. This scaling is valid in the case of several geometries such as spherical, ellipsoidal, or cubic and allow us to express surface penalty term as follows:
| [6] |
where the constant lumps together the surface tension and a geometric factor defining the shape of the nucleus.
The reversible work associated to the formation of a cluster constituted of molecules can thus be expressed as a function of by computing the difference from a reference state where no crystal is present (namely, ) (28), and introducing Eq. 6 to account for the surface contribution:
| [7] |
In macroscopic systems, namely where , the composition of the solution can be considered decoupled from the size of the crystal , where is the molar fraction of solute molecules in the liquid phase in the absence of a crystal phase . In these conditions, Eq. 7 reduces to the expression for the free-energy profile also used in the context of classical nucleation theory (CNT):
| [8] |
The difference between and tends to zero for and is maximum for , regardless of the size or initial composition of the system. In analogy with the approach proposed in ref. 29 for the nucleation of a liquid droplet, provided Eqs. 8 and 7, it is possible to define a correction free-energy term , which needs to be added to the free energy obtained from a confined, finite-sized, simulation to backcalculate the equivalent free-energy profile in a macroscopic system:
| [9] |
As expected, the value of tends to zero when , or in other terms, when .
In Fig. 1, we report a prototypical free-energy curve described by Eq. 7 as a function of , together with the two terms and . As shown in Fig. 1, has a global minimum, corresponding to the thermodynamic equilibrium under ideal conditions, namely . Let us define the number of molecules in the crystal phase corresponding to this condition as . The nonmonotonic behavior of is a consequence of the finite size of the system and of its confinement, which leads to significant deviations from the typical CNT profile over the interval . From Eq. 7, assuming unitary activity coefficients, we observe that the associated with the formation of a nucleus of size depends on four independent parameters: , , , and . The first two parameters are defined by the choice of the chemical nature of the solvent and solute species and of the system temperature. and reflect instead the degrees of freedom in the definition of the initial state of the system; defines the supersaturation of the solution in absence of a crystal phase. Once is fixed, is proportional to the volume of the simulation box through the expression . In a macroscopic system, the sole information necessary to determine what is the most stable state between the crystal and the solution is the supersaturation ratio . When , crystal growth is thermodynamically favored and nucleation is possible, and for , crystal dissolution is instead favored. Eq. 7 shows that this condition is not sufficient in a system where confinement effects are important. In this case, in fact, the thermodynamically favored state depends on both the initial supersaturation of the solution and the size of the system. To further clarify this concept and comment on the features emerging from Eq. 7, we report in Fig. 2 the contour plot of as a function of the ratio and both the theoretical supersaturation (Fig. 2A), and the size of the system expressed as the total number of solvent molecules (Fig. 2B). In Fig. 2 A and B, and were kept constant.
Fig. 1.

Total free energy , bulk contribution , surface contribution obtained from Eq. 7 for the formation of clusters of up to 200 solute molecules for a system consisting of 600 total solute molecules in solvent molecules, with a thermodynamic solubility at K. The surface term has been modeled as with . The free-energy profile is compared with at constant composition .
Fig. 2.
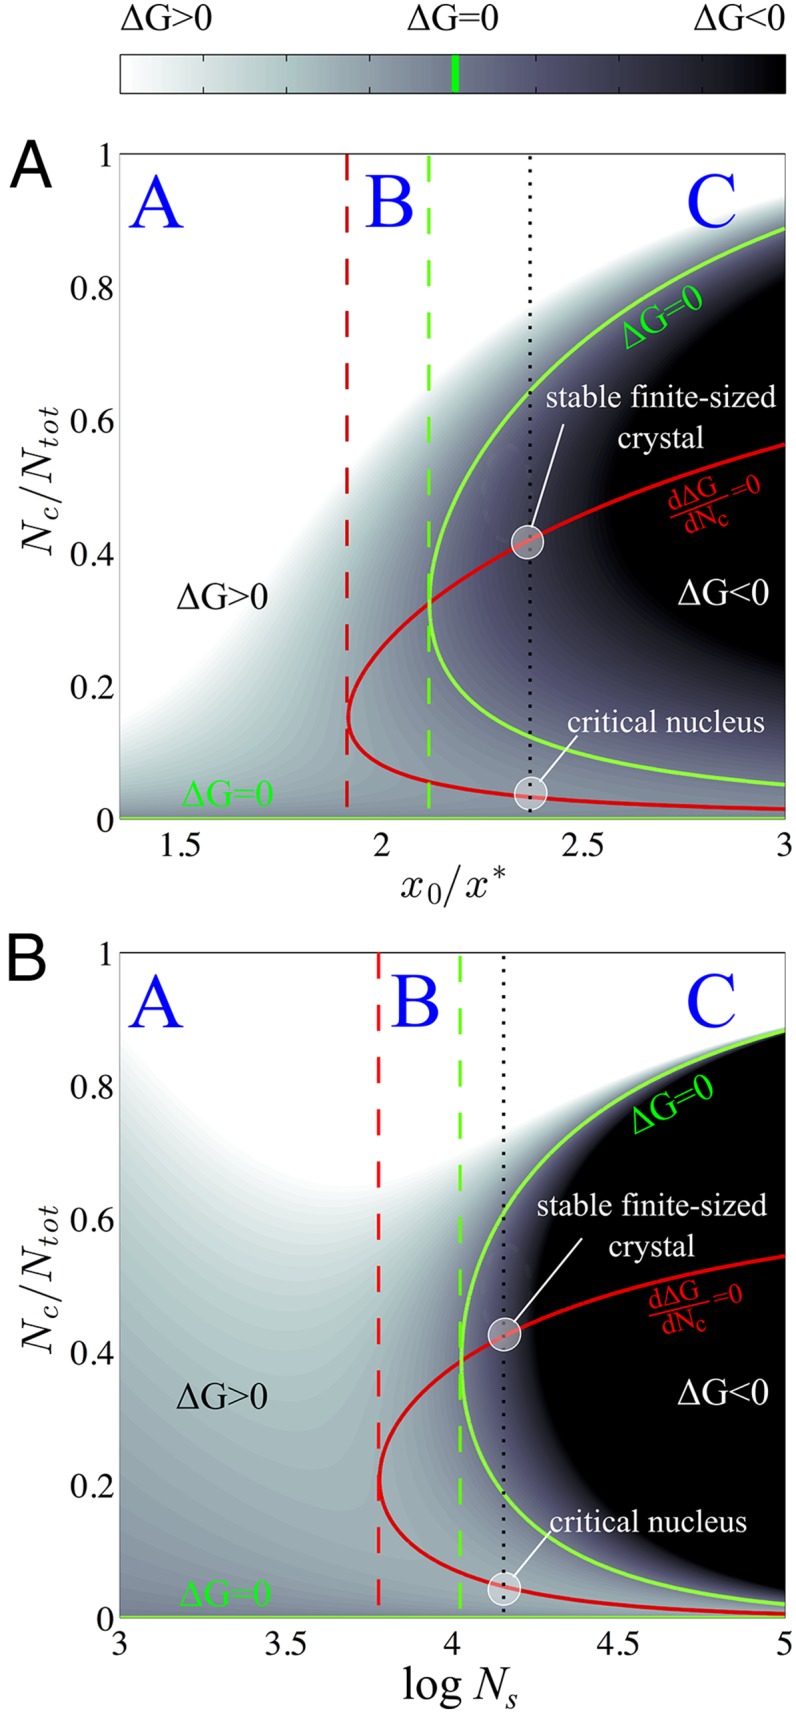
(reported as in figure) as a function of and the initial supersaturation (A) and (B). In A, has been fixed to 3.5, whereas in B, . The red contour represents the locus of the points where , and the green contour represents the locus of the points where . The black dotted line represents a typical free-energy profile obtained in the finite-size case. It exhibits two stationary states, identified by the intersections of the dotted line with the red contour. The first intersection represents the local maximum corresponding to the critical nucleus condition, whereas the second intersection corresponds to the local minimum representing a metastable state in which a finite-sized crystal and the solution coexist. The red dashed line represents the threshold value of (A) or (B) that discriminates between a region in which the free-energy profile is monotonically increasing (A) or has a local maximum and a local minimum (B and C). The green dashed line discriminates between a region of the parameter space in which the minimum corresponds to a metastable (B) or to the most stable state (C) for the system.
In Fig. 2, is displayed through colored contours while two specific lines are highlighted. The first one, colored in red, represents the locus of the stationary points of the free-energy profile, whereas the second one, colored in green, displays the locus of the points for which . Three regions can be identified in both the and the planes. The first region, labeled A, is characterized by a monotonically increasing free-energy profile. In this region, despite being the most stable state is the solution at composition . In the region labeled B, ceases to be monotonically increasing and displays two stationary states. The first one is a maximum and represents the critical nucleus, whereas the second is a local minimum and represents a state in which a finite-sized crystal particle is in equilibrium with the solvent. Region C exhibits the same qualitative behavior as region B, but in this case the global minimum of the free-energy profile is the finite-sized crystal. A notable point in both plots is the intersection between the loci where and . This point identifies the unique state at which the solution at composition and a finite-sized crystal in equilibrium with the solution have the same free energy. In Fig. 3, we display the existence domains of regimes A, B, and C in the space of the parameters defining the initial conditions, namely the initial solute concentration , and the size of the simulation box represented by the logarithm of the number of solvent molecules, .
Fig. 3.

Existence domains of regimes A, B, and C described in Fig. 2 as a function of the initial supersaturation and the size of the system . In gray is reported the domain in which both macroscopic and confined systems do not have stationary points, i.e., when , and nucleation is not thermodynamically favored even in a macroscopic system. Exemplary free-energy profiles obtained in the region A, B, and C are displayed as Insets within the plot.
Results
The analytical expression for the free energy associated to the formation of a nucleus of size given by Eq. 7 allows to account for the depletion of the solution in computing the reversible work associated with crystal nucleation from solution. Its formulation is based on the assumptions that (i) a single nucleus is formed, (ii) the concept of surface tension can be extrapolated to very small crystal sizes, and (iii) the crystal nucleus has a well-defined internal structure. These assumptions, necessary to formulate an analytical equation, do not intrinsically describe the mechanism of the molecular process at play in molecular simulations, where the system is allowed to sample a wide variety of states characterized by a diverse range of aggregates number, sizes, and structures. The internal structure of the nucleus, its shape, its mechanism of formation, and the structure of the solution where the whole nucleation process takes place are in fact products of the molecular simulation rather than being a priori imposed. As we shall demonstrate in the following paragraphs, the analytical expression reported in Eq. 7 does indeed capture the features of the nucleation free energy in the molecular simulation box and allows to correct the free-energy estimates by correcting for finite-size effects.
Free Energy of Nucleation of a Crystal-Like Particle from Metadynamics Simulations.
The aim of this section is to validate the analytical expression of the nucleation free energy, by demonstrating that Eq. 7 correctly describes the depletion of the solution and that, by applying the correction reported in Eq. 9, one can recover the free-energy profile of a macroscopic system (e.g., at constant supersaturation). We observe that, in WT metadynamics simulations, the bias deposition makes the molecular models explore the nucleation of a crystal phase through states characterized by a population of multiple clusters. Nevertheless, using a reweighing strategy (25), it possible to extract the free-energy profile associated with the formation of a single crystal nucleus within the simulation box, hereafter named . We perform three metadynamics simulations, S1, S2, and S3, described in detail in Methods and summarized in Table 1.
Table 1.
Simulations S1, S2, and S3
| Parameter | S1 | S2 | S3 |
| T, K | 273 | 300 | 273 |
| x0 | 0.03 | 0.086 | 0.086 |
| Ns | 3,824 | 3,173 | 3,173 |
| Time, ns | 260 | 280 | 340 |
| x* | 0.040 | 0.056 | 0.041 |
| σ′, kJ/mol | 22.45 | 14.3 | 20.43 |
| N* | — | 653 | 552 |
Simulation conditions and parameters obtained from the fitting of the WT metadynamics FES.
This free-energy profile is related to the equilibrium probability of finding a single crystal-like cluster in the simulation box where all urea molecules not included in the cluster are dispersed in solution and contribute to the chemical potential of the liquid phase. This renders the profile suitable to be consistently described by the theoretical free-energy expression (Eq. 7) derived above. Such profile will be used in the following sections of the paper to extract information from the WT metadynamics simulations. From a nonlinear least-squares fitting of the curve obtained from simulations S1, S2, and S3, we can extract the solubility and the effective surface energy (Table 1). The quality of the fitting is illustrated in Fig. 4 and confirms that the surface contribution is indeed well represented by a term proportional to , as expected.
Fig. 4.

Comparison between the fitted analytical expression reported in Eq. 7, using the parameters reported in Table 1 and the free-energy profile obtained from WT metadynamics for the nucleation of urea in water in the limit of . In these conditions, the hypotheses used to derive the free-energy profile are satisfied and the analytical expression describes consistently the free-energy profile obtained from simulations.
The largest discrepancies between the WT metadynamics simulations results and the fitted analytic expression are observed for small cluster sizes , and reflect the intrinsic limitations of CNT in the description of the nucleation of small molecular clusters from solution. In CNT, in fact, the free-energy cost associated to the nucleation process is due to the formation of an interface between crystal and solution. When very small crystal-like entities, such as embryonic clusters, are formed from solution, the very definition of bulk and interface is dubious. Nevertheless, for larger cluster sizes, the simple thermodynamic model of Eq. 7 reproduces properly the monotonically increasing profile due to the coupling between the clusters size and the chemical potential in solution induced by the finite-size effects. This observation strengthens our argument in favor of the application of the correction term defined in Eq. 9 to the calculated from WT metadynamics simulations. As shown in Fig. 4, the correction term has a negligible effect for small nuclei, where the curve obtained from simulation differs the most from its approximated analytical expression. For large nuclei instead, where the is well reproduced by the analytical expression, the free-energy curve obtained from simulation can be effectively corrected to reproduce the correct behavior at constant supersaturation.
Using the solubility and the surface energy obtained from the fitting of the free-energy surface (FES) calculated with WT metadynamics in finite-sized systems allows to reconstruct the CNT-like free-energy profile in macroscopic systems where the composition of the mother solution can be considered constant and Eq. 8 holds. In Table 1, the size of the critical nucleus extrapolated from an infinite reservoir at constant supersaturation is reported for simulations S2 and S3. In Fig. 5, the size of what would be the critical nucleus for a macroscopic system at 273 and 300 K is reported as a function of the supersaturation . It is important to highlight that values calculated on the basis of simulations S1 and S3, both performed at 273 K with different initial conditions, are in good agreement with one another, thus proving that the simulation setup does not affect the results. Simulation S2, performed at 300 K, predicts instead a steeper decay of the critical nucleus size with increasing supersaturation. This is due to an increase in the solubility accompanied by a slight decrease in the surface energy predicted for 300 K with respect to that at 273 K (Table 1).
Fig. 5.

Size of the critical cluster as a function of supersaturation calculated at 273 and 300 K using the parameter fitted from simulations S1, S2, and S3. The size of the critical nucleus for an infinite system at a composition equal to that of the homogeneous solution in simulations S2 and S3 is reported as a circle. An analogous point for simulation S1 cannot be identified, as the initial conditions for simulations S1 are such that . Nevertheless, Eq. 7 also applies in these conditions, providing estimates in good agreement with those of simulation S2.
On the Nucleation Mechanism.
In the previous section, we have demonstrated that the free energy associated with the formation of a crystalline nucleus of size from solution of finite, small size can be effectively described using the same thermodynamics concepts used to derive the same free energy in the frame of CNT. This observation, however, does not necessarily imply that the nucleation mechanism postulated by CNT as a molecule-by-molecule incremental growth of a crystal-like particle is actually a faithful description of the real process. In this paragraph, we delve into the molecular details provided by WT metadynamics to assess whether the nucleation process takes place according to a single-step mechanism or rather through a two-step process in which the crystal phase emerges within a liquid-like cluster, rich in solute molecules, a scenario that is currently debated in the literature (31).
To extract information regarding the preference for a single-step or a two-step process from WT metadynamics simulations, we consider the free energy associated to the evolution of the largest cluster in the simulation box. To this aim, we use reweighing (25) to compute , i.e., the FES in the space of n, the number of molecules belonging to the largest connected cluster, and , the number of molecules in a crystal-like configuration within the largest cluster (note that, by definition ; see Methods for a detailed definition of n and ). To account for the solution depletion, we correct the reweighed FES by adding the term , defined in Eq. 9, calculated as a function of . is reported in Fig. 6 for simulation S2, corrected to account for a constant supersaturation . Analyzing the FES reported in Fig. 6, three states can be identified: the lower left corner (a), representing the solution; the upper right corner (f), representing large crystal-like clusters; and the upper left corner (c), representing large disordered clusters. Following the diagonal in the plane corresponds to describing an ideal classical mechanism, whereby all of the molecules belonging to the largest cluster are in a crystal-like state; this would correspond to the crystal being formed through the molecule-by-molecule incremental growth of the largest nucleus.
Fig. 6.

Simulation S2. (A) Contour plot of the FES obtained in the plane (see text for a definition) and corrected with the term reported in Eq. 9 for a constant supersaturation . This value of supersaturation has been selected to clearly display the basin belonging to the crystalline nucleus within the interval sampled in simulation. (B) Representative states sampled during the nucleation process. For the sake of simplicity, urea molecules are reported simply as blue spheres. In order to facilitate the visualization of ordered arrangements within dense clusters, red connections are drawn between urea molecules falling within a cutoff distance of 0.6 nm of each other.
From the simulations illustrated in Fig. 6, however, one observes that the system undergoes important fluctuations of the local solute concentration, leading to the formation of transient disordered clusters b and c. These clusters are largely hydrated and typically do not appear to be stable as a distinct phase. Disordered clusters are represented by the wide basin in stretching from the lower left corner of the plane parallel to the n axis. From an analysis of FES reported in Fig. 6, a two-step nucleation mechanism, proceeding from these dense clusters, appears to be favored. A qualitative representation of the most favorable path followed by the system while undergoing the nucleation process is represented by the sequence of configurations , whereas a single-step classical nucleation mechanism can be qualitatively represented by the sequence of configurations .
The molecular picture emerging from the analysis of the WT metadynamics simulations, of a two-step mechanism in which urea nucleation is mediated by dynamical fluctuations of the local urea density, is qualitatively in agreement with the findings of Garetz et al. (32). In their work, Garetz and coworkers obtained urea crystals from nonphotochemical laser-induced nucleation (NPLIN) in supersaturated urea solutions. The effect of the laser pulse was believed to enhance the nucleation rate by promoting the ordering of urea molecules according to the orientation of their carbonyl bonds (32). According to recent theoretical studies, however, the alignment effect induced by laser pulses does not seem to be the dominant effect in NPLIN (33). Laser pulses appear in fact to promote nucleation regardless of the local orientation of molecules within the emerging phase (34). This observation suggests that the enhancement of the nucleation rate associated to NPLIN is due to a coupling with density fluctuations.
On the Nuclei Structure.
Let us now analyze the structural features of the crystal nuclei formed in aqueous solution. In our previous work, we have addressed the presence of a metastable polymorph studying the nucleation of urea from its melt (9). The experimentally known urea crystal structure (form I) (35) as well as the metastable polymorph (form II) are the result of the replication in a 3D lattice of two characteristic dimer structures, observed also in other studies of urea clusters in vacuum (36). Namely, form I is the result of the replication of head-to-tail dimers, whereas form II is characterized by interactions resembling those of cyclic dimers (9, 36). Despite this difference, looking at the structural features of the coordination shell of a single urea molecule, one can observe that both the experimental structure of urea (form I) and the metastable polymorph (form II) are characterized by a similar local orientation of the C–O axis. In both the crystal structures, adjacent urea molecules are arranged in such a way that the C–O bond is either parallel or antiparallel. As shown in Fig. 7, in form I neighboring molecules belonging to different hydrogen bond chains possess a mutually orthogonal N–N axis. In form II structures, the N–N axis of those urea molecules belonging to different hydrogen-bond chains is instead parallel. These two structures are also observed during the process of nucleation from the melt (9). In Fig. 7, two clusters of approximately the same size exhibiting the two different molecular arrangements are shown.
Fig. 7.

Crystal-like clusters formed by urea displaying two distinct internal structures. Form I (A) corresponds to the experimental urea crystal structure, whereas form II (B) exhibits an internal arrangement in which the C–O axis is oriented as in form I while the N–N axis has a different orientation. Both clusters are displayed in such a way that the C–O axis is orthogonal to the viewing plane. The crystal-like particle that has an internal structure as form I has solid/liquid interfaces that correspond to the {110} and {001} faces, typical of macroscopic crystals grown in water.
To characterize the nucleation of clusters possessing two different internal structures, we reweighed the FES (25) in the plane described by the number of molecules within the largest crystal-like cluster, which are in a form I configuration and in a form II configuration (Fig. 8). Also, in this case, we have applied the correction described by Eq. 9. The FES, reported for simulations S2 in Fig. 8, shows that small crystal-like nuclei are preferentially arranged in a form II configuration. In Fig. 8B, the free energy associated to the conversion from form I to form II is plotted for different nucleus sizes as a function of the form I to form II conversion. It can be observed that for an increasing size of the nucleus the difference in the free energy per molecule to convert form I to form II clusters becomes less and less negative. Moreover, for larger clusters, a conversion of form II-type nuclei to form I can occur without overcoming significant free-energy barriers. This finding suggests a scenario that can be conventionally described in terms of Ostwald step rule (37), whereby the least stable species (in this case form II) is the first to nucleate from solution. The most stable crystal structure, form I, is then obtained upon conversion of form II clusters. This finding is rather general, as for instance it has been observed also in the nucleation of NaCl from aqueous solution (10). From an analysis of the trajectories obtained from simulations, one can observe that smaller nuclei emerge from the solution basin located close to the origin. One of the nuclei then eventually prevails, typically leading to a cluster of size larger than 50 molecules with a definite form I or form II structure. Afterward, the nuclei can evolve following trajectories parallel to the isoenergy contours that connect form I to form II structures in the plane. Similar transition pathways have been recovered from the evolution of urea nuclei in unbiased simulations over timescales of 200–300 ns. This finding highlights the fact that the nucleus can explore the polymorph space by gradually converting its structure from one to the other form rather than following a dissolution and recrystallization pathway. Sample structures extracted from one of such pathways are displayed in Fig. 8, where it can be observed the gradual conversion of a nucleus from a form II- to a form I-type structure. Such a transition occurs through the rotation of adjacent hydrogen bond chains that can slide relative to one another, thus leading to the deformation of the nucleus shape and to the interconversion of the two crystal structures. This result leads to a scenario similar to that reported by Peters (5) regarding the nucleation from solution of charged colloids. Thus, also in the case of molecular crystals, the interconversion between polymorphic structures can follow a pathway that does not involve a dissolution process.
Fig. 8.

Simulation S2. (A) Contour plot of the FES obtained in the plane (, ). (B) Free-energy profiles extracted from the FES for increasing cluster sizes and reported as relative to the pure form I nucleus. It can be observed that the free-energy difference between form I and form II decreases with cluster size, whereas for small nuclei form II is markedly favored, increasing in size form I and form II become almost equally probable.
Combining these results, we can provide a qualitative mechanistic description of the urea nucleation process. This process starts from the nucleation of small clusters in which the urea molecules are individually ordered in such a way that the directions of the carbonyl bonds are either parallel or antiparallel, and then grow to form larger crystal-like particles with a slight preference for a form II arrangement. Only when clusters of a certain size are formed , the solid/solid transition between form II and form I is observed. It takes place through the collective rearrangement of molecules belonging to the same hydrogen bond chain, which rotate around the axis of the carbonyl bonds without losing their mutual alignment.
Conclusions
In this work, we have used WT metadynamics to enhance the sampling of urea nucleation from aqueous solution and to compute the associated free-energy landscape. We have demonstrated that, due to the coupling between the dimension of the crystalline nucleus and the chemical potential of the mother solution in finite-sized systems, the reversible work associated to nucleation within a simulation box has peculiar features, which differ significantly from those of an analogous free-energy profile in macroscopic systems. This allowed us to interpret the free-energy profiles obtained from WT metadynamics simulations by estimating the solubility and extracting an effective surface energy term for urea in water. This expression provides an a posteriori correction of finite-size effects, thus enabling an extrapolation of the free energies computed in finite-sized simulations to the limit of a system in contact with an infinite reservoir at constant composition.
The analysis of the molecular mechanisms at play during our simulations revealed that density fluctuations are essential to trigger the nucleation process, which takes place after disordered, albeit transient, urea clusters are formed from homogeneous solution. Such a two-step mechanism appears to be more probable than a stepwise incremental growth of the nucleus, corresponding to the mechanism hypothesized by CNT. Our simulations also highlight the coexistence of two polymorphic structures: a metastable packing, here named form II, and the experimental crystal structure, here named form I. Although form I is the most stable structure at room temperature (9), for small sizes form II clusters are slightly more favored than form I clusters. However, when a cluster size larger than ∼50 molecules is reached, the interconversion between form I and form II clusters can occur without a significant free-energy barrier. Such a transformation does not appear to be solvent mediated, but rather occurs through a solid–solid transformation involving a distortion of the cluster geometry that does not require a conformational rearrangement of urea molecules.
Methods
Simulation Setup.
Three simulations will be discussed in this work, labeled respectively S1, S2, and S3. These three systems have been prepared distributing 100 (S1) and 300 (S2, S3) urea molecules, in 3,823 (S1) and 3,123 (S2, S3) water molecules, respectively. Urea molecules were opportunely dispersed in the solvent using the genbox utility of the gromacs simulation package. Production runs were performed at two different temperatures: 273 K (S1, S3) and 300 K (S2). The metadynamics production runs were carried out for 0.26, 0.34, and 0.35 μs, respectively. Consistently with our previous works (9, 26, 38), generalized Amber force field (GAFF) (39, 40) was chosen for urea together with the TIP3P water model. Each system was at first minimized with the conjugate gradient algorithm with a tolerance on the maximum force of 200 kJ⋅mol−1⋅nm−1, and then a 100-ps NVT equilibration with a time step of 0.5 fs was performed to relax the system at the temperature assigned. All of the simulations discussed in this work were carried out in the isothermal-isobaric ensemble at 1 bar using the velocity rescale thermostat (41) and the isotropic Parrinello–Rahman barostat (42) as implemented in GROMACS 4.5.4. The particle-mesh Ewald approach was used to calculate long-range electrostatic interactions, with a cutoff of 1 nm. Both Lennard–Jones and Coulomb interactions were explicitly calculated up to the cutoff distance. The LINCS algorithm was applied at each step to preserve the bond lengths with 1 × 10⁻⁵ tolerance and four iterations. The time step used in the production run was 2 × 10⁻³ ps. WT metadynamics simulations were carried out using a set of collective variables (CVs) inspired by our previous work on urea growth from solution (38) and described in detail in a recent work on urea crystal nucleation from the melt (9). The CVs have been implemented in PLUMED-1.3 (43). In our simulations, the bias deposition stride was set to be 1 ps; the height of the Gaussian bias rate was set to ≈2kBT. The width of the Gaussian bias rate was set to 2 × 10⁻², a value of the order of the typical fluctuation of the CVs in the systems investigated. In all simulations, well tempered (WT) metadynamics was carried out with a bias factor of 100 allowing for an extensive exploration of the rather large energy scale associated with the phase transition of the hundreds of solute molecules contained in a typical simulation box. The addition of a bias potential through WT metadynamics affects the statistical weight with which configurations are sampled. In order to recover unbiased probability distributions a reweighing scheme has been applied (25). This allows to analyse nucleation mechanisms by plotting the FES relative to variables different from those used to construct the metadynamics bias, as shown in Figs. 4, 6, and 8. Details regarding the theoretical background and the implementation of the reweighing algorithm can be found in refs. 22, 25, and 44.
Identification of Crystal-Like Clusters.
In our analysis of the trajectories obtained from WT-metadynamics simulations, it is of primary importance to identify both the state of each molecule, to determine whether it is in a crystal-like or in a liquid-like state, as well as the formation of crystal-like clusters of solute molecules from solution. To carry out the first task, we take advantage of the definition of the CVs used to bias the dynamics (9). Such CVs can be decomposed in single-molecule contributions that account for the density of the local molecular environment surrounding each solute molecule, as well as the degree of orientation order of the molecules belonging to the coordination sphere of that solute molecule. The orientation order is defined with respect to an intramolecular vector (26, 38, 45). In the following, we shall define , the molecular degree of order associated to the relative orientation of urea molecules with respect to the CO axis, and , the degree of order associated to the relative orientation with respect to the NN axis. and were computed for the ith molecule as follows:
| [10] |
| [11] |
where is the coordination number of molecule i, is a switching function defined in the space of the coordination number that smoothly decreases from 1 to zero when the number of neighbors of the ith urea molecule is less than a predefined threshold value, N is the total number of solute molecules in the system, is the angle between the CO or the NN axis of the i and j urea molecules, and is a switching function that weights the contribution of the relative orientation of neighboring urea molecules with their Cartesian distance. In Eq. 10 θ1 = 0°, θ2 = 180°, δ = 27.5°, while in Eq. 11 θ1 = 90°, θ2 = 270°, δ = 27.5°. A detailed description of all the terms appearing in Eqs. 10 and 11 can be found in ref. 9.
To identify clusters of crystal-like molecules, we have used an approach based on graph theory. We have built a graph based on the connectivity matrix of urea molecules in the Cartesian space and their degree of crystallinity. A depth-first search algorithm was then applied to identify clusters as connected components of the graph, similarly to the algorithm used in ref. 46 for the identification of crystal nuclei obtained from undercooled liquid GeTe. This clustering technique is used to compute variables n, , , and used to represent FESs reported in Figs. 6 and 8.
These variables are defined as follows:
-
n:
number of urea molecules coordinated by with four or more other urea molecules, forming the largest connected cluster regardless of their respective orientation; molecules are considered connected when they are within a coordination sphere of radius 0.6 nm;
-
no:
number of urea molecules forming the largest connected cluster possessing a crystal-like configuration; urea molecules are considered to be crystal-like when the order parameter . has been computed as defined in ref. 9, considering the urea carbonyl bond as vector defining the mutual orientation of urea molecules;
-
NI:
number of crystal-like ordered molecules in the largest cluster, characterized by a form I configuration;
-
NII:
number of crystal-like ordered molecules in the largest cluster, characterized by a form II configuration.
To distinguish between form I and form II molecules, both molecular order parameters and were considered. Molecules were assigned to a form I configuration if and , and to a form II configuration if and These criteria reflect the position of basins identifying form I and form II in the FES obtained for urea nucleation from its melt reported in figure 3 of ref. 9.
Acknowledgments
M.S. thanks Baron Peters, Gabriele Cesare Sosso, and Stefano Corni for insightful discussions and precious advice. We acknowledge the computational resources provided by the Swiss Center for Scientific Computing and the Brutus Cluster at Eidgenössiche Technische Hochschule Zurich. M.P. acknowledges European Union Grant ERC-2009-AdG-247075 and the National Centres of Competence in Research “Materials’ Revolution: Computational Design and Discovery of Novel Materials” project for funding.
Footnotes
The authors declare no conflict of interest.
References
- 1.ten Wolde PR, Frenkel D. Enhancement of protein crystal nucleation by critical density fluctuations. Science. 1997;277(5334):1975–1978. doi: 10.1126/science.277.5334.1975. [DOI] [PubMed] [Google Scholar]
- 2.Auer S, Frenkel D. Prediction of absolute crystal-nucleation rate in hard-sphere colloids. Nature. 2001;409(6823):1020–1023. doi: 10.1038/35059035. [DOI] [PubMed] [Google Scholar]
- 3.Trudu F, Donadio D, Parrinello M. Freezing of a Lennard-Jones fluid: From nucleation to spinodal regime. Phys Rev Lett. 2006;97(10):105701. doi: 10.1103/PhysRevLett.97.105701. [DOI] [PubMed] [Google Scholar]
- 4.Santiso EE, Trout BL. A general set of order parameters for molecular crystals. J Chem Phys. 2011;134(6):064109. doi: 10.1063/1.3548889. [DOI] [PubMed] [Google Scholar]
- 5.Peters B. Competing nucleation pathways in a mixture of oppositely charged colloids: Out-of-equilibrium nucleation revisited. J Chem Phys. 2009;131(24):244103. doi: 10.1063/1.3271024. [DOI] [PubMed] [Google Scholar]
- 6.Anwar J, Zahn D. Uncovering molecular processes in crystal nucleation and growth by using molecular simulation. Angew Chem Int Ed Engl. 2011;50(9):1996–2013. doi: 10.1002/anie.201000463. [DOI] [PubMed] [Google Scholar]
- 7.Tribello GA, Bruneval F, Liew C, Parrinello M. A molecular dynamics study of the early stages of calcium carbonate growth. J Phys Chem B. 2009;113(34):11680–11687. doi: 10.1021/jp902606x. [DOI] [PubMed] [Google Scholar]
- 8.Zahn D. Atomistic mechanism of NaCl nucleation from an aqueous solution. Phys Rev Lett. 2004;92(4):040801. doi: 10.1103/PhysRevLett.92.040801. [DOI] [PubMed] [Google Scholar]
- 9.Giberti F, Salvalaglio M, Mazzotti M, Parrinello M. Insight into the nucleation of urea crystals. Chem Eng Sci. 2014;121:51–59. [Google Scholar]
- 10.Giberti F, Tribello G, Parrinello M. Transient polymorphism in NaCl. J Chem Theory Comput. 2013;9(6):2526–2530. doi: 10.1021/ct4002027. [DOI] [PubMed] [Google Scholar]
- 11.Knott B, Molinero V, Doherty M, Peters B. Homogeneous nucleation of methane hydrates: Unrealistic under realistic conditions. J Am Chem Soc. 2012;134(48):19544–19547. doi: 10.1021/ja309117d. [DOI] [PubMed] [Google Scholar]
- 12.Laio A, Parrinello M. Escaping free-energy minima. Proc Natl Acad Sci USA. 2002;99(20):12562–12566. doi: 10.1073/pnas.202427399. [DOI] [PMC free article] [PubMed] [Google Scholar]
- 13.Wang F, Landau DP. Efficient, multiple-range random walk algorithm to calculate the density of states. Phys Rev Lett. 2001;86(10):2050–2053. doi: 10.1103/PhysRevLett.86.2050. [DOI] [PubMed] [Google Scholar]
- 14.Barducci A, Bussi G, Parrinello M. Well-tempered metadynamics: A smoothly converging and tunable free-energy method. Phys Rev Lett. 2008;100(2):020603. doi: 10.1103/PhysRevLett.100.020603. [DOI] [PubMed] [Google Scholar]
- 15.Bolhuis PG, Dellago C, Chandler D. Reaction coordinates of biomolecular isomerization. Proc Natl Acad Sci USA. 2000;97(11):5877–5882. doi: 10.1073/pnas.100127697. [DOI] [PMC free article] [PubMed] [Google Scholar]
- 16.Voter AF. A method for accelerating the molecular dynamics simulation of infrequent events. J Chem Phys. 1997;106(11):4665–4677. [Google Scholar]
- 17.Grubmüller H. Predicting slow structural transitions in macromolecular systems: Conformational flooding. Phys Rev E Stat Phys Plasmas Fluids Relat Interdiscip Topics. 1995;52(3):2893–2906. doi: 10.1103/physreve.52.2893. [DOI] [PubMed] [Google Scholar]
- 18.Huber T, Torda AE, van Gunsteren WF. Local elevation: A method for improving the searching properties of molecular dynamics simulation. J Comput Aided Mol Des. 1994;8(6):695–708. doi: 10.1007/BF00124016. [DOI] [PubMed] [Google Scholar]
- 19.Allen RJ, Valeriani C, Rein Ten Wolde P. Forward flux sampling for rare event simulations. J Phys Condens Matter. 2009;21(46):463102. doi: 10.1088/0953-8984/21/46/463102. [DOI] [PubMed] [Google Scholar]
- 20.Snow CD, Nguyen H, Pande VS, Gruebele M. Absolute comparison of simulated and experimental protein-folding dynamics. Nature. 2002;420(6911):102–106. doi: 10.1038/nature01160. [DOI] [PubMed] [Google Scholar]
- 21.Hamelberg D, de Oliveira CAF, McCammon JA. Sampling of slow diffusive conformational transitions with accelerated molecular dynamics. J Chem Phys. 2007;127(15):155102. doi: 10.1063/1.2789432. [DOI] [PubMed] [Google Scholar]
- 22.Dama JF, Parrinello M, Voth GA. Well-tempered metadynamics converges asymptotically. Phys Rev Lett. 2014;112(24):240602. doi: 10.1103/PhysRevLett.112.240602. [DOI] [PubMed] [Google Scholar]
- 23.Salvalaglio M, Tiwary P, Parrinello M. Assessing the reliability of dynamics reconstructed from metadynamics. J Chem Theory Comput. 2014;10(4):1420–1425. doi: 10.1021/ct500040r. [DOI] [PubMed] [Google Scholar]
- 24.Tiwary P, Parrinello M. From metadynamics to dynamics. Phys Rev Lett. 2013;111(23):230602. doi: 10.1103/PhysRevLett.111.230602. [DOI] [PubMed] [Google Scholar]
- 25.Bonomi M, Barducci A, Parrinello M. Reconstructing the equilibrium Boltzmann distribution from well-tempered metadynamics. J Comput Chem. 2009;30(11):1615–1621. doi: 10.1002/jcc.21305. [DOI] [PubMed] [Google Scholar]
- 26.Salvalaglio M, Vetter T, Mazzotti M, Parrinello M. Controlling and predicting crystal shapes: The case of urea. Angew Chem Int Ed Engl. 2013;52(50):13369–13372. doi: 10.1002/anie.201304562. [DOI] [PubMed] [Google Scholar]
- 27.Grossier R, Veesler S. Reaching one single and stable critical cluster through finite-sized systems. Cryst Growth Des. 2009;9(4):1917–1922. [Google Scholar]
- 28.Reguera D, Bowles RK, Djikaev Y, Reiss H. Phase transitions in systems small enough to be clusters. J Chem Phys. 2003;118:340–353. [Google Scholar]
- 29.Wedekind J, Reguera D, Strey R. Finite-size effects in simulations of nucleation. J Chem Phys. 2006;125(21):214505. doi: 10.1063/1.2402167. [DOI] [PubMed] [Google Scholar]
- 30.Schmelzer JWP, Abyzov AS. Comments on the thermodynamic analysis of nucleation in confined space. J Non-Cryst Solids. 2014;384:2–7. [Google Scholar]
- 31.Davey RJ, Schroeder SLM, ter Horst JH. Nucleation of organic crystals—a molecular perspective. Angew Chem Int Ed Engl. 2013;52(8):2166–2179. doi: 10.1002/anie.201204824. [DOI] [PubMed] [Google Scholar]
- 32.Garetz BA, Aber JE, Goddard NL, Young RG, Myerson AS. Nonphotochemical, polarization-dependent, laser-induced nucleation in supersaturated aqueous urea solutions. Phys Rev Lett. 1996;77(16):3475–3476. doi: 10.1103/PhysRevLett.77.3475. [DOI] [PubMed] [Google Scholar]
- 33.Knott B, Doherty M, Peters B. A simulation test of the optical Kerr mechanism for laser-induced nucleation. J Chem Phys. 2011;134(15):154501. doi: 10.1063/1.3574010. [DOI] [PubMed] [Google Scholar]
- 34.Knott BC, LaRue JL, Wodtke AM, Doherty MF, Peters B. Communication: Bubbles, crystals, and laser-induced nucleation. J Chem Phys. 2011;134(17):171102. doi: 10.1063/1.3582897. [DOI] [PubMed] [Google Scholar]
- 35.Swaminathan S, Craven BM. The crystal structure and molecular thermal motion of urea at 12, 60 and 123 k from neutron diffraction. Acta Crystallogr B. 1984;40:300–306. [Google Scholar]
- 36.Ozpinar GA, Peukert W, Clark T. An improved generalized AMBER force field (GAFF) for urea. J Mol Model. 2010;16(9):1427–1440. doi: 10.1007/s00894-010-0650-7. [DOI] [PubMed] [Google Scholar]
- 37.Van Santen RA. The Ostwald step rule. J Phys Chem. 1984;88:5768–5769. [Google Scholar]
- 38.Salvalaglio M, Vetter T, Giberti F, Mazzotti M, Parrinello M. Uncovering molecular details of urea crystal growth in the presence of additives. J Am Chem Soc. 2012;134(41):17221–17233. doi: 10.1021/ja307408x. [DOI] [PubMed] [Google Scholar]
- 39.Cornell W, et al. A 2nd generation force field for the simulation of proteins, nucleic-acids, and organic molecules. J Am Chem Soc. 1995;117(19):5179–5197. [Google Scholar]
- 40.Wang J, Wolf RM, Caldwell JW, Kollman PA, Case DA. Development and testing of a general amber force field. J Comput Chem. 2004;25(9):1157–1174. doi: 10.1002/jcc.20035. [DOI] [PubMed] [Google Scholar]
- 41.Bussi G, Donadio D, Parrinello M. Canonical sampling through velocity rescaling. J Chem Phys. 2007;126:014101. doi: 10.1063/1.2408420. [DOI] [PubMed] [Google Scholar]
- 42.Parrinello M, Rahman A. Polymorphic transitions in single crystals—a new molecular-dynamics method. J Appl Phys. 1981;52:7182–7190. [Google Scholar]
- 43.Bonomi M, et al. PLUMED: A portable plugin for free-energy calculations with molecular dynamics. Comput Phys Commun. 2009;180(10):1961–1972. [Google Scholar]
- 44.Tiwary P, Parrinello M. A time-independent free energy estimator for metadynamics. J Phys Chem B. 2014 doi: 10.1021/jp504920s. [DOI] [PubMed] [Google Scholar]
- 45.Salvalaglio M, Giberti F, Parrinello M. 1,3,5-Tris(4-bromophenyl)benzene prenucleation clusters from metadynamics. Acta Crystallogr C Struct Chem. 2014;70(Pt 2):132–136. doi: 10.1107/S2053229613026946. [DOI] [PubMed] [Google Scholar]
- 46.Sosso GC, Miceli G, Caravati S, Giberti F, Behler J, Bernasconi M. Fast crystallization of the phase change compound gete by large-scale molecular dynamics simulations. J Phys Chem Lett. 2013;4(46):4241–4246. doi: 10.1021/jz402268v. [DOI] [PubMed] [Google Scholar]