

Significance
The observations presented here demonstrate that inhibition of the BET bromodomain protein, BRD4, is a potential therapeutic approach to high-grade epithelial ovarian cancers that exhibit elevated MYCN expression. As BRD4 inhibitors enter clinical studies, these findings provide a rationale for stratification of patients in whom to test the effects of BRD4 inhibition.
Keywords: ovarian cancer, in vivo screen, targeted therapy, BRD4, MYCN
Abstract
High-grade serous ovarian carcinoma (HGSOC) is the most common and aggressive form of epithelial ovarian cancer, for which few targeted therapies exist. To search for new therapeutic target proteins, we performed an in vivo shRNA screen using an established human HGSOC cell line growing either subcutaneously or intraperitoneally in immunocompromised mice. We identified genes previously implicated in ovarian cancer such as AURKA1, ERBB3, CDK2, and mTOR, as well as several novel candidates including BRD4, VRK1, and GALK2. We confirmed, using both genetic and pharmacologic approaches, that the activity of BRD4, an epigenetic transcription modulator, is necessary for proliferation/survival of both an established human ovarian cancer cell line (OVCAR8) and a subset of primary serous ovarian cancer cell strains (DFs). Among the DFs tested, the strains sensitive to BRD4 inhibition revealed elevated expression of either MYCN or c-MYC, with MYCN expression correlating closely with JQ1 sensitivity. Accordingly, primary human xenografts derived from high-MYCN or c-MYC strains exhibited sensitivity to BRD4 inhibition. These data suggest that BRD4 inhibition represents a new therapeutic approach for MYC-overexpressing HGSOCs.
Epithelial ovarian carcinoma (EOC) is often lethal, in part because it is often first detected at an advanced stage. Despite a high initial response rate (∼80%) to carboplatin and paclitaxel chemotherapy, most such cancers eventually recur, accompanied by acquired resistance to chemotherapy. This history typically results in death within 5 years (1). High-grade serous ovarian carcinoma (HGSOC) is the most common form of EOC and accounts for two thirds of its deaths. Genetically, the most prominent hallmarks of these cancers are mutations in TP53 and significant gene copy number aberrations (2–4).
The development of relevant targeted therapeutics in HGSOC has been limited, in part, by a lack of validated oncogenic drivers. A comprehensive analysis of numerous tumors by The Cancer Genome Atlas (TCGA) project confirmed the absence of high-frequency oncogenic point mutations in druggable genes (3). In addition, widespread DNA copy number changes in ovarian cancers have, with few exceptions, made difficult the identification of high-frequency, focally amplified genes encoding druggable proteins (3, 5).
To detect genes active in the in vivo expansion of HGSOC, we designed an in vivo shRNA screen for use in human xenografts of an HGSOC ovarian cancer cell line (OVCAR8) and tested the effects on its viability of depleting each of ∼800 druggable genes. We explored the therapeutic relevance of the BET bromodomain protein BRD4, which was revealed as a druggable gene product in this screen, by assessing the outcome of depleting or inhibiting its activity in primary HGSOC cell strains (DFs). These tumors were predominantly derived from patients with chemotherapy-resistant HGSOC. Those primary tumor strains which expressed BRD4 and overexpressed either MYCN or c-MYC lost proliferative capacity following BRD4 depletion or inhibition in culture as well as in vivo.
Results
An shRNA-Based In-Tumor Ovarian Cancer Screen Identified 40 Candidate Therapeutic Target Genes.
We designed an shRNA-based negative selection screen to search for genes necessary for survival/proliferation of an ovarian cancer cell line growing as tumor masses in immunocompromised mice (described in Fig. 1A and SI Materials and Methods). The screen used a lentiviral library encoding ∼8,000 shRNAs directed at all human protein kinases plus ∼300 putative oncoproteins with an average of 10 shRNAs per gene. OVCAR8 (OV8) cells, an established human, serous ovarian cancer cell line, were infected with pools of ∼2,000 shRNA expressing lentiviruses, each of which included ∼100 control shRNAs designed to target irrelevant genes (LacZ, GFP, RFP, and Luc). An aliquot of infected cells was kept as a reference sample, whereas the rest was injected into immunocompromised NGS mice, which led to tumor formation. The relative abundance of each shRNA in each tumor sample was compared with its original abundance in the reference sample by sequencing. This value was then expressed as fold change (FC). The rationale was that a cell carrying an shRNA sequence affecting its proliferation/survival would be selected against during tumor growth and thus be underrepresented in the emerging tumor and result in an FC <1.
Fig. 1.

shRNA-based in vivo screen. (A) Experimental scheme of an in vivo shRNA screen. (B and C) Comparison of shRNA fold change values (FC) obtained from different segments of the pilot screen (∼2k shRNA). IP, solid tumors obtained by injecting tumor cells intraperitoneally; ascites, ascitic cells obtained by injecting the cells intraperitoneally; SQ, tumors obtained by injecting the cells subcutaneously. IP and SQ tumors developed in separate animals of the same NSG strain (D) Distribution of shRNA z-scores obtained from the full subcutaneous screen (4xshRNA lentiviral library pools of ∼2k each). The blue dotted line represents the distribution of the CONTROL (CTRL) shRNAs scores. Scores were calculated as described in SI Materials and Methods. (E) Scatter plot representing the 40 identified candidate target genes. Each gene is represented by a dot in the plot that reflects the first and second lowest shRNA-associated z-scores (best and second best shRNA, respectively). Highlighted in red are the genes PLK1 and ERB3, which were routinely used as positive controls in OV8. In yellow are the previously reported candidate therapeutic targets AURKA, CDK2, and FRAP1(mTOR). In green is the BET bromodomain factor BRD4. (F) Table showing the 40 candidate target genes and for each, the second lowest z-score obtained in the screen (second best shRNA z-score). (G) Matrix showing the representative categories of Gene Ontology biological process (GOBP) that were significantly enriched in the pool of candidate target genes with respect to the pool containing all tested genes. Also shown are the genes associated with each category. (P values and GO subcategories are shown in Table S2).
To determine whether cells growing in mice subcutaneously or intraperitoneally yielded similar or different results in the screen, we performed a pilot screen with a single library pool of 2,000 lentiviruses in each condition (Fig. 1). Infected cells were injected either intraperitoneally or subcutaneously (SQ) and tumor material was subsequently harvested from each tumor-bearing animal. For peritoneal samples, ascitic fluid-containing tumor cells (ascites) and solid tumors (IP) were separately collected and analyzed. Overall, the experimental shRNA FC values were unexpectedly similar across the three experimental settings (SQ, ascites, and IP; Fig. 1 B and C). We also observed a few outlier shRNAs the effects, of which were not reproduced by other shRNAs that targeted the same genes.
The remainder of the in vivo screen was then conducted in the subcutaneous setting, which led to less variability among replicate results than did IP tumors. Within each pool, each shRNA FC value was assigned a z-score. This value represents the number of standard deviations (σ) by which it differs from the average of the control shRNA distribution (see SI Materials and Methods for additional details). The distribution of these scores (Fig. 1D) revealed the presence of two partially overlapping normal distributions, which implied that significantly underrepresented shRNAs concentrated in a distribution that peaked between −2σ and −3σ. To minimize the false-positive discovery rate, we defined a candidate target gene on the basis of two parameters: (i) at least three shRNAs targeting the same gene scored less than −2σ and (ii) the average FC (defined as the average of all of the shRNAs FC targeting such a gene) was significantly lower than what was observed for the control genes (see SI Materials and Methods for additional details).
We identified 40 candidate target genes that met both of these criteria (Fig. 1F and Table S1). For each, the targeting shRNAs with the lowest z-score (best shRNA) and the second lowest z-score (second best shRNA) had similar z-score values (Fig. 1E). Notably, the candidate target genes included ERBB3 and PLK1, which were routinely used as positive controls in OV8, supporting the validity of the analysis. It also included genes reported or previously suggested to be potential targets in ovarian cancer such as ERBB3 itself (6), AURKA (7), CDK2 (8), and FRAP1 (mTOR) (9). However, other candidate genes that emerged in the screen were reported to be overexpressed in ovarian cancer or suggested to have a putative functional role in this disease, including CKB (10, 11), NME1 (12), PFKFB3 (13), PLK1 (14), PRKAA1 and PRKAB2 (15), PIK3CD (16) ATM (17), and FGFR1 (18). Most of the other candidate target genes detected in this screen were heretofore unreported in HGSOCs. A Gene Ontology (GO) term functional enrichment analysis aimed at identifying biological processes represented by the pool of candidate genes is reported in Fig. 1G.
Candidate Target Gene Evaluation in OV8 and Ovarian Cancer Primary Cell Strains (DFs).
To further test the validity of the screening results, we sampled the effects of 15 candidate genes (Fig. 2). Each of them was selected because there were available data regarding the expression of its protein product in at least a subset of primary HGSOC human tumors (available literature and the public Protein Atlas database) (19). We tested the effect of depleting each relevant mRNA on ovarian cancer cell proliferation/survival by using, in each case, the gene-specific shRNA that resulted in the second lowest z-score in the screen (second best shRNA). This approach would likely result in an effect large enough to be measured in further assays while reducing the probability of observing effects exclusively associated with off-target activity of the single shRNA that gave the best readout in the screen. The ability of each relevant hairpin to deplete its target RNA in OV8 cells was measured by quantitative RT-PCR (qRT-PCR) (Fig. 2A). In parallel, we assessed its effect on OV8 proliferation/survival (Fig. 2B). We observed that all tested shRNAs depleted their respective target mRNA and compromised survival/proliferation in cultured OV8 cells.
Fig. 2.

Candidate target gene evaluation in OV8. (A) qRT-PCR analysis of OV8 cells after infection (MOI > 1) with each of the second best shRNAs and 48-h selection with Puromycin. For each gene, expression values are normalized by reference to that of the housekeeping gene, Tubulin, and are reported as a percentage of the levels obtained when infecting the cells with the control lentivirus, shLuc. An additional control lentivirus shCTRL is also reported. (B) Cell proliferation assay. OV8 cells were infected at MOI > 1 and selected for 48 h with Puromycin. OV8 cells used in this assay express luciferase. Cell number was titered by Luciferase expression immediately after selection (day 0) and 4 d later (day 4). For each shRNA is reported the fold increase in Luciferase signal over 4 d of culture. Where reported, error bars represent standard deviations of triplicate measurements. (C) GFP competition assay outline. (D) GFP competition assay results.
To assess the therapeutic potential of these genes in primary HGSOC strains, we designed a GFP-based competition assay to overcome the relatively low lentiviral infection efficiency of these cells (Fig. 2C). Briefly, each shRNA was cloned in a GFP-expressing lentiviral vector, so that all cells expressing a hairpin would be GFP positive (GFP+). We then measured, over time, the fraction of each infected culture that scored as GFP+. The expectation was that, if an shRNA linked to the GFP gene inhibited proliferation or viability, the percentage of GFP+ cells would drop over time.
We first validated this approach by confirming that depletion of each of the 15 selected candidate genes significantly affected survival/proliferation of OV8 cells (Fig. 2D). We next selected two primary HGSOC strains, DF14 and DF37, that displayed the best lentiviral infection efficiency and assessed the expression of these genes (Fig. S1A) and the effect of their depletion by GFP competition assay (Fig. S1 B and C). The results showed that the sampled genes were expressed in both primary strains and that the introduction of shRNA directed against the relevant candidate gene mRNA resulted in decreased proliferation/survival.
BRD4 Activity Is Necessary for OV8 Proliferation.
Among the identified candidate genes, we focused on BRD4, a BET bromodomain protein-encoding gene whose role in ovarian cancer had not been investigated previously. Moreover, its product can be functionally inhibited by readily available small molecule inhibitors. Multiple BRD4 shRNAs (shBRD4) used in the screen were tested for their effect on proliferation rate in OV8 (Fig. 3A). The top scoring shBRD4s from the screen significantly decreased the proliferation rate of OV8 cells as shown by GFP competition assay (Fig. 3B). By contrast, the shBRD4s that did not score positively in the screen (shBRD4, 5 and 6) (i) failed to deplete the target mRNA as extensively (Fig. S2A) and (ii) did not significantly affect OV8 proliferation (Fig. 3B). Overall, the effects on proliferation rate were, in general, proportional to the extent of BRD4 mRNA depletion. In addition, because the effect of shBRD4 could be rescued by expression of an ectopic BRD4 gene (Fig. S2 B–G), we concluded that the observed effects both in culture and in xenografts were BRD4 specific.
Fig. 3.

BRD4 depletion or inhibition impairs OV8 proliferation. (A) List of BRD4 targeting shRNAs analyzed in the screen and selected for further testing. For each shRNA is reported the fold change value (FC) and the z-score obtained in the screen. (B) GFP competition assays with multiple shRNAs directed against BRD4 (shBRD4). (C and D) OV8 proliferation curves in the presence of increasing concentrations of the active BRD4 inhibitor JQ1-S (C) or the inactive enantiomer JQ1-R (D). Cell viability was measured by Cell Titer Glow assay (i.e., for ATP concentration) and for each time point is reported as the percent of the value obtained on day 0. (E–G) OV8 cells were infected with each of the indicated shRNAs at MOI > 1, selected for 48 h with Puromycin and plated for further experiments. shCTRL and shLuc are control lentiviruses. shA and shB are two additional control shRNAs that affect proliferation but not BRD4 levels. (E) Western blot analysis of BRD4 expression in OV8 (−) and OV8 infected with each of the indicated shRNAs. (F) JQ1 dose–response curves in OV8 (−) and OV8 infected with each of the indicated shRNAs. Cell viability was measured by the Cell Titer Glow assay, and each value was reported as a percentage of the effect obtained by using the vehicle alone. (G) Comparison of the EC50 values (micromolar) obtained from the JQ1 dose–response curves performed in the various conditions. 95% confidence intervals (95% CI) are also shown. Where reported, error bars represent standard deviations of triplicate measurements.
To further evaluate the role of BRD4 in OV8 cells, we asked whether the specific BET bromodomain inhibitor, JQ1 (20), affected the proliferation/viability of OV8 (Fig. 3C). We analyzed cell proliferation in the face of increasing JQ1 concentrations and found that OV8 proliferation in culture was inhibited at concentrations as low as ∼125 nM. By contrast, we detected no effect of the inactive JQ1 enantiomer JQ1-R (Fig. 3D), showing that proliferation inhibition was due to the bromodomain inhibitory activity of the JQ1 molecule. To test whether the JQ1 effect was mediated by BRD4 inhibition, we performed JQ1 dose–response curves on OV8 after BRD4 depletion (Fig. 3 E–G). We reasoned that, if JQ1 acts by inhibiting BRD4 function, decreasing the amount of the latter might reduce the concentration of JQ1 needed to produce the same antiproliferative effect. The JQ1 EC50 was unchanged after transducing two unrelated shRNAs (shA and shB), each of which suppressed proliferation to the same extent as shBRD4 (data not shown). By contrast, on BRD4 depletion with three different shBRD4 species, there was a consistent and significant approximate fourfold reduction of the half maximal effective concentration (EC50) of JQ1 (Fig. 3 F and G), implying that the action of JQ1 in OV8 is mediated by its effects on BRD4.
Sensitivity to BRD4 Inhibition in Primary Ovarian Cancer Strains (DFs) Correlates with Either MYCN or c-MYC Overexpression.
We generated JQ1 dose–response curves in a set of 20 ovarian cancer primary strains (DFs) mainly derived from HGSOC patients. JQ1 sensitivity varied considerably among these strains (Fig. 4A and Fig. S3A). We clustered the DFs based on the maximal inhibitory effect (Emax) observed at 2.5 μM JQ1 into five groups with increasing sensitivity from group 1 (which includes the JQ1 refractory DF strains) to group 5 (which includes the most highly sensitive DFs). Sensitivity to BRD4 inhibition was confirmed after testing two additional BET inhibitors (Fig. S3 B and C). DF14 and DF37 clustered among the JQ1-sensitive DFs in group 5, consistent with their observed shBRD4 sensitivity (Fig. S4). In addition, concentrations as low as ∼60 nM JQ1 were sufficient to inhibit their proliferation (Fig. S5 A and B). As in OV8, no sensitivity was observed with the inactive enantiomer JQ1-R (Fig. S5 C and D).
Fig. 4.

Sensitivity of various primary ovarian cancer cell strains (DF) to JQ1 and its relationship to c-MYC or MYCN overexpression. (A) JQ1 dose–response curves performed on 20 different primary serous ovarian cancer cell strains (DFs). Dose–response curve data were integrated by nonlinear regression. DFs were clustered in five groups on the basis of their JQ1 maximum effect (Emax), which, in turn, corresponds to the minimum measured viability value. (B–D) qRT-PCR analysis of BRD4 (B), MYCN (C), and c-MYC (D) in DF strains. Expression values are normalized by reference to that of the housekeeping gene, 36B4, and are reported as a percentage of the levels obtained in the JQ1-refractory strain, DF59. (E) Western blot analysis of a subset of DF strains. Red, JQ1 highly sensitive (group 5); orange, group 4; black: JQ1-refractory (group1). (F) Anticorrelation of c-MYC and MYCN expression in DF strains and definition of ”c-MYC“ and ”MYCN“ strains on the basis of their relative c-MYC and MYCN mRNA levels expressed as z-scores. (G) Pearson correlation of MYCN expression and JQ1 Emax in the MYCN DF population. (H) Pearson correlation of c-MYC expression and JQ1 maximal effect (Emax) in the c-MYC DF population. (I and J) qRT-PCR analysis of c-MYC and MYCN expression after 24-h exposure to 1 μM JQ1 (+) or vehicle a (−) in the MYCN-high strain DF37 (I) and the c-MYC-high strain DF149 (J). Expression values are normalized by comparison with that of 36B4 and reported for each gene as a percentage of the levels obtained with vehicle alone. (K) Western blot analysis in selected DF strains of c-MYC and MYCN expression after 48-h exposure to 1 μM JQ1 (+), the inactive JQ1 enantiomer (R), or vehicle alone (−). DF14 and DF37 represent MYCN-high strains, DF86 and DF149 represent c-MYC-high strains, and DF181 is a JQ1-refractory MYCN-low/ c-MYC-low strain. Where reported, error bars represent standard deviations of triplicate measurements.
We observed that the BRD4 gene was focally amplified in ∼19% of the 559 ovarian cancers available in the TCGA database with BRD4 mRNA levels correlating with its amplification (Fig. S6). However, no significant correlation was observed in the DF collection between BRD4 mRNA expression and JQ1 sensitivity (Fig. 4B), suggesting that the pharmacologic role of BRD4 might be defined by factors beyond the amplitude of its RNA expression.
Recent reports have associated JQ1 sensitivity with c-MYC expression in AML (21) and multiple myeloma (22) or with MYCN expression in neuroblastoma (23). We evaluated c-MYC and MYCN expression levels in DFs (Fig. 4 C and D) and observed that the DF strains with the highest levels of c-MYC or MYCN expression both at the mRNA and protein levels (Fig. 4 C–E) were those that were the most JQ1 sensitive. Interestingly, where detected among all DF strains tested, c-MYC and NMYC overexpression were mutually exclusive (Fig. 4F). This c-MYC/MYCN anticorrelation was also present in data collected from human HGSOC tumor material in the TCGA database (Fig. S7A). These data suggest that prevalent expression of different Myc isoforms might indicate the existence of different biological mechanisms driving proliferation/survival.
We therefore sorted the DF strains on the basis of their prevalent MYC isoform expression. For c-MYC or MYCN, each expression level was converted to a z-score representing the number of standard deviations it differed from the average expression value. MYCN DF strains were defined as those with a MYCN mRNA z-score higher than the corresponding c-MYC z-score, and c-MYC DFs were defined vice versa (Fig. 4F). In the MYCN population, JQ1 sensitivity strongly correlated with MYCN expression levels (Fig. 4G), suggesting that MYCN expression may be a strong predictor of JQ1 activity. Correlation of c-MYC expression with JQ1 sensitivity in the c-MYC population was less prominent and not statistically significant (Fig. 4H). Nonetheless, cMYC DF strains that exhibited the highest levels of c-MYC expression were sensitive to JQ1, although the degree of sensitivity varied. This observation suggests that, in the absence of MYCN, high c-MYC expression might confer increased sensitivity to JQ1 by comparison with non–MYC-overexpressing cells. In this regard, all DF strains with low levels of both c-MYC and MYCN mRNA were refractory or minimally sensitive to JQ1 (respectively, groups 1 and 2 in Fig. 4A). Of note, two DF strains (DF216 and DF113) in group 4 displayed some sensitivity to JQ1 that was independent of either c-MYC or MYCN high expression, implying that c-MYC or MYCN gene overexpression is not the only reflection of JQ1 sensitivity.
We also found that exposure of JQ1-sensitive DFs to JQ1 led to selective down-regulation of MYCN expression in the MYCN strains and selective down-regulation of c-MYC in the c-MYC strains (Fig. 4 I–K). We observed no down-regulation of either isoform in the JQ1-refractory strain DF181 (Fig. 4K). These results were confirmed using two additional BRD4 inhibitors (Fig. S7 B and C). Moreover, we observed MYCN down-regulation following BRD4 depletion in two MYCN-high strains (Fig. S4D). These data suggest that MYC pathway down-regulation plays a role in mediating toxicity following BRD4 inhibition.
Primary-Derived Xenografts That Overproduce Either c-MYC or MYCN Are Sensitive to BRD4 Inhibition.
To further test BRD4 inhibition as a possible therapeutic approach for MYCN- and certain c-MYC–overexpressing ovarian cancers, we evaluated JQ1 antitumor activity in three luciferized ovarian cancer primary-derived xenograft (PDX) models (Fig. 5). These models were (i) DF14-Luc, MYCN-high JQ1-sensitive; (ii) DF86-Luc, c-MYC-high, JQ1-sensitive; and (iii) DF181-Luc, cMyc-low, MYCN-low, JQ1-refractory (Fig. 4 A and K). Each model was injected into the peritoneal cavity of 20 immunocompromised NSG mice; 1 wk after injection, mice were divided into two groups dosed daily with either 50 mg/kg JQ1 intraperitoneally or with vehicle. Tumor growth was measured weekly by bioluminescent imaging (BLI). Western blot analysis confirmed the relative expression levels of MYCN and c-MYC among the DF14-luc, DF86-luc, and DF181-luc PDX models (data not shown). JQ1 treatment was well tolerated by all PDX model-bearing mice. We observed that JQ1 abrogated tumor proliferation only in those tumors expressing high levels of the relevant myc isoform (DF14-Luc and DF86-Luc PDX), whereas no effect was observed in DF181-Luc PDX. These results were consistent with ex vivo observations and validate BRD4 as a potential target for inhibition in certain ovarian cancers.
Fig. 5.
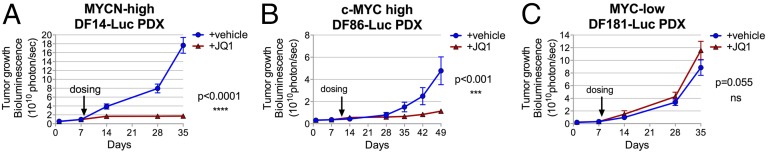
BRD4 inhibition has antitumor effects in PDX xenografts derived from MYCN-high and c-MYC-high primary ovarian cancer strains. (A–C) JQ1 antitumor activity was evaluated in three luciferase-producing ovarian PDX models. Mice bearing xenografts derived from primary DF14 (MYCN-high) (A), DF86 (c-MYC-high) (B), or the low N and c-MYC DF181 (MYC-low) (C) were treated with vehicle (−) or JQ1 (+JQ1) (50 mg/kg once a day, intraperitoneally) for the indicated times starting on day 7 after implantation. Tumor growth was measured by weekly bioluminescence (BLI). Statistical significance of the results was evaluated using a two-way ANOVA test. Error bars represent standard deviations of measurements obtained for each group (n = 10).
Discussion
The tumor microenvironment plays a major role in the process of tumor progression (24). Thus, screens conducted in an in vitro setting may, in some instances, be blind to certain proteins whose function is required for in vivo tumor cell survival. Our pilot screen results suggest that the murine peritoneal or subcutaneous microenvironment did not significantly alter tumor cell dependency on the genes being screened. However, we screened a biased subset of essential genes such as kinases and oncoproteins that are known to have a central role in cell biology. It is possible that, among these categories, the frequency of genes exhibiting a strikingly different outcome when targeted in the two different in vivo environments is lower than 0.5%, i.e., the detection limit. Therefore, a different set of studies may be needed to assess the impact of each microenvironment on in vivo tumor cell viability and proliferation.
Through the use of an in vivo subcutaneous tumor screen, we identified 40 candidate therapeutic target genes, of which 27 were novel and have not been reported previously as putative targets in ovarian cancer. To investigate the therapeutic potential of the candidate genes in a more clinically relevant setting, we used a library of clinically annotated primary ovarian cancer cells (DFs). These cells were derived from ovarian cancer patients’ ascites and passaged as nonadherent cultures and/or as mouse xenograft models (PDX). Our work confirmed the expression and proliferation/viability maintenance function of the selected subset of candidate genes identified in the screen in two primary strains (DF14 and DF37), suggesting that the in vivo screening method used was effective in identifying potential targets that will be applicable in clinical ovarian cancer.
Among the novel candidate therapeutic target genes identified, BRD4 has been recently reported to be a gene of interest in several hematological malignancies and solid tumors (20–23, 25–30). Sensitivity to its inhibition in other cancer cell species correlated with high levels of expression of either MYCN or c-MYC (21–23, 25, 26, 28). Consistently, we found that BRD4 inhibition by the selective BET bromodomain inhibitor, JQ1 (20), abrogated tumor growth in ovarian PDX models with high-MYCN or c-MYC expression and not in a strain with lower myc expression levels. This observation suggests that BRD4 inhibitors may be of therapeutic interest in a subset of ovarian cancer patients with this molecular phenotype.
Expression profiling of large cohorts of HGSOC tumors have pointed to the existence of four distinct molecular subtypes (3, 31), which collectively exhibit diverse pathological and clinical features (3, 31, 32). Notably, a molecular HGSOC subset, i.e., C5, has been defined by high level MYCN expression, which correlates with poor prognosis (32). Given the close correlation we observed between MYCN expression and JQ1 sensitivity, this group of patients might be a particularly interesting subset of ovarian cancer patients in whom BRD4-directed therapy could be explored. The correlation between c-MYC levels and JQ1 sensitivity was suggested but was also less prominent in our DF samples. However, it would be worth exploring the therapeutic potential of BRD4 inhibition in those patients whose tumors harbor amplification of the c-MYC locus with a corresponding increase in c-MYC expression to supernormal levels (3, 33).
The primary mechanism through which MYC family proto-oncogenes acquire oncogenic activity is by overexpression, suggesting that MYCN and c-MYC might be oncogenic drivers in the MYCN-high and c-MYC-high DF strains, respectively. MYC-driven cell proliferation was, indeed, reported to be a hallmark of cancers such as HGSOC that are characterized by elevated copy number changes (34).
We found that, on JQ1 treatment, there was selective down-regulation of the predominant MYC isoform in JQ1-sensitive DFs, consistent with the well-established role of BRD4 in promoting MYCN and c-MYC transcription (21–23, 35). Consistently, selectivity of gene down-regulation following BRD4 inhibition has been ascribed to the presence of superenhancer regions, occupied by BRD4, and associated with the transcriptional regulation of key lineage-specific oncogenes and survival genes (36). Thus, it is possible that JQ1 antitumor activity is mediated, at least in part, by down-regulation of MYC expression through super enhancer functional perturbation (36).
Moreover, it has recently been reported that BRD4 can be recruited to specific gene sites through interactions with sequence-specific transcription factors (TFs) (29, 30, 37). Thus, high expression of MYCN and c-MYC in DFs might also reflect the activity of TFs that operate upstream of MYC family genes and that rely on BRD4 interactions to fully promote MYC family transcription.
Further studies will be required to understand in more detail the role of BRD4 in the context of Myc isoform overexpressing primary HGSOC strains. A detailed analysis of the target value of the other genes identified in this screen will also be a future goal.
Materials and Methods
A detailed description of reagents and protocols used in this study can be found in SI Materials and Methods. These methods include the pooled negative-selection in-tumor screen, identification of candidate genes, BRD4 amplification analysis, ovarian cancer primary strains (DFs), and PDX model/drug efficacy studies.
Supplementary Material
Acknowledgments
We thank the Broad Institute RNAi Consortium for providing shRNAs; Amanda Christie and Haig Inguilizian for technical contributions; Rhamy Zeid and Alison M. Karst for contributions in exploring the role of BRD4 in ovarian cancer; Elodie Hatchi for helpful discussions and editing of the manuscript; and Stoil D. Dimitrov and Hua Wang for critical reading of the manuscript. We thank the other D.M.L. laboratory colleagues for helpful discussions and reagents and the Lurie family imaging center and the Belfer Institute for Applied Cancer Science for excellent work. This work was funded by the Liz Tilberis Grant (to J.F.L.) and the Ann Schreiber Mentored Investigator award (to M.G.B.) from the Ovarian Cancer Research Foundation, National Institutes of Health/National Cancer Institute Grant U01 CA176058 (to W.C.H.), the Dr. Miriam and Sheldon G. Adelson Medical Research Foundation (R.D.), and a gift from Deborah and Robert First (to Dana-Farber Cancer Institute, R.D., and D.M.L.).
Footnotes
The authors declare no conflict of interest.
This article contains supporting information online at www.pnas.org/lookup/suppl/doi:10.1073/pnas.1422165112/-/DCSupplemental.
References
- 1.Romero I, Bast RC., Jr Minireview: Human ovarian cancer: Biology, current management, and paths to personalizing therapy. Endocrinology. 2012;153(4):1593–1602. doi: 10.1210/en.2011-2123. [DOI] [PMC free article] [PubMed] [Google Scholar]
- 2.Ahmed AA, et al. Driver mutations in TP53 are ubiquitous in high grade serous carcinoma of the ovary. J Pathol. 2010;221(1):49–56. doi: 10.1002/path.2696. [DOI] [PMC free article] [PubMed] [Google Scholar]
- 3.Bell D, et al. Cancer Genome Atlas Research Network Integrated genomic analyses of ovarian carcinoma. Nature. 2011;474(7353):609–615. doi: 10.1038/nature10166. [DOI] [PMC free article] [PubMed] [Google Scholar]
- 4.Bowtell DDL. The genesis and evolution of high-grade serous ovarian cancer. Nat Rev Cancer. 2010;10(11):803–808. doi: 10.1038/nrc2946. [DOI] [PubMed] [Google Scholar]
- 5.Vaughan S, et al. Rethinking ovarian cancer: Recommendations for improving outcomes. Nat Rev Cancer. 2011;11(10):719–725. doi: 10.1038/nrc3144. [DOI] [PMC free article] [PubMed] [Google Scholar]
- 6.Sheng Q, et al. An activated ErbB3/NRG1 autocrine loop supports in vivo proliferation in ovarian cancer cells. Cancer Cell. 2010;17(3):298–310. doi: 10.1016/j.ccr.2009.12.047. [DOI] [PMC free article] [PubMed] [Google Scholar]
- 7.Umene K, et al. Aurora kinase inhibitors: Potential molecular-targeted drugs for gynecologic malignant tumors. Biomed Rep. 2013;1(3):335–340. doi: 10.3892/br.2013.91. [DOI] [PMC free article] [PubMed] [Google Scholar]
- 8.Etemadmoghadam D, et al. Resistance to CDK2 inhibitors is associated with selection of polyploid cells in CCNE1-amplified ovarian cancer. Clin Cancer Res. 2013;19(21):5960–5971. doi: 10.1158/1078-0432.CCR-13-1337. [DOI] [PubMed] [Google Scholar]
- 9.Husseinzadeh N, Husseinzadeh HD. mTOR inhibitors and their clinical application in cervical, endometrial and ovarian cancers: A critical review. Gynecol Oncol. 2014;133(2):375–381. doi: 10.1016/j.ygyno.2014.02.017. [DOI] [PubMed] [Google Scholar]
- 10.Huddleston HG, Wong K-K, Welch WR, Berkowitz RS, Mok SC. Clinical applications of microarray technology: Creatine kinase B is an up-regulated gene in epithelial ovarian cancer and shows promise as a serum marker. Gynecol Oncol. 2005;96(1):77–83. doi: 10.1016/j.ygyno.2004.08.047. [DOI] [PubMed] [Google Scholar]
- 11.Li X-H, et al. Knockdown of creatine kinase B inhibits ovarian cancer progression by decreasing glycolysis. Int J Biochem Cell Biol. 2013;45(5):979–986. doi: 10.1016/j.biocel.2013.02.003. [DOI] [PubMed] [Google Scholar]
- 12.Youn BS, et al. NM23 as a prognostic biomarker in ovarian serous carcinoma. Mod Pathol. 2008;21(7):885–892. doi: 10.1038/modpathol.2008.64. [DOI] [PubMed] [Google Scholar]
- 13.Atsumi T, et al. High expression of inducible 6-phosphofructo-2-kinase/fructose-2,6-bisphosphatase (iPFK-2; PFKFB3) in human cancers. Cancer Res. 2002;62(20):5881–5887. [PubMed] [Google Scholar]
- 14.Weichert W, et al. Polo-like kinase isoform expression is a prognostic factor in ovarian carcinoma. Br J Cancer. 2004;90(4):815–821. doi: 10.1038/sj.bjc.6601610. [DOI] [PMC free article] [PubMed] [Google Scholar]
- 15.Li C, Liu VW, Chiu PM, Chan DW, Ngan HY. Over-expressions of AMPK subunits in ovarian carcinomas with significant clinical implications. BMC Cancer. 2012;12:357. doi: 10.1186/1471-2407-12-357. [DOI] [PMC free article] [PubMed] [Google Scholar]
- 16.Fransson S, et al. p37δ is a new isoform of PI3K p110δ that increases cell proliferation and is overexpressed in tumors. Oncogene. 2012;31(27):3277–3286. doi: 10.1038/onc.2011.492. [DOI] [PubMed] [Google Scholar]
- 17.Ye Q, et al. Development of serous ovarian cancer is associated with the expression of homologous recombination pathway proteins. Pathol Oncol Res. 2014;20(4):931–938. doi: 10.1007/s12253-014-9776-8. [DOI] [PMC free article] [PubMed] [Google Scholar]
- 18.Cole C, et al. Inhibition of FGFR2 and FGFR1 increases cisplatin sensitivity in ovarian cancer. Cancer Biol Ther. 2010;10(5):495–504. doi: 10.4161/cbt.10.5.12585. [DOI] [PMC free article] [PubMed] [Google Scholar]
- 19.Uhlén M, et al. Towards a knowledge-based Human Protein Atlas. Nat Biotechnol. 2010;28(12):1248–1250. doi: 10.1038/nbt1210-1248. [DOI] [PubMed] [Google Scholar]
- 20.Filippakopoulos P, et al. Selective inhibition of BET bromodomains. Nature. 2010;468(7327):1067–1073. doi: 10.1038/nature09504. [DOI] [PMC free article] [PubMed] [Google Scholar]
- 21.Zuber J, et al. RNAi screen identifies Brd4 as a therapeutic target in acute myeloid leukaemia. Nature. 2011;478(7370):524–528. doi: 10.1038/nature10334. [DOI] [PMC free article] [PubMed] [Google Scholar]
- 22.Delmore JE, et al. BET bromodomain inhibition as a therapeutic strategy to target c-Myc. Cell. 2011;146(6):904–917. doi: 10.1016/j.cell.2011.08.017. [DOI] [PMC free article] [PubMed] [Google Scholar]
- 23.Puissant A, et al. Targeting MYCN in neuroblastoma by BET bromodomain inhibition. Cancer Discov. 2013;3(3):308–323. doi: 10.1158/2159-8290.CD-12-0418. [DOI] [PMC free article] [PubMed] [Google Scholar]
- 24.Taddei ML, Giannoni E, Comito G, Chiarugi P. Microenvironment and tumor cell plasticity: An easy way out. Cancer Lett. 2013;341(1):80–96. doi: 10.1016/j.canlet.2013.01.042. [DOI] [PubMed] [Google Scholar]
- 25.Mertz JA, et al. Targeting MYC dependence in cancer by inhibiting BET bromodomains. Proc Natl Acad Sci USA. 2011;108(40):16669–16674. doi: 10.1073/pnas.1108190108. [DOI] [PMC free article] [PubMed] [Google Scholar]
- 26.Dawson MA, et al. Inhibition of BET recruitment to chromatin as an effective treatment for MLL-fusion leukaemia. Nature. 2011;478(7370):529–533. doi: 10.1038/nature10509. [DOI] [PMC free article] [PubMed] [Google Scholar]
- 27.Lockwood WW, Zejnullahu K, Bradner JE, Varmus H. Sensitivity of human lung adenocarcinoma cell lines to targeted inhibition of BET epigenetic signaling proteins. Proc Natl Acad Sci USA. 2012;109(47):19408–19413. doi: 10.1073/pnas.1216363109. [DOI] [PMC free article] [PubMed] [Google Scholar]
- 28.Bandopadhayay P, et al. BET bromodomain inhibition of MYC-amplified medulloblastoma. Clin Cancer Res. 2014;20(4):912–925. doi: 10.1158/1078-0432.CCR-13-2281. [DOI] [PMC free article] [PubMed] [Google Scholar]
- 29.Shi J, et al. Disrupting the interaction of BRD4 with diacetylated Twist suppresses tumorigenesis in basal-like breast cancer. Cancer Cell. 2014;25(2):210–225. doi: 10.1016/j.ccr.2014.01.028. [DOI] [PMC free article] [PubMed] [Google Scholar]
- 30.Asangani IA, et al. Therapeutic targeting of BET bromodomain proteins in castration-resistant prostate cancer. Nature. 2014;510(7504):278–282. doi: 10.1038/nature13229. [DOI] [PMC free article] [PubMed] [Google Scholar]
- 31.Tothill RW, et al. Australian Ovarian Cancer Study Group Novel molecular subtypes of serous and endometrioid ovarian cancer linked to clinical outcome. Clin Cancer Res. 2008;14(16):5198–5208. doi: 10.1158/1078-0432.CCR-08-0196. [DOI] [PubMed] [Google Scholar]
- 32.Helland Å, et al. Australian Ovarian Cancer Study Group Deregulation of MYCN, LIN28B and LET7 in a molecular subtype of aggressive high-grade serous ovarian cancers. PLoS ONE. 2011;6(4):e18064. doi: 10.1371/journal.pone.0018064. [DOI] [PMC free article] [PubMed] [Google Scholar]
- 33.Wrzeszczynski KO, et al. Identification of tumor suppressors and oncogenes from genomic and epigenetic features in ovarian cancer. PLoS ONE. 2011;6(12):e28503. doi: 10.1371/journal.pone.0028503. [DOI] [PMC free article] [PubMed] [Google Scholar]
- 34.Ciriello G, et al. Emerging landscape of oncogenic signatures across human cancers. Nat Genet. 2013;45(10):1127–1133. doi: 10.1038/ng.2762. [DOI] [PMC free article] [PubMed] [Google Scholar]
- 35.Wyce A, et al. BET inhibition silences expression of MYCN and BCL2 and induces cytotoxicity in neuroblastoma tumor models. PLoS ONE. 2013;8(8):e72967. doi: 10.1371/journal.pone.0072967. [DOI] [PMC free article] [PubMed] [Google Scholar]
- 36.Lovén J, et al. Selective inhibition of tumor oncogenes by disruption of super-enhancers. Cell. 2013;153(2):320–334. doi: 10.1016/j.cell.2013.03.036. [DOI] [PMC free article] [PubMed] [Google Scholar]
- 37.Wu S-Y, Lee A-Y, Lai H-T, Zhang H, Chiang C-M. Phospho switch triggers Brd4 chromatin binding and activator recruitment for gene-specific targeting. Mol Cell. 2013;49(5):843–857. doi: 10.1016/j.molcel.2012.12.006. [DOI] [PMC free article] [PubMed] [Google Scholar]
Associated Data
This section collects any data citations, data availability statements, or supplementary materials included in this article.