Abstract
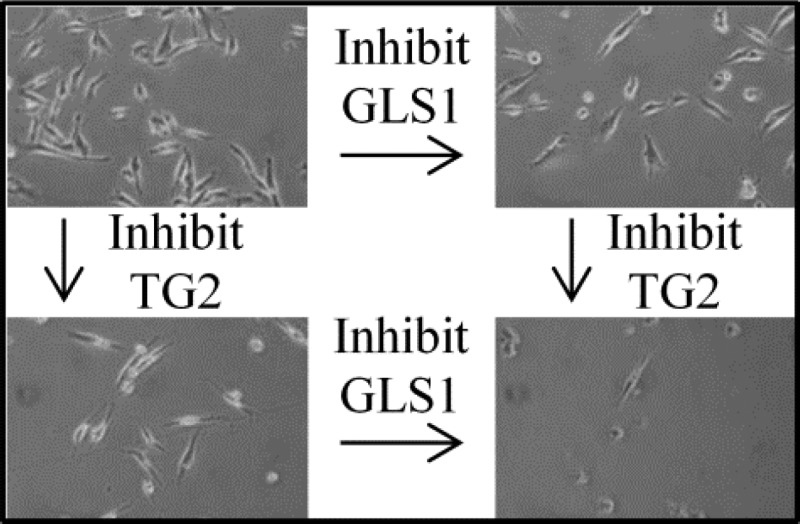
Most cancer cells undergo characteristic metabolic changes that are commonly referred to as the Warburg effect, with one of the hallmarks being a dramatic increase in the rate of lactic acid fermentation. This leads to the production of protons, which in turn acidifies the microenvironment surrounding tumors. Cancer cells have acquired resistance to acid toxicity, allowing them to survive and grow under these detrimental conditions. Kidney type glutaminase (GLS1), which is responsible for the conversion of glutamine to glutamate, produces ammonia as part of its catalytic activities and has been shown to modulate cellular acidity. In this study, we show that tissue, or type 2, transglutaminase (TG2), a γ-glutamyl transferase that is highly expressed in metastatic cancers and produces ammonia as a byproduct of its catalytic activity, is up-regulated by decreases in cellular pH and helps protect cells from acid-induced cell death. Since both TG2 and GLS1 can similarly function to protect cancer cells, we then proceeded to demonstrate that treatment of a variety of cancer cell types with inhibitors of each of these proteins results in synthetic lethality. The combination doses of the inhibitors induce cell death, while individual treatment with each compound shows little or no ability to kill cells. These results suggest that combination drug treatments that simultaneously target TG2 and GLS1 might provide an effective strategy for killing cancer cells.
Keywords: glutaminase, tissue transglutaminase, cancer, 968
Introduction
Chemical cocktails are now being widely used in treating cancer, taking advantage of the idea that administering multiple drugs simultaneously is more effective than treating with the same drugs individually and/or sequentially.1,2 In developing such drug combinations, one important factor to consider is drug cooperativity; specifically, the ability of two or more compounds to work together to enhance their efficacy beyond that obtained when either drug is administered alone.3−5 Given the large number of anticancer drugs available, together with recent advances in cancer diagnostics, it is becoming increasingly possible to use minimal doses of specific drug combinations to maximize their therapeutic benefits.6 One mechanism by which to determine effective drug combinations is to identify proteins that have similar functions but are activated by distinct signaling events.
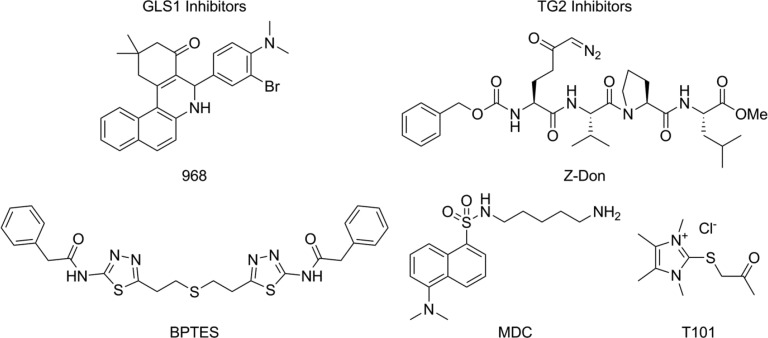
We have recently reported the discovery of an inhibitor of glutaminase C (GAC), specifically, a benzophenanthridinone known as 968 (Figure 1). GAC is a splice variant of kidney-type glutaminase (GLS1) and is responsible for the conversion of glutamine to glutamate, an anaplerotic reaction that helps to satisfy the metabolic requirements imposed by the Warburg effect in the majority of cancer cells.7,8 968 acts as an allosteric inhibitor of GAC activity and is effective in blocking the growth of a wide variety of breast, brain, and pancreatic cancer cells, including those that are resistant to traditional chemotherapies, suggesting that antiglutaminase therapy may have broad-spectrum applicability in the clinic. 968 treatment has been shown to block a number of glutamine- or glutaminase-dependent cellular processes, including epigenetic changes in cells that promote the malignant phenotype.9−11 Because of the promise of 968 as a potentially important drug for the treatment of cancer, coupled with the indications that combination therapies are more effective than single drug regimens in managing cancer, we set out to examine the potential use of 968 as part of a targeted chemical cocktail. While most of the interest in GLS1 is based on its role in helping cancer cells satisfy the metabolic requirements imposed by the Warburg effect (i.e., their addiction to glutamine), GLS1 also has a second important function that contributes to cancer growth, namely, the production of ammonia. As an outcome of the Warburg effect, most cancer cells undergo an increased rate of lactic acid fermentation, despite adequate access to oxygen.12 This results in the production of a high concentration of protons that would be toxic to most cells. However, GLS1 produces ammonia as a byproduct of its enzymatic activity, which has recently been shown to play an important role in regulating intracellular pH by neutralizing the toxic buildup of protons.13 Thus, inhibition of GLS1 via 968 prevented cancer cells from being able to compensate for the acidification of their culturing media and caused them to become more sensitive to glutamine withdrawal. Moreover, Wagner and Curthoys independently showed that GLS1 expression is up-regulated in mice suffering from chronic acidosis, which is consistent with earlier findings showing that the mRNA encoding GLS1 contains a pH-responsive element that helps promote the stability of the transcript when exposed to acidic conditions.14−16
Figure 1.
Inhibitors of GLS1 and TG2. 968 and BPTES are reversible allosteric regulators of GLS1. MDC is a reversible inhibitor of TG2, which serves as an amine-bearing substrate. T101 and Z-Don are irreversible inhibitors of TG2, which bind at the catalytic site. All inhibitors are cell permeable except for T101.
Because acidification of the tumor microenvironment is a conserved outcome of oncogenesis, we suspected that it might be possible to target other proteins that generate ammonia as an outcome of their catalytic activities, as part of a combination therapy with 968, to make cancer cells more susceptible to their acidic environment.17,18 One of the most important of these proteins is tissue, or type 2, transglutaminase (TG2), a member of the γ-glutamyl transferase family of enzymes. TG2 is a GTP-binding protein/acyl transferase/deamidase that is capable of catalyzing the calcium-dependent cross-linking of proteins through the formation of glutamine-lysine covalent linkages, the cross-linking of protein glutamine residues to polyamines, and the hydrolysis of glutamine donor residues. TG2 overexpression is a hallmark of several types of human cancer, and knocking-down its expression in various cancer cell lines causes these cells to lose their transformed phenotype.19 Thus, like GLS1, targeting TG2 might have wide-reaching applications in the clinic. TG2 generates ammonia as an outcome of its catalytic activity, in which the NH2 group of a glutamine side-chain is lost.20,21 A number of TG2 inhibitors have been generated, with one of the better known being monodansylcadaverine (MDC, Figure 1).22−28 MDC acts as an alternate acyl acceptor substrate for TG2 and thus prevents it from hydrolyzing glutamine or cross-linking glutamine (or other acyl donors) to biologically relevant acyl acceptor substrates. Blocking the catalytic activity of TG2 with MDC has been shown to inhibit the growth of cancer cells and sensitize them to apoptotic challenges.24,26,29−33
In addition to the possibility that TG2 can regulate cellular pH levels to promote cancer cell growth, TG2 has also been implicated in two other cellular events that have been linked to cancer progression. First, we have found that both TG2 and GAC contribute to the formation and function of microvesicles (MVs).34,35 MVs are relatively large vesicles that contain cargo and are formed and shed from the surfaces of cancer cells, as a mechanism for communicating with neighboring cells and promoting tumor growth.36 MV formation and shedding require the changes in cancer metabolism characterized by the Warburg effect and the activation of GAC. Thus, MV production by cancer cells is blocked by 968 treatment.31 Moreover, TG2 is a major component of MVs generated by aggressive cancer cell lines, and its acyl transferase activity appears to be essential for the ultimate ability of the MVs to dock on to recipient fibroblasts and alter their behavior.32 Finally, TG2 is known to promote drug resistance, raising the interesting possibility that inhibiting TG2 could potentially reduce cancer cell resistance to GLS1 inhibitors.29,37
Because of the potential roles played by TG2 in various aspects of cancer progression, including the ability to generate ammonia, we felt that combining a TG2 inhibitor (e.g., MDC) with the GLS1 inhibitor 968, could potentially sensitize cancer cells to changes in pH beyond what can be achieved by inhibiting either protein alone. Interestingly, we found that TG2 expression is up-regulated in cancer cells exposed to acidified culturing media and that dosing an assortment of cancer cells with the TG2 inhibitor MDC decreased the pH of cell culturing media. We then went on to test the effects of combining MDC and 968 on cancer cell growth. Indeed, we found that the combination of 968 and MDC caused an increase in the efficacy of the two inhibitors and, somewhat surprisingly, resulted in a synthetic lethality, such that cancer cells died when exposed to both compounds simultaneously. Overall, these findings now raise some exciting possibilities regarding the combined use of GLS1 and TG2 inhibitors in cancers that depend upon the activity of these enzymes to support their transformed phenotypes.
Experimental Section
Materials
968 was obtained from Chembridge (San Diego, CA), while BPTES was a kind gift from Dr. Scott Ulrich (Ithaca College, Ithaca, NY). MDC and dimethyl-α-ketoglutarate were purchased from Sigma (St. Louis, MO). T101 and Z-Don were purchased from Zedira GmbH (Darmstadt, Germany). All of the cell lines used in this study were obtained from the ATCC (Manassas, VA). Cell culture reagents and SDS-PAGE gels were obtained from Invitrogen (Carlsbad, CA). Western Lighting Plus ECL was obtained from PerkinElmer (Waltham, MA). The anti-TG2 cocktail antibody (MS-300-P) was from Neomarkers (Fremont, CA), and the antivinculin antibody (V9131) was from Sigma. The HRP-conjugated antirabbit IgG (70745) was from Cell Signaling (Danvers, MA), and the HRP-conjugated antimouse IgG (NA931-1 ML) was from GE Healthcare Life Sciences (Pittsburgh, PA). All of the other reagents were obtained from Thermo Fisher Scientific (Waltham, MA).
Cell Culture
RPMI 1640 supplemented with 10% fetal bovine serum (FBS) was used to maintain MDA-MB-231, CAMA-1, U-87 MG, MCF-7, and SK-BR-3 cells. DMEM supplemented with 10% FBS was used to maintain T98G and LN-229 cells, while DMEM supplemented with 10% FBS and 2.5% horse serum was used to maintain Mia-PaCa-2 cells. All cells were maintained using standard tissue culture techniques and grown at 37 °C in 5% CO2.
Cell Growth Assay
Cell growth assays were conducted as previously described in Katt et al.8 Cells were plated at densities of 1 (Mia-PaCa-2 and T98G), 2 (MDA-MB-231, U-87 MG, LN-229, and MCF-7), 5 (SK-BR-3), or 6 (CAMA-1) × 104 cells per well of a 12-well plate. For the growth assays performed using acidified media, 2.4 M HCl was titrated into the growth media until pH 6.15 was reached, and then the media was added to cells. Three separate experiments were conducted for each cell growth condition examined. The results shown represent the total number of cells present in the wells after 6 days of growth.
Western Blot Analysis
Western blot analysis was performed using standard protocols as previously described.19 The Western blots shown are representative of at least three independently performed experiments. The band intensities on the blots were quantitated by densiometric analysis using the ImageJ software package.
Measurement of Media Acidity
The indicated cell lines were cultured in DMEM supplemented with 10% FBS and various drug combinations, as indicated, for 6 days. The conditioned media was then probed with an Hi 1131b glass pH electrode (Hanna Instruments) immediately upon the removal of the cell cultures from a 5% CO2 atmosphere.
Drug Treatments
For single molecule treatments, an 8-point dose–response curve was determined for the indicated cell line, using the growth assay described above as a readout. The IC50 value for each compound was determined with SigmaPlot, using its four parameter logistic function. For combinations of drugs, we followed the method of Chou and Talalay to generate combination index (CI) values.38 The relevant growth assays were performed with an 8-point series of drug combinations, with each drug being used at specific fractions of its IC50: 0 (no drug), 1/2, 5/8, 3/4, 7/8, 1, 1.5, and 2× the respective IC50 values. Note that because some MDC IC50 values were sufficiently high (∼100 μM) that off-targets might have become a concern when that concentration was doubled, an IC50 of 60 μM for MDC was utilized for this step in all experiments. CI values were calculated twice for each combination of drugs, once assuming the drugs were mutually exclusive and a second time assuming that the drugs were mutually nonexclusive. CI values less than 1 suggest that the drugs act synergistically, values of approximately 1 suggest that they are additive, and values greater than 1 suggest that they are antagonistic. Analysis of synthetic lethality was conducted using the same data points. A full derivation of the CI equation and a sample calculation are provided in the Supporting Information (“Method of Chou and Talalay” and “Sample CI Calculation”, respectively).
Results
TG2 Influences Cellular pH
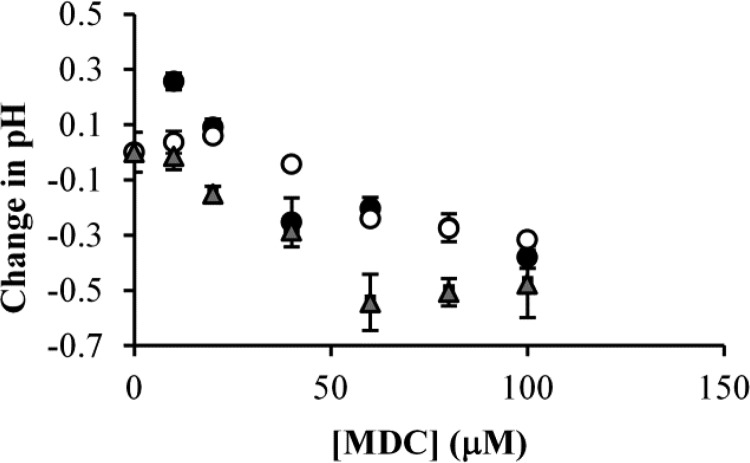
Our first step in this investigation was to determine whether TG2 activity was important for regulating cellular pH. We approached this by examining the effects of inhibiting TG2 using MDC (Figure 1) in a number of different cancer cell lines, specifically, T98G and U-87 glioblastoma cells and MCF-7 breast cancer cells, and then monitoring the pH of the culture media. These cells were grown in identical media to eliminate the influence of media differences on changes in pH. Figure 2 shows that the pH of the conditioned media from each of these cell lines decreased upon treatment of the cells with MDC. The changes in pH occurred despite the buffered nature of the culture media and the alkaline nature of MDC.
Figure 2.
MDC treatment lowers the pH of cancer cell culture media. T98G cells (black circles), MCF-7 cells (gray triangles), or U-87 MG cells (white circles) were cultured in DMEM supplemented with 10% FBS and the indicated amounts of MDC. Six days later, the pH of the media was determined. Increasing the concentration of MDC caused the pH of the culturing medium from each of the cell lines to decrease steadily until a maximum change of 0.3–0.5 pH units was reached. Error bars represent the standard deviation of three separate experiments.
Given that inhibiting TG2 could influence extracellular (and thus intracellular) pH, we then examined whether TG2 expression levels could be up-regulated in cancer cells grown in acidic media.39 We felt that such an effect would be easiest to detect in cell lines that normally express relatively low amounts of TG2. Thus, T98G glioma cells and SK-BR-3 breast cancer cells were cultured in either normal (pH 7.65) or acidic (pH 6.15) growth media for 2 days, with the media being replenished every 12 h to maintain the pH of the media. Alternatively, the cells were treated with retinoic acid (RA), a well-known inducer of TG2 expression, for the same length of time.31 As anticipated, the expression levels of TG2 in the T98G and SK-BR-3 cells treated with RA were increased (Figure 3, compare the first and third lanes in both blots). TG2 expression also increased after culturing the cells in low pH media (Figure 3, compare the first and second lanes in both blots). The growth of the T98G cells was only minimally inhibited by lowering the pH of the media, whereas the growth of SK-BR-3 cells was strongly inhibited by acidic conditions (data not shown).
Figure 3.
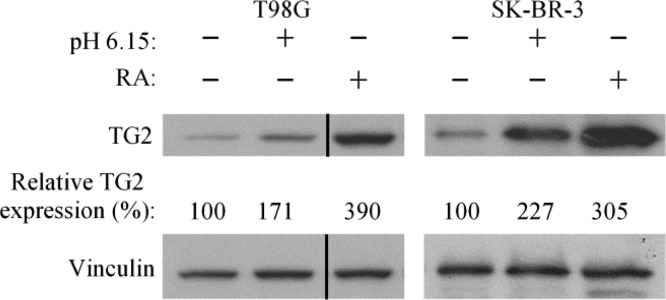
Media acidification induces TG2 expression. T98G and SK-BR-3 cells were cultured in standard growth media (pH 7.65), supplemented with or without 25 μM retinoic acid (RA) or in growth media at pH 6.15. The relative amounts of TG2 expression detected for each condition were quantitated with respect to vinculin expression by densiometric analysis. The vertical line indicates a portion of the blot that was spliced out.
Examining the Effects of Combining TG2 and GLS1 Inhibitors
Since TG2, like GLS1, can modulate cellular pH, we next examined the effects of combining MDC and 968 (chemical structures shown in Figure 1) on cancer cells. To better understand how 968 and MDC might work together to block cancer cell growth, we needed to first determine their potencies (i.e., the amount of a drug needed to obtain a given effect) and efficacies (the maximum effect a given drug can have). To analyze changes in drug potency, which would be a reflection of a synergistic relationship between 968 and MDC, we utilized the method of Talalay and Chou.38 This method allows for the calculation of the amount of one or more drugs needed to obtain a given fraction of a maximum possible effect (in this case, the percent inhibition of cancer cell growth). An example calculation is provided in the Supporting Information, under “Sample CI Calculation”. Three different dose curves are required to conduct this measurement, specifically one curve for each of the drugs alone, and one curve for the two drugs in combination. This analysis yields a series of combination index (CI) values that indicate a synergistic effect by a particular drug combination when the CI values are less than 1 and an antagonistic effect when the CI values are greater than 1.
Changes in efficacy were determined by examining the ability of combining two drugs to reduce the number of cells in culture beyond what can be achieved with either drug alone, even when used at high concentrations. Here, we took advantage of the same data set that was used to generate the CI values to also determine whether the combination of 968 and MDC resulted in synthetic lethality. Complete (100%) inhibition of growth was defined as the point at which cells survived a drug treatment but did not proliferate, whereas a treatment that not only halted cell growth but actually caused cells to die was considered to be lethal and thus is presented as a value of inhibition that exceeded 100%. When used independently on a wide range of cancer cell lines, both 968 and MDC often inhibited the growth of the cancer cells, but rarely caused the cells to die (Table 1).
Table 1. Median Potency Values (IC50) for Growth Inhibition of the Indicated Human Cancer Cell Lines by 968 (First Column) or MDC (Second Column) and the Maximum Observed Cell Growth Inhibition Obtained for Either Inhibitor (Third/Fourth Columns).
| IC50 (μM) |
max inhibition of growth (%) |
|||
|---|---|---|---|---|
| cell line | 968 | MDC | 968 (30 μM) | MDC (120 μM) |
| MDA-MB-231 | 4.2 | 60 | 103 | 83 |
| Mia-PaCa-2 | 6.7 | 50 | 92 | 97 |
| CAMA1 | 15 | 70 | 76 | 102 |
| SK-BR-3 | 5.8 | 50 | 109 | 95 |
| MCF-7 | 12 | 52 | 80 | 66 |
| U-87 MG | 4.2 | 100 | 88 | 52 |
| LN-229 | 6.4 | 66 | 77 | 93 |
| T98G | 3.8 | >120 | 93 | 17 |
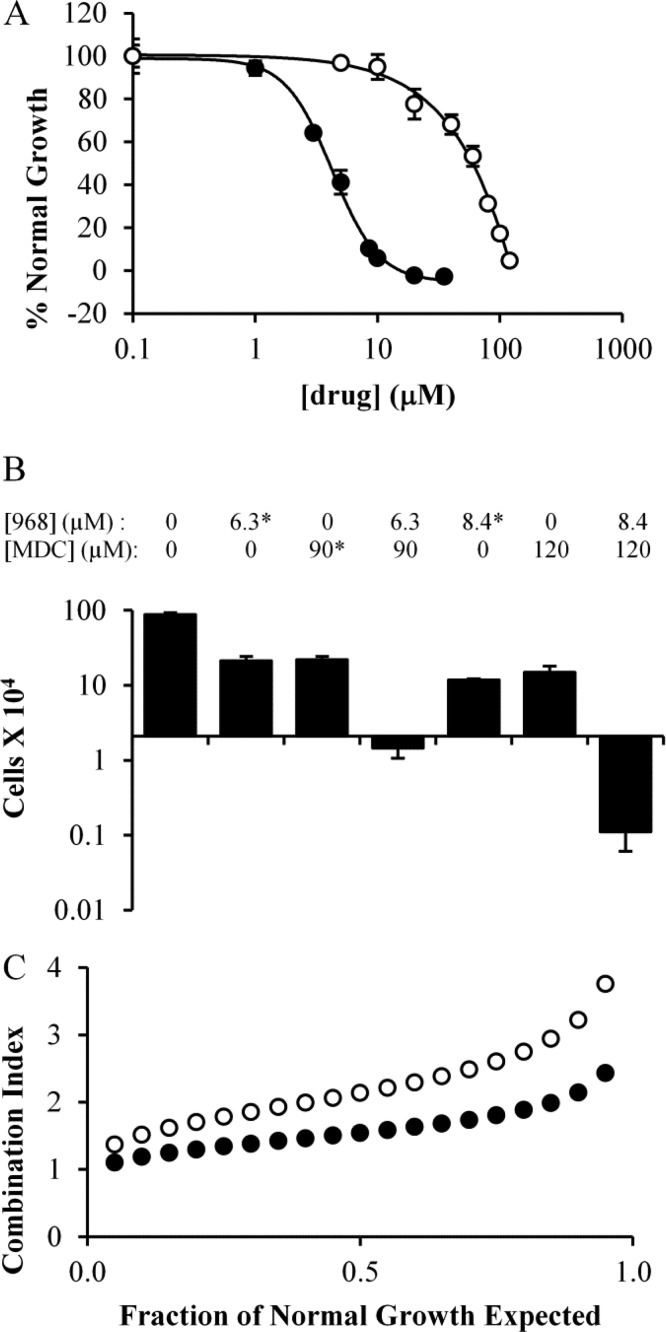
We began by examining the dose dependency for 968 and MDC, alone, on the growth of the MDA-MB-231 triple negative human breast cancer cell line, which we have previously shown is sensitive to 968 treatment.7 The dose curve for 968 yielded an IC50 value of 4.2 μM (Figure 4A black circles), whereas the IC50 value for MDC was 60 μM (Figure 4A white circles). Interestingly, when the two drugs were combined, we observed a cell death response at concentrations that did not kill MDA-MB-231 cells when either drug was used alone. For example, MDA-MB-231 cells proliferated more slowly than the untreated cells when treated with 8.4 μM 968 or 120 μM MDC for 6 days. However, treating MDA-MB-231 cells with a combination of 8.4 μM 968 and 120 μM MDC induced a strong cell death response, such that there were 95% fewer cells than the initial number plated after 6 days of treatment (Figure 4B). However, the CI value was consistently greater than 1, suggesting that no synergistic relationship exists between the compounds (Figure 4C).
Figure 4.
Proliferation of MDA-MB-231 cells in the presence of different amounts of 968 and/or MDC. (A) MDA-MB-231 cells were cultured in the presence of 968 (black circles) or MDC (white circles) for 6 days and then counted. Dose curves were determined using SigmaPlot. (B) Histogram depicting specific data point from the dose curves for 968, MDC, or 968 and MDC treatments in MDA-MB-231 cells. The Y-axis represents the number of cells present in the culture after 6 days of drug treatment, while the X-axis is positioned at the starting number of cells. Values indicated with * were calculated from dose curves in panel A, and error bars represent the standard deviation from the nearest experimental measurement. (C) Combination index (CI) values calculated for 968 and MDC when used to treat MDA-MB-231 cells as described above, at a ratio of 4.2 μM 968 to 60 μM MDC. The CI was calculated at regular intervals that represent a specific fraction (5%) of normal cell growth. Plots were determined considering the two drugs as either mutually exclusive (black circles) or mutually nonexclusive (white circles) in their binding. Error bars in panels A and B represent the standard deviation of three independent measurements.
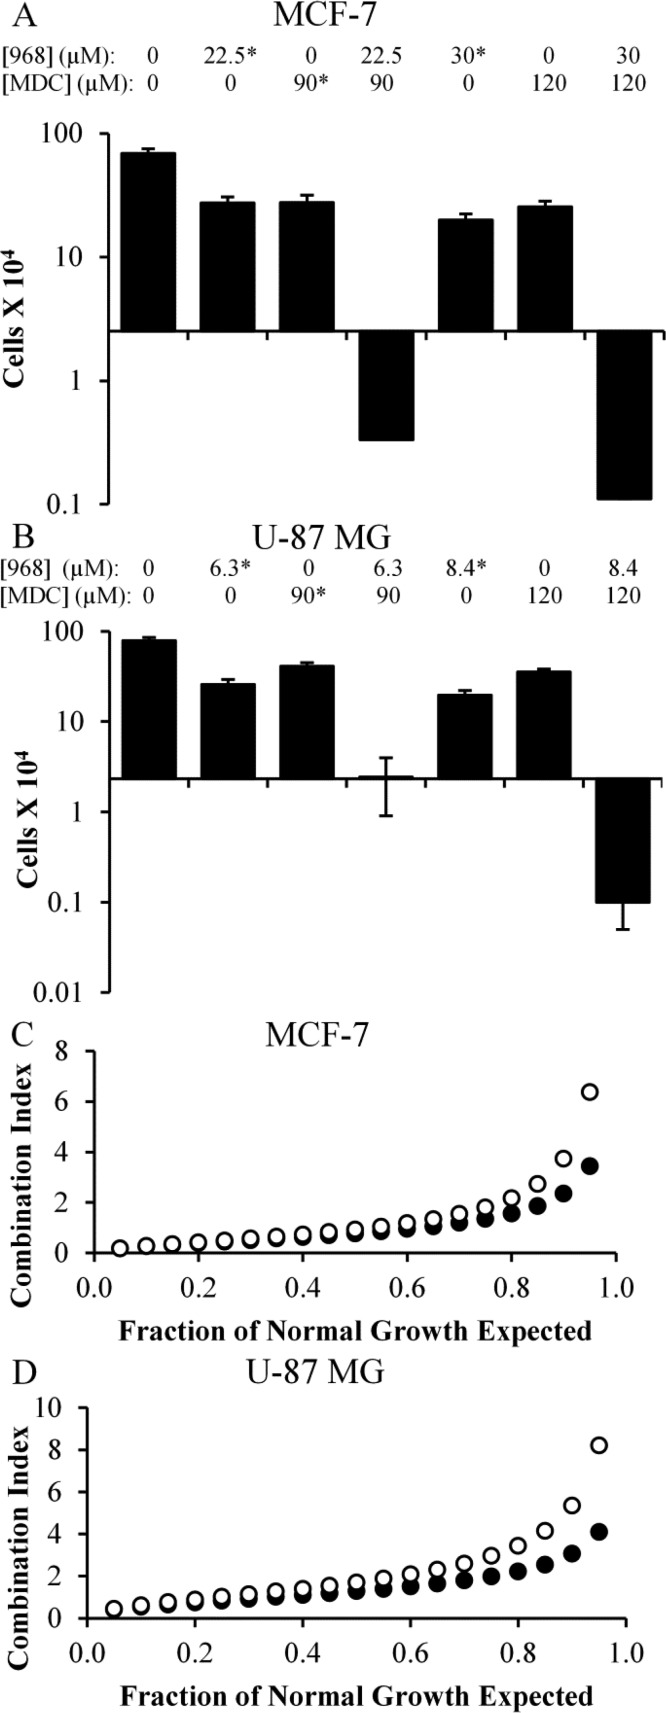
We then examined the effects of 968 and MDC treatment on several additional cancer cell lines that we have previously shown require GAC activity for their growth. These included MCF-7 (an estrogen receptor (ER) positive and progesterone receptor (PR) positive breast cancer cell line), Mia-PaCa-2 (a pancreatic cancer cell line), CAMA-1 (an ER positive breast cancer cell line), and SK-BR-3 (a heregulin receptor 2 (HER2) positive breast cancer cell line). The IC50 values for 968 and MDC were determined for each of these cell lines (Table 1), and combination drug treatments were performed, similar to those carried out on the MDA-MB-231 cell line. Figure 5A shows that neither 968 nor MDC had a cytotoxic effect on MCF-7 cells, but when combined they exhibited synthetic lethality (bars 4 and 7). This trend was also observed with Mia-PaCa-2 (Figure SI1A, Supporting Information), CAMA-1 (Figure SI1B, Supporting Information), and SK-BR-3 cells (Figure SI1C, Supporting Information). In terms of synergy, the drugs showed an antagonistic effect (i.e., CI values >1) in MCF-7 (Figure 5C), CAMA-1 (Figure SI1G, Supporting Information), and SK-BR-3 cells (Figure SI1H, Supporting Information). However, the drugs were synergistic in Mia-PaCa-2 cells, with most CI values for that cell line falling well below 1 (Figure SI1F, Supporting Information).
Figure 5.
Combining 968 and MDC induces cell death in MCF-7 breast cancer cells and U-87 MG brain cancer cells. (A,B) Histograms showing key data points collected from dose curves for 968, MDC, or 968 and MDC treatments in MCF-7 (A) or U-87 MG (B) cells. The Y-axes represent the number of cells in culture after 6 days of drug treatment, while the X-axes are positioned at the starting number of cells. Values indicated with * were calculated from dose curves, and their error bars represent the standard deviation from the nearest experimental measurement. (C,D) Combination index (CI) values calculated for 968 and MDC when used to treat MCF-7 (C) or U-87 MG (D) cells, used at a ratio of 12 μM/60 μM for MCF-7 cells and 4.2 μM/60 μM for U-87 MG cells. The CI was calculated at regular intervals that represent a specific fraction (5%) of normal cell growth. Plots were determined considering the two drugs as either mutually exclusive (black circles) or mutually nonexclusive (white circles) in their binding. Error bars in panels A and B represent the standard deviation of three independent measurements.
We then turned our attention to three different glioblastoma cell lines, two of which overexpress TG2.19 Specifically, we assayed LN-229 cells and U-87 MG cells, which highly express TG2, and T98G cells, which express relatively low amounts of TG2.19 Each cell line had a similar sensitivity to 968, but U-87 MG and T98G cells were relatively resistant to MDC (968 and MDC IC50 values are shown in Table 1). As observed for other cell lines, when U-87 MG cells were exposed to high concentrations of 968 or MDC, they were able to proliferate under those conditions, but when they were exposed to both drugs simultaneously, they died (Figure 5B, bar 7). This trend holds true for LN-229 and T98G cells (Figures SI1D,E, Supporting Information, respectively). The synthetic toxicity of the drugs was not predictive of a synergistic effect, as the calculated CI values for U-87 MG cells were consistently above 1 (Figure 5D), as were those for LN-229 cells (Figure SI1I, Supporting Information), suggesting that 968 and MDC had an antagonistic effect in those cell lines. In contrast, the CI values for T98G cells (Figure SI1J, Supporting Information) were below 1, suggesting a potent synergy occurred between 968 and MDC in that cell line.
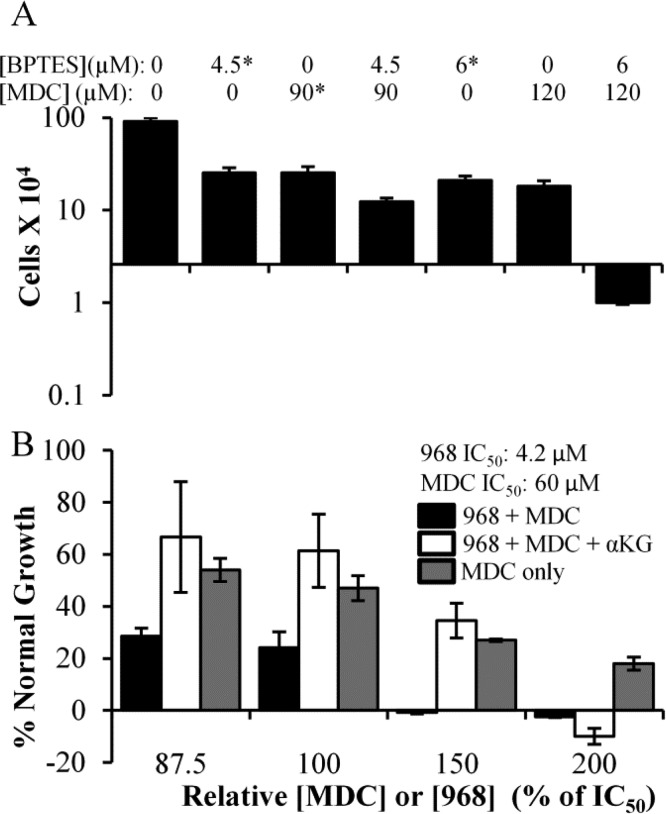
We wanted to verify that the benefits of the combination treatments being observed in the cancer cells were in fact due to inhibiting the effects of glutamine metabolism and TG2 function. Thus, we asked whether similar benefits were obtained when using the alternative GLS1 inhibitor, BPTES (chemical structure in Figure 1).40−42 Figure 6A shows that cotreating MDA-MB-231 cells with BPTES and MDC induces cell death at drug concentrations that do not kill the cells when they are treated with either drug alone (compare bars 5 and 6 to bar 7), similar to when using 968 and MDC in combination. We then examined whether we could rescue the effects of combining a GLS1 inhibitor (968) with the TG2 inhibitor MDC by the addition of a downstream metabolite of GLS1. α-Ketoglutarate is one such metabolite and its dimethyl derivative is cell permeable and has been shown to be able to rescue the growth of cancer cells from the effects of GLS1 inhibition.7 When dimethyl-α-ketoglutarate (6.6 mM) was added together with the combination of 968 and MDC to cultures of MDA-MB-231 cells, we observed a partial rescue of the cells, with cell cultures growing to nearly identical extents as would be expected from MDC treatment alone, until the highest level of 968 (8.4 μM) was used (Figure 6B, compare black bars to white and gray bars). This can be explained because GLS1 generates two products, glutamate and ammonia. 968, at 8.4 μM, would be expected to fully inhibit GLS1 and starve cells of ammonia. Therefore, attempts to rescue the cells from these inhibitory effects with the glutamate-derived metabolite, α-ketoglutarate, alone would not be expected to fully restore cell growth.
Figure 6.
Proliferation of MDA-MB-231 cells in the presence of various concentrations and combinations of MDC, BPTES, and 968. (A) Histograms showing key data points collected from dose curves for MDA-MB-231 cells treated with BPTES, MDC, or BPTES and MDC. The Y-axis represents the number of cells in culture after 6 days of the indicated drug treatments, while the X-axis is positioned at the starting number of cells. Values indicated with * were calculated from dose curves, and error bars represent the standard deviation from the nearest experimental measurement. (B) Effects of 968 and MDC (black bars), 968, MDC, and 6.6 mM dimethyl-α-ketoglutarate (white bars), or MDC alone (gray bars) on the growth of MDA-MB-231 cells. Cells were treated for 6 days with 968 and/or MDC added at the indicated fractions of their IC50 values (4.2 μM for 968 and 60 μM for MDC).
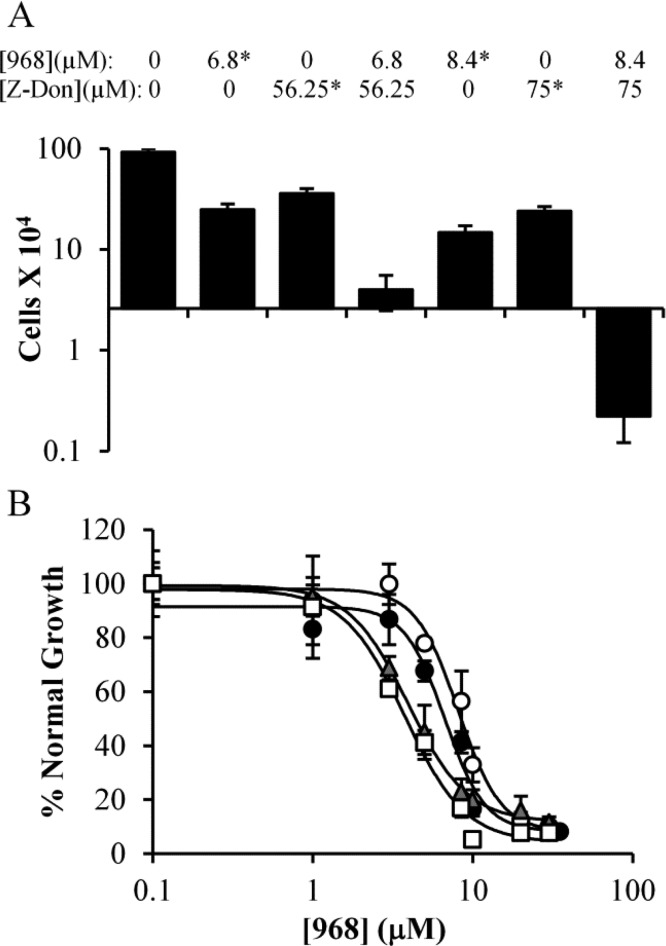
In a similar fashion, we examined whether a validated, alternative inhibitor of TG2, Z-Don (chemical structure shown in Figure 1), would act in a similar manner as MDC in our experiments.43 Figure 7A shows that Z-Don was able to slow the proliferation of MDA-MB-231 cells (compare bar 1 to bars 3 and 6), and when used in combination with 968, a dose-dependent synthetic toxicity occurred (bar 7), comparable to what we observed with the combination treatment of 968 and MDC, or BPTES and MDC. Similar results were observed when LN-229 glioblastoma cells were treated with Z-Don and 968 (Figure SI2, Supporting Information).
Figure 7.
Cancer cells treated with 968 and the TG2 inhibitors Z-Don and T101. (A) MDA-MB-231 cells were cultured in the presence of 968, Z-Don, or a combination of 968 and Z-Don (at a ratio of 4.2 μM 968/37.5 μM Z-Don) for 6 days and then counted. The Y-axis represents the number of cells in culture after 6 days of drug treatment, while the X-axis is positioned at the starting number of cells. Values marked with * were calculated from dose curves, and error bars represent the standard deviation from the nearest experimental measurement. (B) Effects of 968 with or without T101, upon the growth of Mia-PaCa-2 (black circles, 968; white circles, 968 and T101) or U-87 MG (gray triangles, 968; white squares, 968 and T101) cells. Cells were treated with the indicated amounts of 968, with or without 10 μM T101, and after 6 days of growth the cells were counted. Error bars represent the standard deviation of three independent measurements.
Because TG2 functions both within cells and when secreted from cells, as a component of extracellular vesicles referred to as MVs, we also performed experiments with the TG2 inhibitor T101 (chemical structure shown in Figure 1), a cell-impermeable small molecule that is able to inhibit TG2 localized along the outer surfaces of MVs shed from cancer cells.36 Interestingly, T101 did not inhibit the growth of any cancer cell lines that we have tested so far (data not shown), and thus, the method of Chou and Talalay could not be used to determine whether combining 968 and T101 had synergistic effects on cancer cell growth. As an alternate approach, we determined dose curves for 968, with or without 10 μM T101 (an amount of T101 previously demonstrated to block the TG2 activity associated with MVs), in two cell lines that were sensitive to 968 but for which 968 typically caused less than a complete inhibition of cell growth, specifically, U-87 MG glioblastoma cells and Mia-PaCa-2 pancreatic cancer cells.36 A synthetic lethality would be evident if the maximum inhibition from the dose curve increased when T101 was added, while a synergy would be suggested by a substantial horizontal movement in the 968 dose curve. Figure 7B shows that addition of T101 did not substantially alter the dose curves for 968 and that cell growth was never completely blocked for either cell line, suggesting that the synthetic lethality between 968 and MDC or Z-Don is due to targeting intracellular TG2.
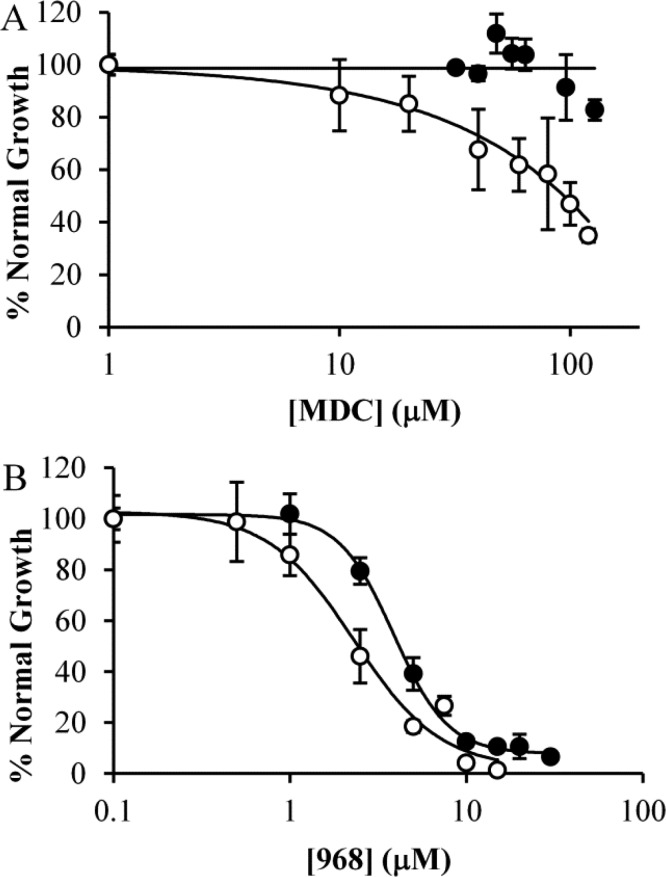
We next wanted to further verify that the effect of combining 968 and MDC in cancer cells was due to their ability to lower intracellular pH. We reasoned that if this were true, then either 968 or MDC treatment should exhibit an increased effect if used in acidified media. To this end, we treated T98G cells, which were relatively resistant to acid toxicity, with pH 6.15 media supplemented with either MDC or 968. Reduction of the media pH sensitized the cells to either drug. This effect was particularly pronounced for MDC, which in normal media shows almost no effect on the cells (Figure 8A, black circles), whereas in acidic media (Figure 8A, white circles) it is almost as effective at inhibiting the proliferation of T98G cells as it is at inhibiting the growth of the MDC-sensitive MDA-MB-231 cell line (Figure 4A, white circles). Although this outcome was less pronounced with 968, there was still a significant shift in its IC50, which was reduced from 3.8 μM in normal media to 2.3 μM in acidic media (Figure 8B).
Figure 8.
Increasing the acidity of cell culturing medium enhances the potency of MDC or 968. T98G cells were cultured in normal (pH = 7.65; black circles) or acidic (pH = 6.15; white circles) media for 6 days in the presence of varying amounts of either (A) MDC or (B) 968 and then counted. Error bars represent the standard deviation of three independent measurements.
Discussion
Here we show that simultaneously inhibiting TG2 and GLS1 resulted in a potent cell death response across a wide variety of human cancer cell types. Moreover, we demonstrate that the lethality to cancer cells caused by blocking the functions of these two proteins appeared to be due to a loss of protective effects against the damage done by increased cellular acidity. Treatment of T98G, U-87 MG, or MCF-7 cells with the TG2 inhibitor MDC resulted in a dose-dependent reduction in the pH of the culture media. This was especially interesting given the buffering capacity of the culture media and considering that MDC itself is a Brønsted–Lowry base. It also strongly supports the idea that the inhibition of TG2 negates the ability of these cells to limit media acidification.
While many highly aggressive cancer cell lines overexpress TG2, some cancer cell lines, like T98G and SK-BR-3 cells, express relatively low levels of TG2. However, culturing T98G or SK-BR-3 cells in acidified media (pH 6.15) resulted in an up-regulation in TG2 expression, suggesting that TG2 levels may increase in some cell lines as a means to help cope with the stress of an acidic environment. Moreover, T98G cells cultured in low pH media became sensitive to the TG2 inhibitor MDC, to which they are otherwise resistant. These findings seem to indicate that TG2 is able to compensate for cellular acidity.
TG2 expression has been shown to be up-regulated to protect cells from a wide variety of stresses.29,44−46 The catalytic activities of TG2 lead to the production of ammonia, and so it is not surprising that TG2 expression would be up-regulated in response to acidic conditions (e.g., similar to the conditions found in the tumor microenvironment). Although it seems that TG2 may be more enzymatically active outside of cells, where there are the levels of calcium required to fully activate TG2, there is evidence suggesting that TG2 can also be active inside of cells, albeit to a lesser degree. In fact, MDC, as well as other TG2 substrates, has been used to label TG2 substrates in cell culture.47−51 Additionally, it was shown in DAOY medulloblastoma cells that reductions in extracellular pH caused the release of intracellular calcium, as well as the activation of proton-sensitive calcium channels.39 Indeed, increased calcium signaling is a hallmark of early apoptotic signaling in general.52,53 An increase in intracellular calcium levels would be expected to further activate TG2, thus leading to an increased production of ammonia to counteract intracellular acidity. Such an effect could be further accentuated by the acid-induced increase in the expression of TG2 that we have demonstrated. In sum, this suggests that TG2 should have sufficient basal activity in many cell lines to meaningfully alter cellular pH levels.
At first glance, it might be unexpected that MDC, a primary amine-bearing alternate substrate for TG2, would be able to prevent TG2 from reducing cellular acidity. However, our findings show that it does. We hypothesize that this is an outcome of MDC having a slower reaction rate in transglutaminase catalyzed reactions than other similar substrates, such as lysine or water, as well as a tighter binding constant.54−56 Thus, MDC would be preferentially used by TG2, and it would slow down the overall rate of TG2 catalysis, resulting in fewer molecules of ammonia being produced. This could explain how MDC could both act as a substrate for TG2 and prevent pH changes due to TG2 catalytic activity.
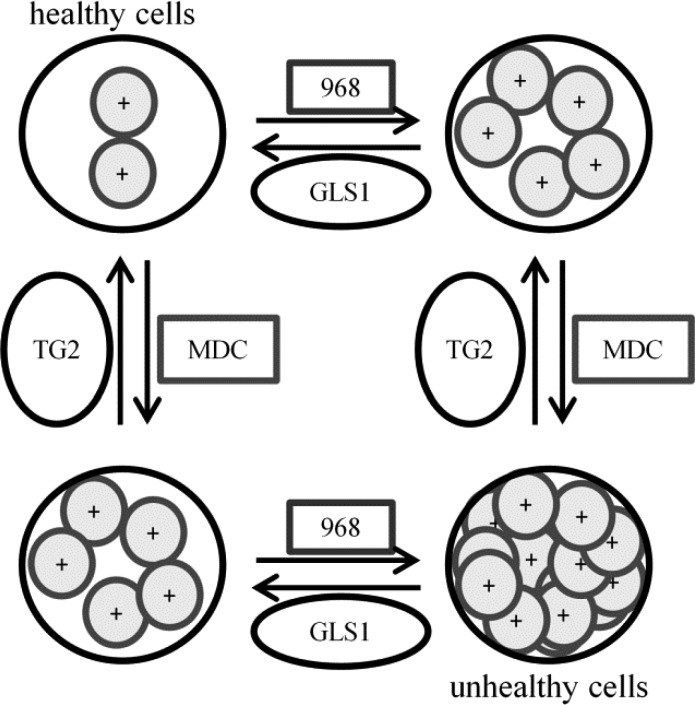
Given the results described here, we propose that the inhibition of GLS1 starves cancer cells for nutrients but also results in decreased ammonia production, requiring the cells to rely to a greater extent upon TG2 enzymatic activity to compensate for the increasing amounts of acid generated during lactate production via the Warburg effect. Conversely, when TG2 activity is inhibited, intracellular acidity increases and ammonia production from GLS1 becomes more important. As cellular acidity increases, both TG2 and GLS1 expression levels are up-regulated to compensate for this stress. However, if both enzymes are simultaneously inhibited, two independent mechanisms that help rescue cells from acid toxicity have been blocked, and cell death ensues (Figure 9). This would explain why we observe synthetic lethality even in systems where neither inhibitor alone is lethal.
Figure 9.
Cartoon representing the implications of TG2 or GAC inhibition on intracellular acidity levels and cell viability. Cancer cells normally maintain a healthy, neutral pH (upper left). Inhibition of either GAC (with 968) or TG2 (with MDC) causes the pH in cells to decrease and limits cell growth (upper right and lower left). However, inhibiting TG2 and GLS1 simultaneously decreases the pH to an intolerable level (lower right) and kills cells. In this way, a cotherapy of MDC and 968 could potentially be beneficial for the treatment of a broad range of cancer cell types.
Conclusions
The goal of these studies was to identify small molecule inhibitors that might act cooperatively with the GLS1 allosteric regulator 968. On the basis of recent findings showing that GLS1 was involved in the regulation of intracellular pH, we chose to examine the combination of a GLS1 inhibitor with an inhibitor of TG2, an enzyme that produces ammonia as part of its catalytic activity and therefore seemed likely to also be involved in cellular pH regulation.13 Indeed, we show that the inhibition of TG2 causes cell culture media to acidify significantly, suggesting that TG2 activity does indeed help cells to compensate for acid production. Additionally, we demonstrate that TG2 expression is up-regulated in cancer cells upon exposure to acidic stress. Finally, we show that simultaneous inhibition of GLS1 and TG2 results in a synthetic lethality across a panel of assorted cancer cell lines and that either inhibitor became more effective when used in acidic media, further suggesting that both enzymes play key roles in modulating intracellular acidity. These findings shed new light on a previously under-appreciated mechanism through which the multifunctional enzyme TG2 can promote cell survival, as well as suggest a possible focus for combination drug therapies for cancer patients.
Acknowledgments
This work was supported in part by an ACS fellowship (119371-PF-10-238-01-CCE) to W.P.K. and the National Institutes of Health (GM040654, GM047458) to R.A.C. We would like to thank Cindy Westmiller for her excellent assistance in assembling the manuscript.
Supporting Information Available
Effects of 968 and MDC combination doses on Mia-PaCa-2, CAMA-1, SK-BR-3, LN-229, and T98G cell lines. Effects of 968 and Z-Don combination dose on LN-229 cells. Expanded description of the method of Chou and Talalay, and step-by-step example of this calculation for the combination of 968 and Z-Don in MDA-MD-231 cells. This material is available free of charge via the Internet at http://pubs.acs.org.
The authors declare no competing financial interest.
Funding Statement
National Institutes of Health, United States
Supplementary Material
References
- Knight Z. A.; Lin H.; Shokat K. M. Targeting the cancer kinome through polypharmacology. Nat. Rev. Cancer 2010, 102130–137. [DOI] [PMC free article] [PubMed] [Google Scholar]
- Gottesman M. M. Mechanisms of cancer drug resistance. Annu. Rev. Med. 2002, 53, 615–627. [DOI] [PubMed] [Google Scholar]
- Harasym T. O.; Tardi P. G.; Harasym N. L.; Harvie P.; Johnstone S. A.; Mayer L. D. Increased preclinical efficacy of irinotecan and floxuridine coencapsulated inside liposomes is associated with tumor delivery of synergistic drug ratios. Oncol. Res. 2007, 168361–374. [DOI] [PubMed] [Google Scholar]
- Zwick M. B.; Wang M.; Poignard P.; Stiegler G.; Katinger H.; Burton D. R.; Parren P. W. Neutralization synergy of human immunodeficiency virus type 1 primary isolates by cocktails of broadly neutralizing antibodies. J. Virol. 2001, 752412198–12208. [DOI] [PMC free article] [PubMed] [Google Scholar]
- Greco W. R.; Bravo G.; Parsons J. C. The search for synergy: a critical review from a response surface perspective. Pharmacol. Rev. 1995, 472331–385. [PubMed] [Google Scholar]
- Furney S. J.; Gundem G.; Lopez-Bigas N. Oncogenomics methods and resources. Cold Spring Harbor Protoc. 2012, 5, 546–564. [DOI] [PubMed] [Google Scholar]
- Wang J. B.; Erickson J. W.; Fuji R.; Ramachandran S.; Gao P.; Dinavahi R.; Wilson K. F.; Ambrosio A. L.; Dias S. M.; Dang C. V.; Cerione R. A. Targeting mitochondrial glutaminase activity inhibits oncogenic transformation. Cancer Cell 2010, 183207–219. [DOI] [PMC free article] [PubMed] [Google Scholar]
- Katt W. P.; Ramachandran S.; Erickson J. W.; Cerione R. A. Dibenzophenanthridines as inhibitors of glutaminase C and cancer cell proliferation. Mol. Cancer Ther. 2012, 1171269–1278. [DOI] [PMC free article] [PubMed] [Google Scholar]
- Katt W. P.; Cerione R. A. Glutaminase regulation in cancer cells: a druggable chain of events. Drug Discovery Today 2013, 194450–457. [DOI] [PMC free article] [PubMed] [Google Scholar]
- Simpson N. E.; Tryndyak V. P.; Pogribna M.; Beland F. A.; Pogribny I. P. Modifying metabolically sensitive histone marks by inhibiting glutamine metabolism affects gene expression and alters cancer cell phenotype. Epigenetics 2012, 7121413–1420. [DOI] [PMC free article] [PubMed] [Google Scholar]
- Simpson N. E.; Tryndyak V. P.; Beland F. A.; Pogribny I. P. An in vitro investigation of metabolically sensitive biomarkers in breast cancer progression. Breast Cancer Res. Treat. 2012, 1333959–968. [DOI] [PubMed] [Google Scholar]
- Warburg O. On the origin of cancer cells. Science 1956, 1233191309–314. [DOI] [PubMed] [Google Scholar]
- Huang W.; Choi W.; Chen Y.; Zhang Q.; Deng H.; He W.; Shi Y. A proposed role for glutamine in cancer cell growth through acid resistance. Cell Res. 2013, 235724–727. [DOI] [PMC free article] [PubMed] [Google Scholar]
- Nowik M.; Lecca M. R.; Velic A.; Rehrauer H.; Brandli A. W.; Wagner C. A. Genome-wide gene expression profiling reveals renal genes regulated during metabolic acidosis. Physiol. Genomics 2008, 323322–334. [DOI] [PubMed] [Google Scholar]
- Freund D. M.; Prenni J. E.; Curthoys N. P. Response of the mitochondrial proteome of rat renal proximal convoluted tubules to chronic metabolic acidosis. Am. J. Physiol., Renal Physiol. 2013, 3042F145–F155. [DOI] [PMC free article] [PubMed] [Google Scholar]
- Laterza O. F.; Curthoys N. P. Effect of acidosis on the properties of the glutaminase mRNA pH-response element binding protein. J. Am. Soc. Nephrol. 2000, 1191583–1588. [DOI] [PubMed] [Google Scholar]
- Kraus M.; Wolf B. Implications of acidic tumor microenvironment for neoplastic growth and cancer treatment: A computer analysis. Tumor Biol. 1996, 173133–154. [DOI] [PubMed] [Google Scholar]
- Estrella V.; Chen T. A.; Lloyd M.; Wojtkowiak J.; Cornnell H. H.; Ibrahim-Hashim A.; Bailey K.; Balagurunathan Y.; Rothberg J. M.; Sloane B. F.; Johnson J.; Gatenby R. A.; Gillies R. J. Acidity generated by the tumor microenvironment drives local invasion. Cancer Res. 2013, 7351524–1535. [DOI] [PMC free article] [PubMed] [Google Scholar]
- Zhang J.; Antonyak M. A.; Singh G.; Cerione R. A. A mechanism for the upregulation of EGF receptor levels in glioblastomas. Cell Rep. 2013, 362008–2020. [DOI] [PMC free article] [PubMed] [Google Scholar]
- Lorand L.; Graham R. M. Transglutaminases: crosslinking enzymes with pleiotropic functions. Nat. Rev. Mol. Cell Biol. 2003, 42140–156. [DOI] [PubMed] [Google Scholar]
- Iwai K.; Shibukawa Y.; Yamazaki N.; Wada Y. Transglutaminase 2-dependent deamidation of glyceraldehyde-3-phosphate dehydrogenase promotes trophoblastic cell fusion. J. Biol. Chem. 2013, 28984989–4999. [DOI] [PMC free article] [PubMed] [Google Scholar]
- Badarau E.; Collighan R. J.; Griffin M. Recent advances in the development of tissue transglutaminase (TG2) inhibitors. Amino Acids 2013, 441119–127. [DOI] [PubMed] [Google Scholar]
- Caron N. S.; Munsie L. N.; Keillor J. W.; Truant R. Using FLIM-FRET to measure conformational changes of transglutaminase type 2 in live cells. PLoS One 2012, 78e44159. [DOI] [PMC free article] [PubMed] [Google Scholar]
- Yuan L.; Choi K.; Khosla C.; Zheng X.; Higashikubo R.; Chicoine M. R.; Rich K. M. Tissue transglutaminase 2 inhibition promotes cell death and chemosensitivity in glioblastomas. Mol. Cancer Ther. 2005, 491293–1302. [DOI] [PubMed] [Google Scholar]
- Selkoe D. J.; Abraham C.; Ihara Y. Brain transglutaminase: in vitro crosslinking of human neurofilament proteins into insoluble polymers. Proc. Natl. Acad. Sci. U.S.A. 1982, 79196070–6074. [DOI] [PMC free article] [PubMed] [Google Scholar]
- Siegel M.; Khosla C. Transglutaminase 2 inhibitors and their therapeutic role in disease states. Pharmacol. Ther. 2007, 1152232–245. [DOI] [PMC free article] [PubMed] [Google Scholar]
- Yakubov B.; Chen L.; Belkin A. M.; Zhang S.; Chelladurai B.; Zhang Z. Y.; Matei D. Small molecule inhibitors target the tissue transglutaminase and fibronectin interaction. PLoS One 2014, 92e89285. [DOI] [PMC free article] [PubMed] [Google Scholar]
- Pietsch M.; Wodtke R.; Pietzsch J.; Loser R. Tissue transglutaminase: an emerging target for therapy and imaging. Bioorg. Med. Chem. Lett. 2013, 23246528–6543. [DOI] [PubMed] [Google Scholar]
- Gundemir S.; Colak G.; Tucholski J.; Johnson G. V. Transglutaminase 2: a molecular Swiss army knife. Biochim. Biophys. Acta 2011, 18232406–419. [DOI] [PMC free article] [PubMed] [Google Scholar]
- Li B.; Cerione R. A.; Antonyak M. Tissue transglutaminase and its role in human cancer progression. Adv. Enzymol. Relat. Areas Mol. Biol. 2011, 78, 247–293. [DOI] [PubMed] [Google Scholar]
- Antonyak M. A.; McNeill C. J.; Wakshlag J. J.; Boehm J. E.; Cerione R. A. Activation of the Ras-ERK pathway inhibits retinoic acid-induced stimulation of tissue transglutaminase expression in NIH3T3 cells. J. Biol. Chem. 2003, 2781815859–15866. [DOI] [PubMed] [Google Scholar]
- Hettasch J. M.; Bandarenko N.; Burchette J. L.; Lai T. S.; Marks J. R.; Haroon Z. A.; Peters K.; Dewhirst M. W.; Iglehart J. D.; Greenberg C. S. Tissue transglutaminase expression in human breast cancer. Lab. Invest. 1996, 755637–645. [PubMed] [Google Scholar]
- Boroughs L. K.; Antonyak M. A.; Johnson J. L.; Cerione R. A. A unique role for heat shock protein 70 and its binding partner tissue transglutaminase in cancer cell migration. J. Biol. Chem. 2011, 2864337094–37107. [DOI] [PMC free article] [PubMed] [Google Scholar]
- Antonyak M. A.; Wilson K. F.; Cerione R. A. R(h)oads to microvesicles. Small GTPases 2013, 34219–224. [DOI] [PMC free article] [PubMed] [Google Scholar]
- Wilson K. F.; Erickson J. W.; Antonyak M. A.; Cerione R. A. Rho GTPases and their roles in cancer metabolism. Trends Mol. Med. 2013, 19274–82. [DOI] [PMC free article] [PubMed] [Google Scholar]
- Antonyak M. A.; Li B.; Boroughs L. K.; Johnson J. L.; Druso J. E.; Bryant K. L.; Holowka D. A.; Cerione R. A. Cancer cell-derived microvesicles induce transformation by transferring tissue transglutaminase and fibronectin to recipient cells. Proc. Natl. Acad. Sci. U.S.A. 2011, 108124852–4857. [DOI] [PMC free article] [PubMed] [Google Scholar]
- Kim D. S.; Park S. S.; Nam B. H.; Kim I. H.; Kim S. Y. Reversal of drug resistance in breast cancer cells by transglutaminase 2 inhibition and nuclear factor-kappa B inactivation. Cancer Res. 2006, 662210936–10943. [DOI] [PubMed] [Google Scholar]
- Chou T. C.; Talalay P. Quantitative analysis of dose-effect relationships: the combined effects of multiple drugs or enzyme inhibitors. Adv. Enzyme Regul. 1984, 22, 27–55. [DOI] [PubMed] [Google Scholar]
- Huang W. C.; Swietach P.; Vaughan-Jones R. D.; Ansorge O.; Glitsch M. D. Extracellular acidification elicits spatially and temporally distinct Ca2+ signals. Curr. Biol. 2008, 1810781–785. [DOI] [PubMed] [Google Scholar]
- Robinson M. M.; McBryant S. J.; Tsukamoto T.; Rojas C.; Ferraris D. V.; Hamilton S. K.; Hansen J. C.; Curthoys N. P. Novel mechanism of inhibition of rat kidney-type glutaminase by bis-2-(5-phenylacetamido-1,2,4-thiadiazol-2-yl)ethyl sulfide (BPTES). Biochem. J. 2007, 4063407–414. [DOI] [PMC free article] [PubMed] [Google Scholar]
- DeLaBarre B.; Gross S.; Fang C.; Gao Y.; Jha A.; Jiang F.; Song J. J.; Wei W. T.; Hurov J. B. Full-length human glutaminase in complex with an allosteric inhibitor. Biochemistry 2011, 505010764–10770. [DOI] [PubMed] [Google Scholar]
- Shukla K.; Ferraris D. V.; Thomas A. G.; Stathis M.; Duvall B.; Delahanty G.; Alt J.; Rais R.; Rojas C.; Gao P.; Xiang Y.; Dang C. V.; Slusher B. S.; Tsukamoto T. Design, synthesis, and pharmacological evaluation of bis-2-(5-phenylacetamido-1,2,4-thiadiazol-2-yl)ethyl sulfide 3 (BPTES) analogs as glutaminase inhibitors. J. Med. Chem. 2012, 552310551–10563. [DOI] [PMC free article] [PubMed] [Google Scholar]
- McConoughey S. J.; Basso M.; Niatsetskaya Z. V.; Sleiman S. F.; Smimova N. A.; Langley B. C.; Mahishi L.; Cooper A. J. L.; Antonyak M. A.; Cerione R. A.; Li B.; Starkov A.; Chaturvedi R. K.; Beal M. F.; Coppola G.; Geschwind D. H.; Ryu H.; Xia L.; Iisma S. E.; Pallos J.; Pasternack R.; Hils M.; Fan J.; Raymond L. A.; Marsh J. L.; Thompson L. M.; Ratan R. R. Inhibition of transglutaminase 2 mitigates transcriptional dysregulation in models of Huntington disease. EMBO Mol. Med. 2010, 29349–370. [DOI] [PMC free article] [PubMed] [Google Scholar]
- Boroughs L. K.; Antonyak M. A.; Cerione R. A. A novel mechanism by which tissue transglutaminase activates signaling events that promote cell survival. J. Biol. Chem. 2014, 2891410115–10125. [DOI] [PMC free article] [PubMed] [Google Scholar]
- Fésüs L.; Szondy Z. Transglutaminase 2 in the balance of cell death and survival. FEBS Lett. 2005, 579153297–3302. [DOI] [PubMed] [Google Scholar]
- Verderio E. A.; Johnson T.; Griffin M. Tissue transglutaminase in normal and abnormal wound healing: review article. Amino Acids 2004, 264387–404. [DOI] [PubMed] [Google Scholar]
- Biederbick A.; Kern H. F.; Elsasser H. P. Monodansylcadaverine (MDC) is a specific in vivo marker for autophagic vacuoles. Eur. J. Cell Biol. 1995, 6613–14. [PubMed] [Google Scholar]
- Maiuri L.; Luciani A.; Giardino I.; Raia V.; Villella V. R.; D’Apolito M.; Pettoello-Mantovani M.; Guido S.; Ciacci C.; Cimminoo M.; Cexus O. N.; Londei M.; Quaratino S. Tissue transglutaminase activation modulates inflammation in cystic fibrosis via PPAR gamma down-regulation. J. Immunol. 2008, 180117697–7705. [DOI] [PubMed] [Google Scholar]
- Zhu J. H.; Horbinski C.; Guo F. L.; Watkins S.; Uchiyama Y.; Chu C. T. Regulation of autophagy by extracellular signal-regulated protein kinases during 1-methyl-4-phenylpyridinium-induced cell death. Am. J. Pathol. 2007, 170175–86. [DOI] [PMC free article] [PubMed] [Google Scholar]
- Zhang J. W.; Lesort M.; Guttmann R. P.; Johnson G. V. W. Modulation of the in situ activity of tissue transglutaminase by calcium and GTP. J. Biol. Chem. 1998, 27342288–2295. [DOI] [PubMed] [Google Scholar]
- Tovar-Vidales T.; Roque R.; Clark A. F.; Wordinger R. J. Tissue transglutaminase expression and activity in normal and glaucomatous human trabecular meshwork cells and tissues. Invest. Ophthalmol. Vis. Sci. 2008, 492622–628. [DOI] [PMC free article] [PubMed] [Google Scholar]
- Mattson M. P.; Chan S. L. Calcium orchestrates apoptosis. Nat. Cell Biol. 2003, 5121041–1043. [DOI] [PubMed] [Google Scholar]
- Orrenius S.; Zhivotovsky B.; Nicotera P. Regulation of cell death: the calcium-apoptosis link. Nat. Rev. Mol. Cell Biol. 2003, 47552–565. [DOI] [PubMed] [Google Scholar]
- Keillor J. W.; Chica R. A.; Chabot N.; Vinci V.; Pardin C.; Fortin E.; Gillet S. M. F. G.; Nakano Y.; Kaartinen M. T.; Pelletier J. N.; Lubell W. D. The bioorganic chemistry of transglutaminase: from mechanism to inhibition and engineering. Can. J. Chem. 2008, 864271–276. [Google Scholar]
- Stenberg P.; Curtis C. G.; Wing D.; Tong Y. S.; Credo R. B.; Gray A.; Lorand L. Transamidase kinetics. Amide formation in the enzymic reactions of thiol esters with amines. Biochem. J. 1975, 1471155–163. [PMC free article] [PubMed] [Google Scholar]
- Lee K. N.; Fesus L.; Yancey S. T.; Girard J. E.; Chung S. I. Development of selective inhibitors of transglutaminase. Phenylthiourea derivatives. J. Biol. Chem. 1985, 2602714689–14694. [PubMed] [Google Scholar]
Associated Data
This section collects any data citations, data availability statements, or supplementary materials included in this article.


