

Abstract
INTRODUCTION
Obesity is a major modifiable risk factor associated with most chronic diseases. The aim of this study was to determine the prevalence of obesity, and its associated risk factors, among apparently healthy Chinese adults in a Malaysian suburban village.
METHODS
This was a cross-sectional study conducted among the Chinese residents in Seri Kembangan New Village, Klang Valley, Selangor, Malaysia. Convenience sampling was used for the selection of participants. Body weight, height, waist and hip circumferences, and blood pressure were measured. Fasting venous plasma was drawn for the measurement of fasting glucose level and lipid profile. Data on sociodemographic factors, dietary habits, physical activity, perceived stress level and sleep duration were collected using interviewer-administered, pretested and validated questionnaires.
RESULTS
Among the 258 Chinese residents (mean age 41.4 ± 10.0 years) recruited, the prevalence of obesity was 40%. The obese participants had significantly higher mean blood pressure, and triglyceride and fasting plasma glucose levels than the non-obese participants (p < 0.05). The obese participants also had a significantly lower high-density lipoprotein cholesterol level than the non-obese participants. Logistic regression analysis showed that drinking soy milk (adjusted odds ratio [OR] 0.447; 95% confidence interval [CI] 0.253–0.787; p < 0.05) and the perception that a balanced diet consists mainly of vegetables (adjusted OR 0.440; 95% CI 0.215–0.900; p < 0.05) were associated with a reduced risk of obesity. The risk of obesity was higher in younger participants (adjusted OR 2.714; 95% CI 1.225–6.011; p < 0.05).
CONCLUSION
The prevalence of obesity was high among the apparently healthy suburban Chinese. Our findings suggest that soy milk consumption and the perception that a balanced diet consists mainly of vegetables are associated with a lower risk of developing obesity in this population.
Keywords: dietary habits, obesity, perception of balanced diet
INTRODUCTION
Obesity is a major modifiable risk factor that is associated with diseases such as type 2 diabetes mellitus,(1) cardiovascular disease(2) and certain types of cancers.(3) In recent decades, obesity has become an epidemic worldwide, with varied prevalences across populations.(2,4) According to the data in the 1999–2008 National Health and Nutrition Examination Survey, almost two-thirds of all adults in the United States were classified as overweight, while one-third of the adults were obese.(5) In Malaysia, the prevalence of obesity has increased dramatically from 5.5% in 1996 to 12.2% in 2003, and then to 14.0% in 2006.(6) The increase in the prevalence of chronic diseases parallels the dramatic increase in the prevalence of obesity. In 2005, the Malaysian Ministry of Health revealed that three of the five leading causes of death in Malaysia are obesity-related diseases, which account for over one-third of all medically certified deaths in Malaysia.(7)
Obesity is a multifactorial disease involving interactions between genetic, environmental and psychosocial factors. Although obesity has genetic influences, dietary and lifestyle factors play an important role in the marked increase in the prevalence of obesity in recent decades.(8) Therefore, the identification of population-specific risk factors associated with obesity has become an important healthcare strategy in the planning of intervention programmes.
Few studies have been conducted in Malaysia to determine the prevalence of obesity in both urban and rural populations. The prevalence of overweight persons in Malaysia was reported to be higher in urban populations than rural populations (17.4% and 15.5%, respectively) in the 1996 Second National Health and Morbidity Survey.(9) However, the Malaysian Adults Nutrition Survey conducted in 2002–2003 found no difference in the prevalence of overweight persons in urban and rural populations (26.9% and 26.6%, respectively).(10) Likewise, subsequent studies reported that the prevalence of obesity was similar in urban and rural communities (12% and 11.3%, respectively).(11) As there is a paucity of published data on obesity in a suburban community, the aim of the present study was to determine the prevalence of obesity, and its associated risk factors, in a Chinese population residing in a Malaysian suburban village.
METHODS
A cross-sectional study was conducted on the residents of Seri Kembangan New Village, Klang Valley, Selangor, Malaysia, from August 2011 to September 2011. Convenience sampling method was used to select the participants. Adults aged 21–60 years were eligible for inclusion in this study. Women who were pregnant and adults with known terminal illnesses and chronic diseases (e.g. diabetes mellitus and hypertension) were excluded from the study. Ethical approval was obtained from the Scientific and Ethical Review Committee of Universiti Tunku Abdul Rahman (UTAR). Written informed consent was obtained from the participants.
Between 8 am and 10 am, and after an overnight fast for 8–10 hours, a trained phlebotomist drew 6 mL of fasting venous plasma from each participant through venepuncture of the forearm. Fasting blood glucose was determined using the hexokinase method. Serum total cholesterol was determined using an enzymatic method that used cholesterol esterase and cholesterol oxidase conversion followed by a Trinder endpoint. Triglyceride (TG) levels were determined based on the Fossati three-step enzymatic reaction with a Trinder endpoint. Elimination/catalase method was used to measure high-density lipoprotein (HDL) cholesterol. Low-density lipoprotein (LDL) cholesterol was calculated using the Friedwald formula i.e. LDL = [total cholesterol – TG/5.0] – HD). Metabolic syndrome was defined using the harmonised criteria by the International Diabetes Federation Task Force on Epidemiology and Prevention; National Heart, Lung and Blood Institute; American Heart Association; World Heart Federation; International Atherosclerosis Society; and International Association for the Study of Obesity.(12) Participants with at least three of the following risk factors were identified to have metabolic syndrome: waist circumference ≥ 80 cm in females or ≥ 90 cm in males; blood pressure ≥ 130/85 mmHg or on antihypertensive medications; fasting plasma glucose ≥ 5.6 mmol/L or diabetic; TG level ≥ 1.7 mmol/L or on medications for elevated TG levels; HDL cholesterol level < 1.3 mmol/L in females or < 1.0 mmol/L in males, or on medications for reduced HDL cholesterol.(12)
Information regarding the participants’ sociodemographic characteristics, dietary habits, level of physical activity, perceived stress and sleep duration was obtained via interview-administered questionnaires. The interviewers were trained second-year medical students of UTAR. The dietary habits of the participants were determined using a pretested 16-item questionnaire, which included questions on the regularity of main meal intake; type of food taken for main meals and snacks; frequency of intake of milk and dairy products, fruits, vegetables and high-fibre food; and perception of what constitutes a balanced diet.
The participants’ level of physical activity was determined using the validated short International Physical Activity Questionnaire.(13-15) Information on the length of time (i.e. the number of sessions and average time per session) spent on walking, moderate-or vigorous-intensity physical activities and sitting, on both weekdays and weekends, was obtained using the questionnaire. Questions regarding participation in moderate-or vigorous-intensity physical activities were supplemented with concrete examples of activities commonly performed. Data from each question was summed within each item (i.e. vigorous-intensity, moderate-intensity or walking) to estimate the total amount of time spent on physical activity per week. Total daily physical activity (measured in metabolic equivalent [MET] min/day) was estimated by summing the product of the reported length of time within each item by a MET value specific to each category of physical activity, and expressed as a daily average MET score. Vigorous-intensity physical activity was assumed to correspond to 8 METs, moderate-intensity physical activity to 4 METs, and walking to 3.3 METs. Participants were then categorised to have low, moderate or high physical activity levels according to the criteria given in the guideline.(14)
Data on sociodemographic information, family history, medical conditions, smoking habits and sleep duration was obtained using a pretested questionnaire. In the questionnaire regarding perceived stress, participants were assessed on seven factors of stress – harassment, work overload, irritability, lack of joy, fatigue, worries and tension. This questionnaire was adapted from the questionnaire developed by Levenstein et al in a 1993 study.(16) The overall score was calculated using a five-point Likert scale: never (0 points), almost never (1 point), sometimes (2 points), fairly often (3 points), and very often (4 points).
Anthropometrical and clinical measurements of the participants were carried out by trained second-year medical students of UTAR. Measurements in a particular category were carried out by the same student throughout the entire project. The anthropometric measurement protocol used in this study adhered to the International Society for the Advancement of Kinanthropometry method.(17) Height was measured, without shoes worn, to the nearest 0.1 cm using a height rod that was attached to a weighing machine (MS-3400 PIR; MARSDEN, Taiwan). All participants were instructed to stand with their heels, buttocks and shoulders resting lightly against the backing board so that the Frankfort plane (i.e. the line connecting the superior border of the external auditory meatus with the infraorbital rim) was horizontal and parallel to the floor. Weight was measured, using a calibrated weighing machine (MS-3400 PIR; MARSDEN, Taiwan), to the nearest 0.1 kg with the participants barefoot and clothed in light clothing. The participants were asked to stand on the centre of the scale without support and to distribute their weight evenly on both feet. Body mass index (BMI) was calculated as weight/(height)2 (kg/m2). The classification of BMI for Asian populations, according to the World Health Organization (WHO) 2000 guideline,(18) was used in this study.
Waist and hip circumferences were measured using a nonextendable measuring tape (SECA, Hamburg, Germany) to the nearest 0.1 cm. Waist measurement was made midpoint between the lower border of the ribs and the iliac crest in a horizontal plane. The measurement was taken at the end of the participant's normal expiration with arms relaxed and at the side. Hip circumference was measured at the level of greatest protuberance of the buttocks, which corresponds anteriorly to the level of the symphysis pubis. Participants were asked to stand with their feet together without tensing the gluteal muscles while the measurement was being taken. The person taking the measurements stood or knelt at the side of the participant to ensure that the tape was held horizontally. Waist-to-hip ratio was obtained by dividing the mean waist circumference by the mean hip circumference. Systolic and diastolic blood pressures were measured, using a sphygmomano-meter, with the participants seated and after a period of rest (at least 15 mins).
Statistical analysis was done using the Statistical Package for the Social Sciences version 18 (SPSS Inc, Chicago, IL, USA). Continuous data was presented as mean ± standard deviation for normal distribution, and as median (interquartile range) for skewed distribution. Sample data was tested for normal distribution using the Kolmogorov-Smirnov test. Mann-Whitney analysis or t-test was used to compare the continuous variables between groups. Categorical variables were compared using chi-square and Fisher's exact tests of significance. In order to identify variables associated with obesity, the following possible variables were analysed using univariate analysis: gender; age; income; sleep duration; smoking status; total METs per week; regular meal intake; frequency of breakfast, lunch and dinner; frequency of dairy intake; soy milk intake; frequency of vegetable intake; frequency of fruit intake; frequency of high-fibre food intake; intake of supplementary vitamin A, C, E and calcium; perception of what constitutes a balanced diet; minutes of sitting per day; and perceived stress. Variables that were found to be significant were included in a binary logistic regression analysis to determine the independent risk factors for obesity. A p-value < 0.05 was considered statistically significant.
RESULTS
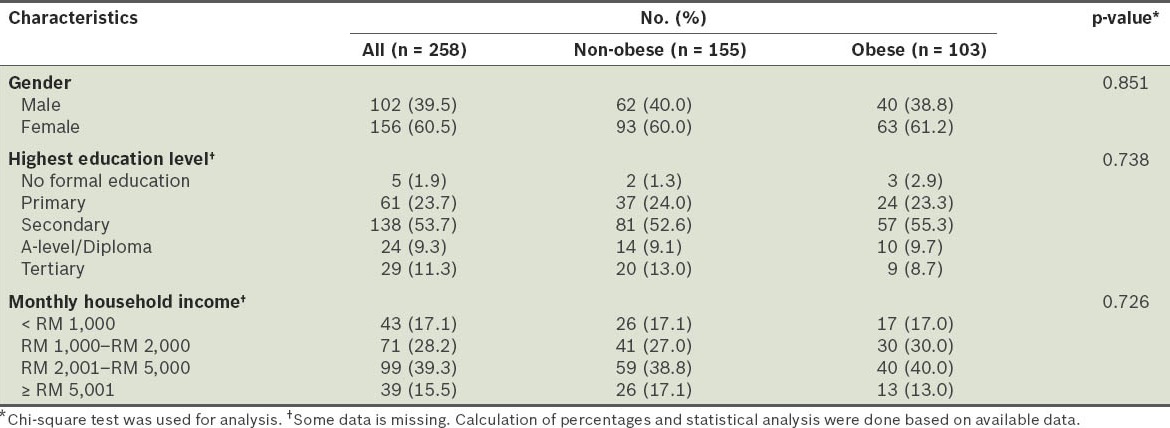
A total of 258 residents of Seri Kembangan New Village, Klang Valley, Selangor, Malaysia, were recruited. All 258 participants were Malaysian Chinese. The mean age of these participants was 41.4 ± 10.0 years. More than half (60.5%) were females, and almost half (53.7%) of the participants had secondary education as their highest education level. Only 5 (1.9%) participants did not receive any formal education. The majority of the participants had a monthly household income of more than RM 1,000, and approximately 40% belonged to the RM 2,001–RM 5,000 income group (Table I).
Table I.
Sociodemographic characteristics of the participants (n = 258).
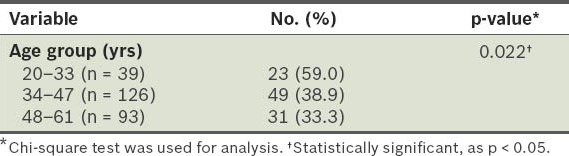
Based on the WHO BMI classification for Asians,(18) 21% of the participants in our study were overweight (i.e. BMI 23.00–24.99 kg/m2), 40% were obese (i.e. BMI ≥ 25.00 kg/m2), 38% had normal body weight (i.e. BMI 18.50–22.99 kg/m2), and 1% were underweight (i.e. BMI < 18.50 kg/m2). The mean age of the non-obese participants was significantly higher than that of the obese participants (44.88 ± 9.40 years vs. 41.41 ± 10.02 years; p < 0.05). The prevalence of obesity was significantly higher in participants from the age group 20–33 years (59.0%) than in participants from the 34–47 years and 48–61 years age groups (38.9% and 33.3%, respectively) (p < 0.05) (Table II).
Table II.
Prevalence of obesity in the different age groups.
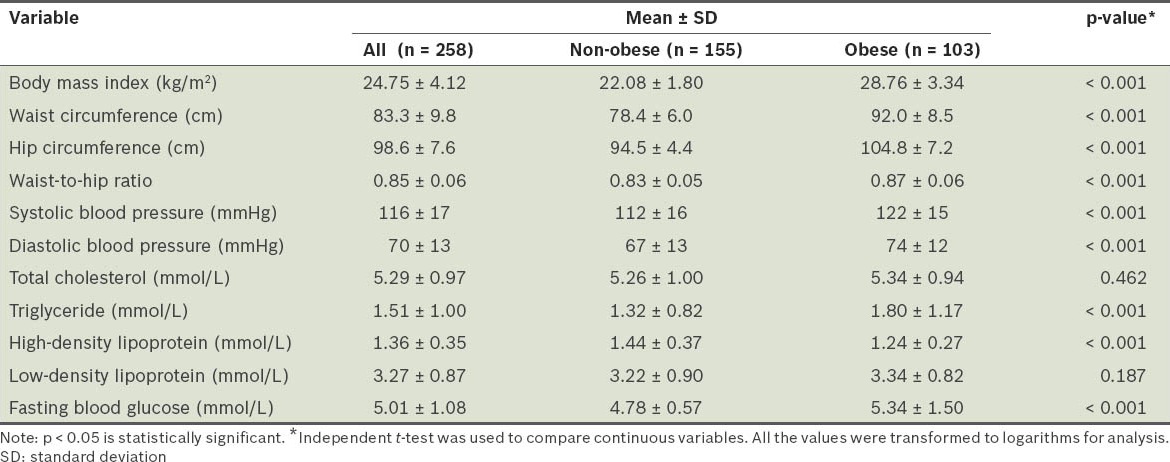
No significant difference was found between the educational levels and household incomes of the obese and non-obese groups (Table I). When compared with participants who were non-obese, the participants who were obese had significantly higher mean waist circumference (92.0 ± 8.5 cm vs. 78.4 ± 6.0 cm; p < 0.05), mean hip circumference (104.1 ± 7.2 cm vs. 94.5 ± 4.4 cm; p < 0.05) and waist-to-hip ratio (0.87 ± 0.06 vs. 0.83 ± 0.05; p < 0.05). The mean blood pressure of the obese participants (systolic 122 ± 15 mmHg, diastolic 74 ± 15 mmHg) was also significantly higher than the non-obese participants (systolic 112 ± 16 mmHg; diastolic 67 ± 13 mmHg) (p < 0.05). Furthermore, the obese participants had significantly higher TG and fasting plasma glucose levels, and significantly lower HDL cholesterol levels than the non-obese participants. There was no significant difference in the LDL cholesterol levels between the two groups (Table III).
Table III.
Comparison of the anthropometric and biochemical profiles of the participants.
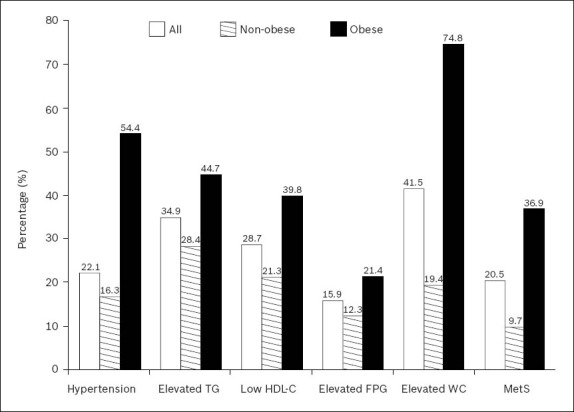
Overall, 20.5% of the participants (36.9% obese and 9.7% non-obese) were found to have metabolic syndrome. Among the characteristic features of metabolic syndrome, two of the most common features found in our study population were abdominal obesity (41.5%) and elevated TG (34.9%). When compared with the non-obese participants, the prevalence of all the characteristic features of metabolic syndrome was higher in the obese participants. In the non-obese group, 28.4% had elevated TG levels, 21.3% had low HDL cholesterol, and 12.3% had elevated fasting plasma glucose (Fig. 1).
Fig. 1.
Prevalence of metabolic syndrome and characteristic features of metabolic syndrome of the participants. Chi-square and Fisher's exact tests of significance were used; p-value < 0.05 for all features. FPG: fasting plasma glucose; HDL-C: high-density lipoprotein cholesterol; MetS: metabolic syndrome; TG: triglyceride; WC: waist circumference
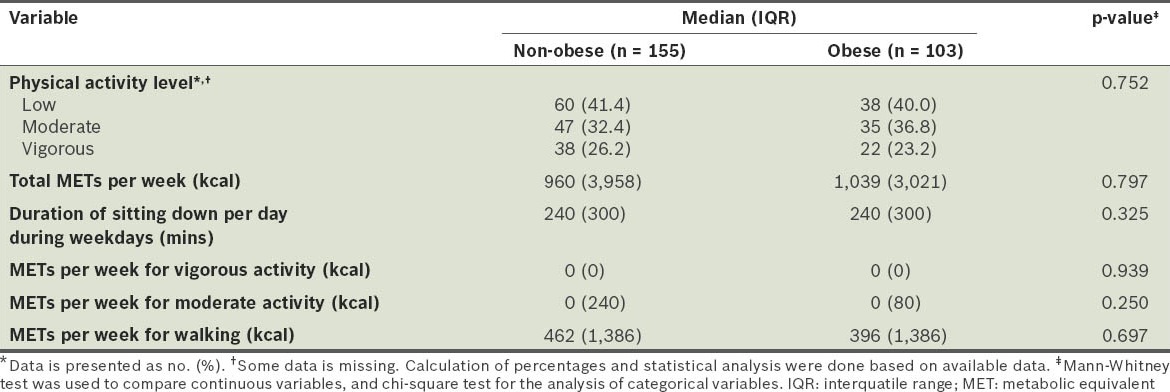
MET classification showed that there was a high prevalence of low physical activity in both the obese and non-obese participants (40.0% and 41.4%, respectively). Only about a quarter of the participants were categorised into the vigorous-intensity physical activity group (non-obese 26.2%, obese 23.2%). Overall, there was no significant difference in the level of physical activity between the two groups (Table IV).
Table IV.
Level of physical activity of the participants.
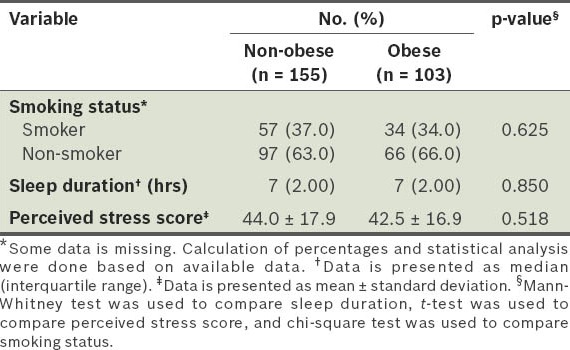
Although not statistically significant, the proportion of obese participants who consumed dairy products, vegetables, fruits, high-fibre food and supplements daily was less than the proportion of non-obese participants who did. A significantly lower proportion of obese participants consumed soy milk when compared to the non-obese participants (28.2% vs. 41.3%; p < 0.05). While most of the participants had a correct perception of what a balanced diet is (defined as meals consisting of meat, vegetable and other varieties of food), a higher percentage of the non-obese participants believed that a balanced diet should consist mainly of vegetables (24.7% non-obese vs. 12.7% obese), although this difference was not statistically significant (p = 0.066) (Table V). There were no significant differences between the obese and non-obese participants in terms of sleep duration, perceived stress and smoking status (Table VI).
Table V.
Dietary habits of the participants.
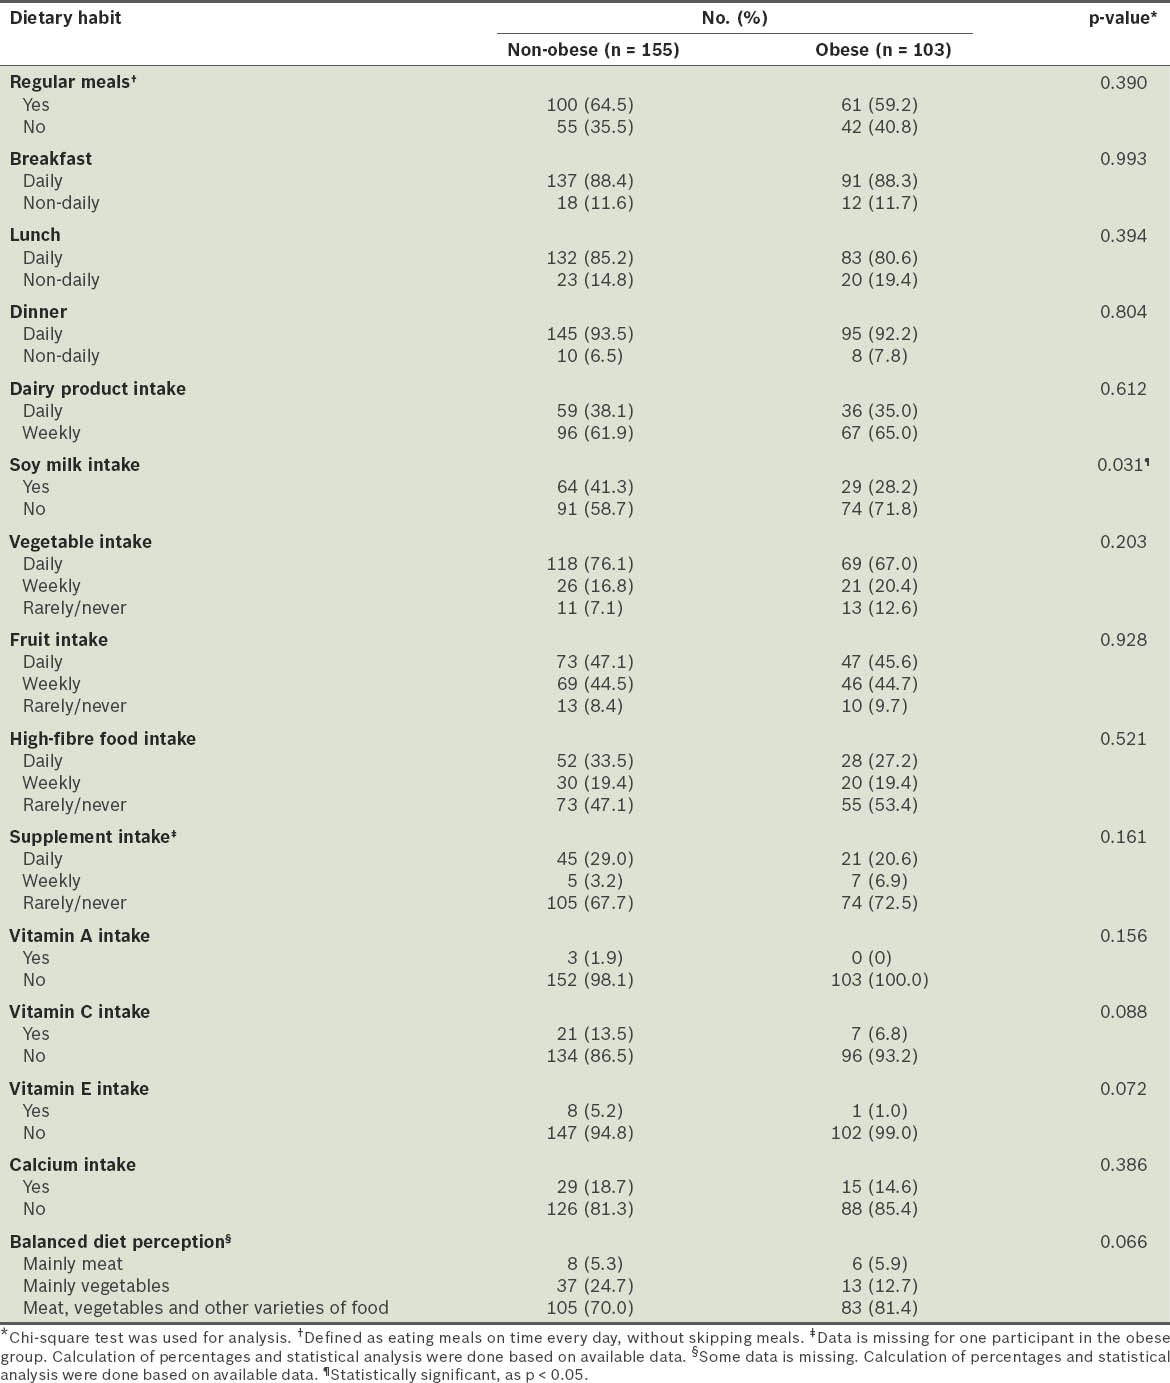
Table VI.
Comparison of the smoking status, sleep duration and perceived stress scores of the participants.
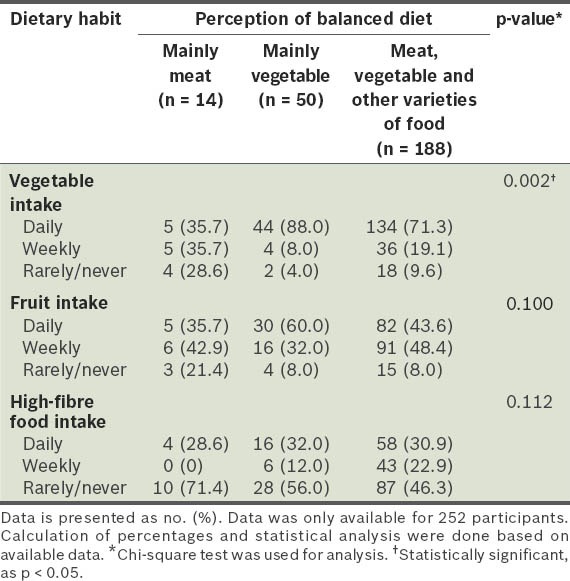
In our study, logistic regression analysis showed that only three risk factors were significantly associated with obesity: (a) soy milk intake was associated with a reduced risk of obesity (adjusted OR 0.447; 95% CI 0.253–0.787; p < 0.05); (b) the perception that a balanced diet consists mainly of vegetables was associated with a reduced risk of obesity (adjusted OR 0.440; 95% CI 0.215–0.900; p < 0.05); (c) younger age was associated with an increased risk of obesity (adjusted OR 2.714; 95% CI 1.225–6.011; p < 0.05) (Table VII). We found that there was a significantly higher proportion of participants who consumed vegetables daily among those with the perception that a balanced diet consists mainly of vegetables, as compared to those who did not have that perception (p = 0.002) (Table VIII).
Table VII.
Logistic regression analysis for the predictors of obesity.
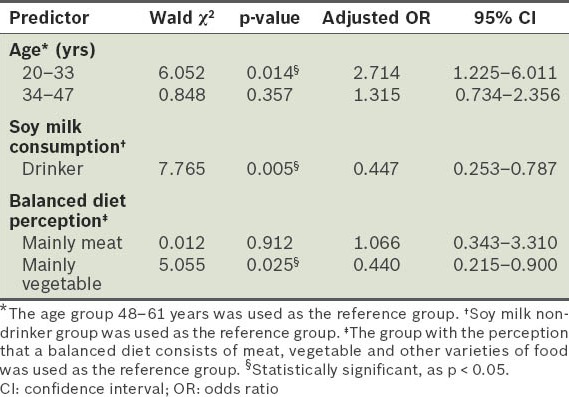
Table VIII.
Frequency of vegetable, fruit and high-fibre food intake of participants, according to their perception of what a balanced diet is.
DISCUSSION
Based on WHO's BMI classification for Asians,(18) the participants in the present study were generally overweight (median BMI 23.9 kg/m2). The prevalence of obesity in this study's suburban Chinese population (40%) is higher than the prevalence of obesity in the general Malaysian Chinese population (11.9%) recorded in the 2011 Malaysian Non- Communicable Disease Surveillance-1 (MyNCDS-1) report.(19) In contrast, the prevalence of overweight participants in the present study (21%) was lower than that recorded in the 2011 MyNCDS-1 report (28.7%).(19)
In order to compare the findings of the present study with other studies conducted in Malaysia, the overweight and obese participants were reclassified using the WHO international BMI classification.(20) After the reclassification, the prevalence of overweight (i.e. BMI 25.00–29.99 kg/m2) and obese (BMI ≥ 30.00 kg/m2) participants were 28.3% and 11.6%, respectively. These recalculated prevalence rates remain higher than the prevalence rates of the general Malaysian Chinese population reported by other studies.(6)
The prevalence of overweight and obese persons among Malaysians of Chinese ethnicity has been previously reported to be lower than that among Malaysians of Indian or Malay ethnicity.(6,19) However, the prevalence of obesity among the Chinese surveyed in the present study (40%) was much higher than that reported for Malays (18.5%) and Indians (18.0%) in the 2011 MyNCDS-1 report.(19) Lifestyle differences may be a factor contributing to the higher prevalence of obesity in the Chinese population. A study by Khoo et al suggested that the impact of BMI and waist circumference on insulin resistance, inflammation and adiponectin is greater in Asian Chinese than in Asian Indians and Malays.(21) This indicates that the risk of obesity-related diseases among the Chinese in our study population may be relatively higher.
The mean age of the obese participants in this study was significantly lower than that of the non-obese participants. When this association was further analysed in the logistic regression analysis, we found that the risk of obesity was significantly higher in the participants in the younger age group (20–33 years) than those in the older age group (48–61 years). This finding is contrary to most studies, which show that the prevalence of obesity increases from young (> 20 years old) to middle-aged adults (< 55 years old), and appears to decrease in the elderly (> 55 years old).(5,19,22-23) This contrast in finding may be due to the bias that resulted from using convenience sampling in this study.
In the present study, the prevalence of metabolic syndrome in the Chinese population (21%) was lower than the reported national prevalence among Malaysian Chinese (30%).(24) One possible explanation for this difference is this study's exclusion of residents with chronic diseases. Among the non-obese participants, 15 (10%) of them had metabolic syndrome. About a quarter of the non-obese participants had at least one feature of metabolic syndrome, with the most common feature being elevated TG level. This finding is consistent with other studies that have shown cardiometabolic abnormalities among normal-weight adults.(25,26)
Both the obese and non-obese participants in our study had similar dietary habits. We found that there was a significant negative association between soy milk intake and obesity (p < 0.05). This finding is consistent with the reports of other epidemiological and experimental studies that suggested that soy intake may promote weight loss.(27-29) However, others have suggested that soy intake among certain groups of people may be an indicator of a healthy lifestyle, which contributes to weight loss, and that weight loss is not directly related to the properties of soy.(27) While our study did not further investigate the effect of quantity or frequency of soy consumption against obesity, it may be worthwhile for such a study to be conducted.
Other than soy milk intake, the results of our logistic regression analysis also showed that participants with the perception that a balanced diet consists primarily of vegetables were associated with a lower risk of obesity than participants who perceived a balanced diet to be one consisting of meat, vegetables and other varieties of food. Further analysis found that this association was significantly related to the frequency of vegetable intake of the former group of participants. Indeed, personal perception may have a great impact on health, as individuals with strong intentions were shown to have perceived behavioural control over their consumption of ‘unhealthy food’ by consuming more fruits and vegetables.(30) A study conducted by the Economics Research Service showed an inverse correlation between the amount of fruits and vegetables consumed and obesity, suggesting that individuals who eat more servings of fruits and vegetables have lower BMI.(31) These findings support the results of the present study (i.e. participants who perceived a balanced diet to consist mainly of vegetables had a decreased risk of becoming obese, when compared to participants who perceived a balance diet to consist mainly of meat, or of meat, vegetables and other varieties of foods).
The limitations of the present study include a sample size that was not sufficiently large for a population study and the use of convenience sampling, which may have introduced bias in this study. In addition, the intake of food (e.g. soy milk) was not quantitatively measured in this study.
In conclusion, the prevalence of obesity among the Malaysian Chinese in our study is much higher than that previously reported among the general Malaysian Chinese population. Our findings suggest that soy milk intake and the perception that a balanced diet consists mainly of vegetables are associated with a lower risk of developing obesity in this population. In our study, we found that some non-obese participants had characteristics of metabolic syndrome, with elevated TG and low HDL cholesterol levels as the two most common features. This finding suggests that there is a need to carry out regular health screenings for the public, including the non-obese, for the identification of individuals with an increased risk of cardiovascular diseases and type 2 diabetes mellitus.
ACKNOWLEDGEMENTS
We extend our appreciation to the participants of this study, the community of Seri Kembangan New Village, Dr Chandrashekar, Dr Robert Chen, Dr Tan Kian Lee, Dr Lim Yang Moi, Dr Nadia Mohamad Hatta, Lim Shih Liang, Liew Siew Fun, Woo Lee Fong and the second-year medical students from UTAR for their contributions to this study.
REFERENCES
- 1.Chan JM, Rimm EB, Colditz GA, Stampfer MJ, Willett WC. Obesity, fat distribution, and weight gain as risk factors for clinical diabetes in men. Diabetes Care. 1994;17:961–9. doi: 10.2337/diacare.17.9.961. [DOI] [PubMed] [Google Scholar]
- 2.Poirier P, Giles TD, Bray GA, et al. Obesity and cardiovascular disease: pathophysiology, evaluation, and effect of weight loss: an update of the 1997 American Heart Association Scientific Statement on Obesity and Heart Disease from the Obesity Committee of the Council on Nutrition, Physical Activity, and Metabolism. Circulation. 2006;113:898–918. doi: 10.1161/CIRCULATIONAHA.106.171016. [DOI] [PubMed] [Google Scholar]
- 3.Steffen A, Schulze MB, Pischon T, et al. Anthropometry and esophageal cancer risk in the European prospective investigation into cancer and nutrition. Cancer Epidemiol Biomarkers Prev. 2009;18:2079–89. doi: 10.1158/1055-9965.EPI-09-0265. [DOI] [PubMed] [Google Scholar]
- 4.Seidell JC. Obesity, insulin resistance and diabetes -- a worldwide epidemic. Brit J Nutr. 2000;83:S5–8. doi: 10.1017/s000711450000088x. [DOI] [PubMed] [Google Scholar]
- 5.Flegal KM, Carroll MD, Ogden CL, Curtin LR. Prevalence and trends in obesity among US adults, 1999-2008. JAMA. 2010;303:235–41. doi: 10.1001/jama.2009.2014. [DOI] [PubMed] [Google Scholar]
- 6.Khambalia AZ, Seen LS. Trends in overweight and obese adults in Malaysia (1996-2009): a systemic review. Obes Rev. 2010;11:403–12. doi: 10.1111/j.1467-789X.2010.00728.x. [DOI] [PubMed] [Google Scholar]
- 7.Putrajaya: Disease control division, Ministry of Health Malaysia; 2005. Ministry of Health Malaysia. Malaysia NCD Surveillance. 2006: NCD Risk Factors in Malaysia. [Google Scholar]
- 8.Kopelman PG. Obesity as a medical problem. Nature. 2000;404:635–43. doi: 10.1038/35007508. [DOI] [PubMed] [Google Scholar]
- 9.Rugayah B, Osman A, Kew ST, et al. Vol. 9. Kuala Lumpur: Ministry of Health Malaysia; 1996-1997. Diabetes mellitus among adults aged 30 years and above. In Ministry of Health Malaysia. National Health and Morbidity Survey. [Google Scholar]
- 10.Azmi MY, Jr, Junidah R, Siti Mariam A, et al. Body Mass Index (BMI) of Adults: Findings of the Malaysian Adult Nutrition Survey (MANS) Malays J Nutr. 2009;15:97–119. [PubMed] [Google Scholar]
- 11.Rampal L, Rampal S, Khor GL, et al. A national study on the prevalence of obesity among 16,127 Malaysians. Asia Pac J Clin Nutr. 2007;16:561–6. [PubMed] [Google Scholar]
- 12.Alberti KG, Eckel RH, Grundy SM, et al. Harmonizing the metabolic syndrome. A joint interim statement of the International Diabetes Federation Task Force on Epidemiology and Prevention; National Heart, Lung, and Blood Institute; American Heart Association; World Heart Federation; International Atherosclerosis Society; and International Association for the Study of Obesity. Circulation. 2009;120:1640–5. doi: 10.1161/CIRCULATIONAHA.109.192644. [DOI] [PubMed] [Google Scholar]
- 13.Ekelund U, Sepp H, Brage S, et al. Criterion-related validity of the last 7-day, short form of the International Physical activity Questionnaire in Swedish adults. Public Health Nutr. 2006;9:258–65. doi: 10.1079/phn2005840. [DOI] [PubMed] [Google Scholar]
- 14.The International Physical Activity Questionnaire. 2005. [Accessed January 20 2011]. Available at http://www.ipaq.ki.se .
- 15.Craig CL, Marshall AL, Sjöström M, et al. International physical activity questionnaire: 12-country reliability and validity. Med Sci Sports Exerc. 2003;35:1381–95. doi: 10.1249/01.MSS.0000078924.61453.FB. [DOI] [PubMed] [Google Scholar]
- 16.Levenstein S, Prantera C, Varvo V, et al. Development of the Perceived Stress Questionnaire: a new tool for psychosomatic research. J Psychosom Res. 1993;37:19–32. doi: 10.1016/0022-3999(93)90120-5. [DOI] [PubMed] [Google Scholar]
- 17.Olds T, Norton K. Sydney: University of New South Wales Press; 1996. Anthropometrica: a textbook of body measurement for sports and health courses. [Google Scholar]
- 18.Health Communications Australia Pty Limited; 2000. World Health Organization/International Obesity TaskForce/International Association for the Study of Obesity. The Asia-Pacific perspective: Redefining obesity and its treatment. [Google Scholar]
- 19.Tan AK, Yen ST, Feisul MI. Determination of body weight status in Malaysia: an ethnic comparison. Int J Public Health. 2011;57:279–88. doi: 10.1007/s00038-011-0238-8. [DOI] [PubMed] [Google Scholar]
- 20.Geneva: World Health Organization; 2000. World Health Organization. Obesity: preventing and managing the global epidemic. Report of a WHO Consultation (WHO Technical Report Series 894) [PubMed] [Google Scholar]
- 21.Khoo CM, Sairazi S, Taslim S, et al. Ethnicity modifies the relationships of insulin resistance, inflammation, and adiponectin with obesity in a multiethnic Asian population. Diabetes Care. 2011;34:1120–6. doi: 10.2337/dc10-2097. [DOI] [PMC free article] [PubMed] [Google Scholar]
- 22.Reynolds K, Gu D, Whelton PK, et al. Prevalence and risk factors of overweight and obesity in China. Obesity (Silver Spring) 2007;15:10–8. doi: 10.1038/oby.2007.527. [DOI] [PubMed] [Google Scholar]
- 23.Wang Y, Beydoun MA. The obesity epidemic in the United States--gender, age, socioeconomic, racial/ethnic, and geographic characteristics: a systematic review and meta-regression analysis. Epidemiol Rev. 2007;29:6–28. doi: 10.1093/epirev/mxm007. [DOI] [PubMed] [Google Scholar]
- 24.Tan AK, Dunn RA, Yen ST. Ethnic disparities in metabolic syndrome in Malaysia: an analysis by risk factors. Metab Syndr Relat Disord. 2011;9:441–51. doi: 10.1089/met.2011.0031. [DOI] [PMC free article] [PubMed] [Google Scholar]
- 25.Rederman N, Chisholm D, Pi-Sunyer X, Schneider S. The metabolically obese, normal-weight individual revisted. Diabetes. 1998;47:699–713. doi: 10.2337/diabetes.47.5.699. [DOI] [PubMed] [Google Scholar]
- 26.Wildman RP, Muntner P, Reynolds K, et al. The obese without cardiometabolic risk factor clustering and the normal weight with cardiometabolic risk factor clustering prevalence and correlates of 2 phenotypes among the US population (NHANES 1999-2004) Arch Intern Med. 2008;168:1617–24. doi: 10.1001/archinte.168.15.1617. [DOI] [PubMed] [Google Scholar]
- 27.Maskarinec G, Aylward AG, Erber ET, Takata Y, Kolonel LN. Soy intake is related to a lower body mass index in adult women. Eur J Nutr. 2008;47:138–44. doi: 10.1007/s00394-008-0707-x. [DOI] [PMC free article] [PubMed] [Google Scholar]
- 28.Diebert P, König D, Schmidt-Trucksaess A, et al. Weight loss without losing muscle mass in pre-obese and obese subjects induced by a high-soy-protein diet. Int J Obes Relat Metab Disord. 2004;28:1349–52. doi: 10.1038/sj.ijo.0802765. [DOI] [PubMed] [Google Scholar]
- 29.Christie DR, Grant J, Darnell BE, et al. Metabolic effects of soy supplementation in postmenopausal Caucasian and African American women: a randomized, placebo-controlled trial. Am J Obstet Gynecol. 2010;203:153. doi: 10.1016/j.ajog.2010.02.058. [DOI] [PMC free article] [PubMed] [Google Scholar]
- 30.Boucher D, Gagné C, Côté F. [Determinants of the intention of post-secondary students to eat at least five servings of vegetables and fruit daily] Rev Epidemiol Sante Publique. 2012;60:109–19. doi: 10.1016/j.respe.2011.10.003. French. [DOI] [PubMed] [Google Scholar]
- 31.Etilé F. Social norms, ideal body weight and food attitudes. Health Econ. 2007;16:945–66. doi: 10.1002/hec.1251. [DOI] [PubMed] [Google Scholar]