

Abstract
INTRODUCTION
The aim of the present study was to assess the prevalence of vitamin D deficiency and toxicity, the frequency of 25-hydroxyvitamin D (25[OH]D) testing, and 25(OH)D variations with respect to patient gender, patient age and season in New South Wales, Australia.
METHODS
A retrospective analysis of pathology records was performed to ascertain patient age, patient gender, sample collection date, plasma or serum 25(OH)D levels, calcium and parathyroid hormone (PTH) levels, and test numbers between 2001 and 2010. Linear regression with Bonferroni correction was used to calculate and compare age- adjusted mean 25(OH)D levels. Relationships of 25(OH)D with PTH and calcium were tested using Spearman’s rank correlation.
RESULTS
25(OH)D testing increased by 730% over the ten-year study period. In 2010, many men (33%) and women (40%) were, to some degree, vitamin D deficient (≤ 50 nmol/L). Vitamin D toxicity was rare, with only one instance noted. 25(OH)D levels correlated positively with calcium and negatively with PTH levels. 25(OH)D levels decreased with age. In 2010, 25(OH)D levels were highest in February and lowest in September/October. Cyclical variation was observed for 25(OH)D levels between 2006 and 2010.
CONCLUSION
We found that vitamin D deficiency was prevalent in both men and women, with a higher prevalence in the latter, despite the substantial increased demand for 25(OH)D testing in our population over the decade. Vitamin D deficiency was associated with elevated PTH levels. Vitamin D toxicity was rare and only observed once during our study period. 25(OH)D levels decreased with age and varied with season, with the highest levels observed in late summer and the lowest in early spring.
Keywords: 25-hydroxyvitamin D, age, calcium, deficiency, toxicity
INTRODUCTION
Vitamin D is a steroid prohormone that plays an integral role in maintaining calcium homeostasis and bone health. Vitamin D exists in two forms – D2 (ergocalciferol), which is obtained from yeast,(1) and D3 (cholecalciferol), which is present in fish and eggs.(2) However, the primary source of vitamin D3 is via ultraviolet irradiation of a precursor molecule – 7-dehydro-cholesterol – in the skin, which results in the formation of an unstable previtamin D3 molecule, which then rearranges into vitamin D3.(3) Vitamin D is subsequently hydroxylated by the loosely regulated enzyme 25-hydroxylase to produce 25-hydroxyvitamin D (25[OH]D).(4) 25(OH)D is then metabolised by the tightly regulated enzyme 1-hydroxylase to form 1,25-dihydroxyvitamin D (1,25[OH]2D or calcitriol), which is the biologically active form of vitamin D.(5) 1,25(OH)2D, together with parathyroid hormone (PTH), plays a major role in the regulation of calcium homeostasis.(6)
With a half-life of about three weeks,(7) 25(OH)D is widely regarded as the best indicator of vitamin D status, as 1,25(OH)2D only has a half-life of 4–6 hours.(8) The following is a summary of the categorisation of 25(OH)D status, as defined by the Australian and New Zealand Bone and Mineral Society, the Endocrine Society of Australia, and Osteoporosis Australia: severe vitamin D deficiency, 25(OH)D < 15 nmol/L; moderate vitamin D deficiency, 25(OH)D 15–25 nmol/L; mild vitamin D deficiency, 25(OH)D 26–50 nmol/L; vitamin D insufficiency, 25(OH)D 51–75 nmol/L; and, vitamin D sufficiency, 25(OH)D > 75 nmol/L.(9,10)
Vitamin D deficiency is a global health problem that is largely caused by insufficient exposure to sunlight.(11) It is particularly prevalent among elderly people.(12) An estimated one billion people have vitamin D deficiency or insufficiency.(6) It is well established that vitamin D deficiency is associated with bone diseases such as rickets,(13) osteoporosis and osteomalacia.(14) Recently, vitamin D deficiency has also been associated with cardiovascular disease,(15) chronic kidney disease,(16) diabetes mellitus,(17) multiple sclerosis,(18) systemic lupus erythematosus,(19) cystic fibrosis,(20) and tumours such as those in colorectal cancer,(21) breast cancer(22) and prostate cancer.(23)
In contrast, vitamin D toxicity is extremely rare, usually occurring as a result of accidental overdose or consumption of supplements, and is characterised by hypercalcaemia.(24) Symptoms of vitamin D toxicity include nausea, constipation, weakness, weight loss, hypertension, soft tissue calcification, aches and stiffness, headaches, coma, and possible death.(10) Toxic vitamin D levels cannot be achieved simply from excessive solar exposure because ultraviolet light also converts previtamin D into biologically inactive sterols.(8) Following prolonged sunlight exposure alone, serum 25(OH)D can only reach a maximum of about 150–200 nmol/L. Elevated calcium is usually not detected until circulatory concentrations of 25(OH)D reach around 220 nmol/L.(25) While there is no precise threshold to indicate vitamin D toxicity, the literature suggests adverse physiological effects when circulatory 25(OH)D levels approximately surpass 500 nmol/L.(26-28)
Given the significance of vitamin D in health and disease, we conducted a retrospective study to analyse the biochemical results stored in the database of a pathology laboratory situated in New South Wales, Australia, to determine: (a) the prevalence of vitamin D deficiency and toxicity; (b) the extent of 25(OH)D testing; and (c) whether variations occurred in vitamin D status with regard to gender, age and season within the population studied.
METHODS
We retrospectively analysed the patient records maintained in the electronic database of a pathology laboratory, with respect to variables such as age, gender, sample collection date, and the plasma or serum levels of 25(OH)D, calcium and PTH.
Blood samples were collected in either plain or lithium-heparin tubes, centrifuged at 3,500 rpm for 15 mins, and frozen at −20°C until analysis. 25(OH)D was initially quantified using a manual 125iodine-labelled 25(OH)D radioimmunoassay (Immunodiagnostics Systems Limited, Boldon, Tyne and Wear, UK). However, to cope with the increased demand for such testing, the use of automated LIAISON® 25-OH Vitamin D assay (DiaSorin SpA, Saluggia, Italy), a direct competitive chemi-luminescence immunoassay for determining total 25(OH)D levels, was adopted in 2009. Serum or plasma calcium was tested using the RXL Dimension platform (Siemens Healthcare Diagnostics, Munich, Germany). Serum or lithium-heparin plasma PTH was measured using Immulite 2000 (Siemens Healthcare Diagnostics, Munich, Germany) or DXI 800 analysers (Beckman Coulter, Brea, CA, USA).
As the minimum range of the LIAISON® 25(OH)D method was 15 nmol/L, readings lower than that were reported in the laboratory’s database as ≤ 15 nmol/L. To allow for these measurements to be included numerically in our analysis, such readings were reassigned a value of 7.5 nmol/L. Reassigned values were calculated based on the mean of zero and the minimum reportable value of a particular assay. Therefore, for 25(OH)D, the reassigned value was 7.5 nmol/L. Similarly, for calcium, the reassigned value was 0.62 mmol/L.
A total of 41,177 25(OH)D levels (14,324 men, 26,853 women) were reported during the 10-year study period. Among these, 261 patients (71 men, 190 women) had 25(OH)D levels < 15 nmol/L, which were reassigned a value of 7.5 nmol/L for analysis. Among those tested prior to 2009, 35 patients (12 men, 23 women) had 25(OH)D levels lower than the minimum range of the 125iodine-labelled radioimmunoassay and were reassigned a value of 2.5 nmol/L for analysis. For three patients (2 men, 1 women) in 2010, for whom 25(OH)D levels were reported as > 375 nmol/L, the readings were reassigned to 376 nmol/L. Similarly, for five patients (5 women) in 2010, calcium levels were reported as < 1.25 mmol/L and were reassigned a value of 0.62 mmol/L for analysis. All PTH levels remained unchanged.
25(OH)D levels were normalised with a log10 transformation. Age-adjusted mean 25(OH)D levels and standard error of mean were calculated using linear regression analysis. Bonferroni corrected p-values were used for multiple comparisons. Percentage proportions by year, according to vitamin D status, were calculated and compared using chi-square test. The generalised estimating equation analysis, with odds ratios adjusted for age, was used to compare the proportions of vitamin D deficiency to some degree (25[OH]D ≤ 50 nmol/L) across genders and through the years 2001–2010. Spearman’s rank correlation was used to test the relationship between 25(OH)D levels and PTH and calcium levels. Analysis of variance (ANOVA) and Games-Howell post hoc test were used to compare unadjusted mean 25(OH)D levels by age group and gender. Data was analysed using the Statistical Package for the Social Sciences Standard GradPack v21.0 (IBM, Armonk, NY, USA). A p-value of < 0.05 was considered statistically significant.
RESULTS
Fig. 1 gives the gender-wise breakdown of 25(OH)D testing performed for patients over the ten-year study period. While the increase in test numbers was relatively modest during the first half of the decade, the demand for 25(OH)D testing increased considerably from 2006. A total of 1,265 tests (333 men, 932 women) were performed in 2001, whereas in 2010, 10,499 tests (3,745 men, 6,754 women) were performed. This translated into a 730% increase in total test numbers (1,025% men, 625% women) over the study period.
Fig. 1.
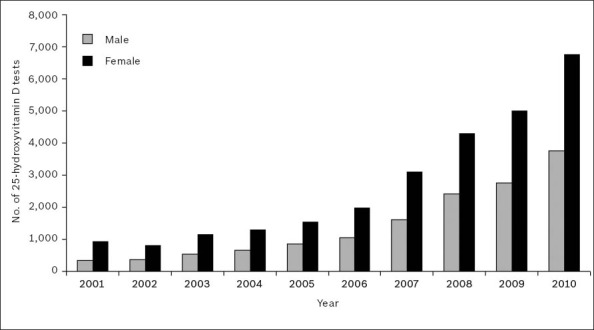
Gender-wise breakdown of 25-hydroxyvitamin D testing over the 2001–2010 period.
Fig. 2 shows the gender-wise frequency distribution of patients tested for 25(OH)D during the year 2010. When 25(OH)D measurements from < 15 nmol/L to > 200 nmol/L were grouped into five-unit-wide categories, the distribution of readings was found to be positively skewed towards the deficient portion of the spectrum, indicating that many patients in our population had either vitamin D deficiency or insufficiency.
Fig. 2.
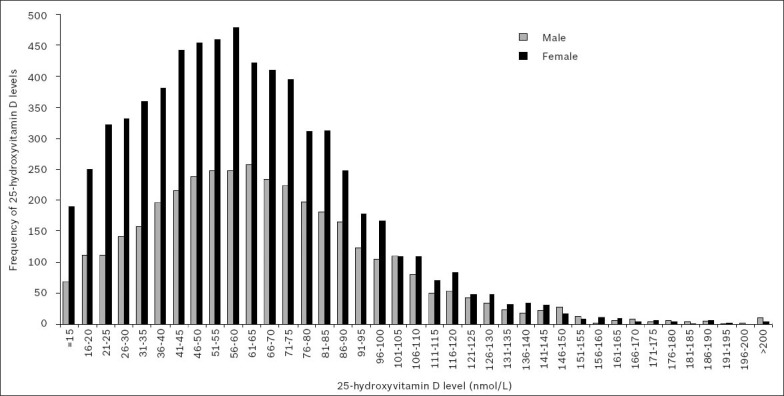
Gender-wise frequency distribution of serum or plasma 25-hydroxyvitamin D levels in 2010.
Fig. 3, which depicts the gender-wise age-adjusted mean 25(OH)D levels for patients tested in 2001–2010, shows an increasing trend of mean 25(OH)D levels among patients of both genders during the 2006–2010 period. This coincided with the period that saw an increasing demand for 25(OH)D testing (Fig. 1).
Fig. 3.
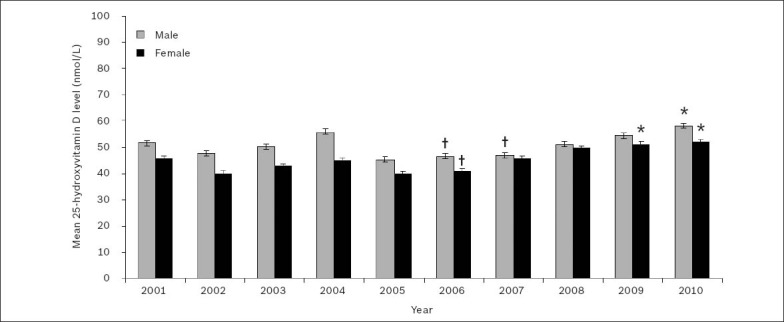
Gender-wise age-adjusted mean serum or plasma 25-hydroxyvitamin D levels over the 2001–2010 period. Note: Values are expressed as age-adjusted mean ± standard error of the mean.
*Significantly highest means during the 2006–2010 period. †Significantly lowest means during the 2006–2010 period (p < 0.001).
Linear regression with Bonferroni corrected multiple comparisons revealed that during the 2006–2010 period, age-adjusted mean 25(OH)D levels for men were significantly lowest in 2006 (25[OH]D 46.5 ± 1.0 nmol/L) and 2007 (25[OH]D 46.9 ± 1.0 nmol/L), and significantly highest in 2010 (25[OH]D 58.1 ± 1.0 nmol/L) (p < 0.001). During the same period, mean 25(OH)D levels for women were significantly lowest in 2006 (25[OH]D 40.8 ± 1.0 nmol/L), and significantly highest in 2009 (25[OH]D 51.1 ± 1.0 nmol/L) and 2010 (25[OH]D 51.9 ± 1.0 nmol/L) (p < 0.001).
The highest age-adjusted mean 25(OH)D levels during the study period were seen in 2010 (men, 58.1 ± 1.0 nmol/L; women, 51.9 ± 1.0 nmol/L). Linear regression showed that the difference between the mean age-adjusted 25(OH)D levels for men and women was significant (p < 0.001) and could be classified as vitamin D insufficient.(9,10)
Vitamin D deficiency
Patients tested in 2010 were categorised based on their 25(OH)D status – severe deficiency (25[OH]D < 15 nmol/L), moderate deficiency (25[OH]D 15–25 nmol/L), mild deficiency (25[OH]D 26–50 nmol/L), insufficiency (25[OH]D 51–75 nmol/L) and sufficiency (25[OH]D > 75 nmol/L) (Table I).(9,10) In 2010, 33% of 3,745 men and 40% of 6,754 women were vitamin D deficient to some degree (25[OH]D ≤ 50 nmol/L). Pearson’s chi-square test showed that, in 2010, the prevalence of vitamin D deficiency was to some degree significantly higher in women than in men (α2 = 55.175; p < 0.001). Using generalised estimating equations analysis with odds ratios and adjusting for the covariate of age (Table II), we found that all the years prior to 2010 were associated with higher odds of vitamin D deficiency to some degree (p < 0.01). Women were associated with 31% higher odds of vitamin D deficiency to some degree when compared to men (odds ratio 1.31, 95% confidence interval 1.25–1.36; p < 0.001).
Table I.
Gender-based distribution of patients according to 25-hydroxyvitamin D (25[OH]D) levels over the 2001–2010 period.
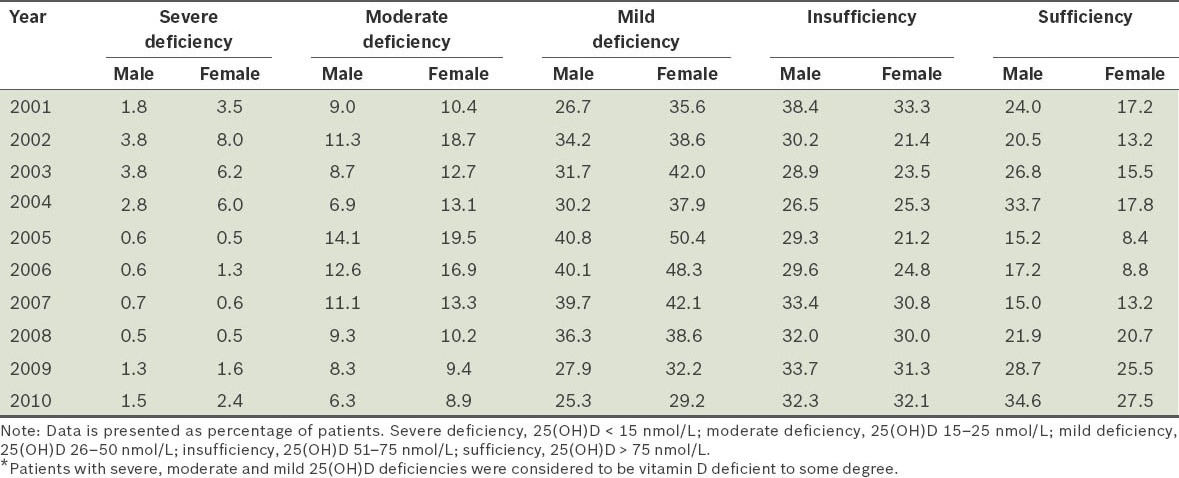
Table II.
Gender-based generalised estimating equations analysis of 25-hydroxyvitamin D deficiency to some degree over the 2001–2010 period, adjusted for age.

In 2010, PTH levels (reference range 1.3–9.3 pmol/L) were also reported for 1,383 patients (542 men, 841 women) who underwent 25(OH)D testing. The relationship between 25(OH)D and PTH levels for these patients is shown in Fig. 4. Mean PTH levels were 12.5 ± 0.7 pmol/L for men and 12.0 ± 0.7 pmol/L for women. Spearman’s rank correlation test found a significant negative association between PTH and 25(OH)D (p < 0.001), with a Spearman’s correlation coefficient of –0.229.
Fig. 4.
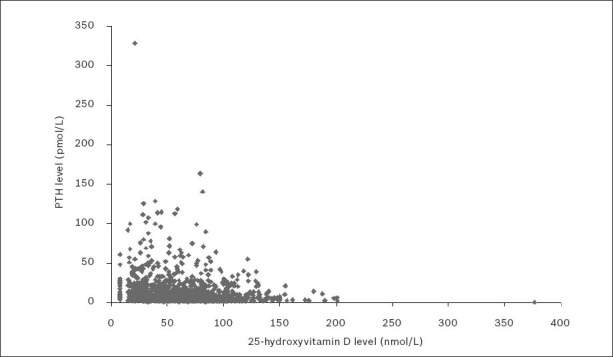
Serum or plasma parathyroid hormone (PTH) levels versus 25-hydroxyvitamin D (25[OH]D) levels in 2010.
Note: To aid the visual presentation of data, one outlying point (PTH 0.4 pmol/L; 25(OH)D 840 nmol/L) was omitted from the figure but not from the data analysis.
Throughout the 2001–2010 period, calcium levels (reference range 2.10–2.50 mmol/L) were reported for 20,849 patient samples (7,004 men, 13,845 women) that underwent 25(OH)D testing. The relationship between 25(OH)D and calcium levels for these patient samples is shown in Fig. 5. Mean calcium levels were 2.24 ± < 0.01 mmol/L for men, and 2.26 ± < 0.01 mmol/L for women. Spearman’s rank correlation test found a significant positive association between calcium and 25(OH)D levels (p < 0.001), with a Spearman’s correlation coefficient of 0.210.
Fig. 5.
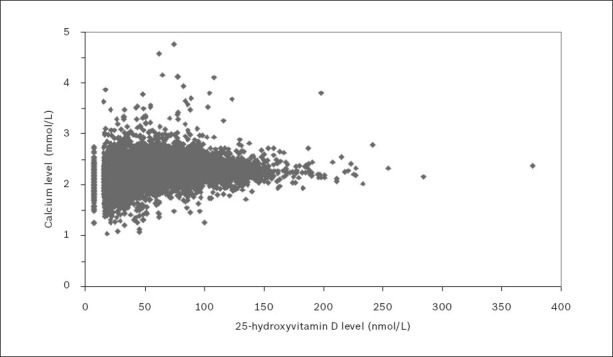
Serum or plasma calcium levels versus 25-hydroxyvitamin D (25[OH]D) levels over the 2001–2010 period.
Note: To aid the visual presentation of data, one outlying point (calcium 2.81 mmol/L; 25(OH)D = 840 nmol/L) was omitted from the figure but not from the data analysis.
According to the literature, vitamin D toxicity, as indicated by hypercalcaemia, occurs when circulatory 25(OH)D levels approximately surpass 500 nmol/L.(26-28) In our study, among the 20,849 patient samples for whom calcium levels, along with 25(OH)D levels, were known during the 2001–2010 period, 25(OH)D levels were found to have exceeded 200 nmol/L in only 18 patient samples. Of these, only three had an elevated calcium level (> 2.50 mmol/L) and only one had both a 25(OH)D level surpassing 500 nmol/L and an elevated calcium level (25[OH]D 840 nmol/L; calcium 2.81 mmol/L).
Patients for whom 25(OH)D testing was performed in 2010 were stratified according to age (i.e. 0–9 years, 10–19 years, 20–29 years, 30–39 years, 40–49 years, 50–59 years, 60–69 years, 70–79 years, 80–89 years, and those aged 90 years and over). Fig. 6, which depicts the gender-wise frequency distribution of patients tested for 25(OH)D in 2010 according to age group, shows a clear association of increasing 25(OH)D testing with age. The sharp decrease seen in the test numbers among patients aged 90 years and over is likely to have been related to age-related mortality in these patients.
Fig. 6.
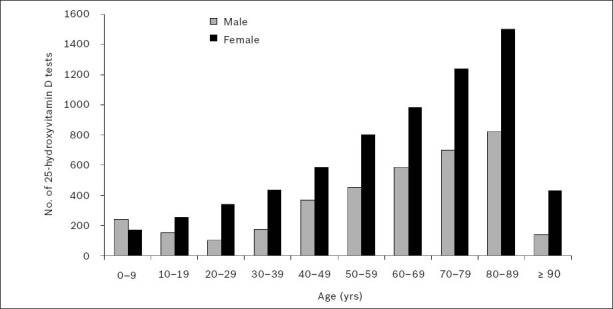
Gender-wise frequency distribution of serum or plasma 25-hydroxyvitamin D testing in 2010, according to age group.
Fig. 7 shows the gender-wise unadjusted mean 25(OH)D levels for patients tested in 2010, according to age group. Separate one-way ANOVA of the data for men and women showed a significant difference in the mean 25(OH)D levels among the age groups (p < 0.001). Two-way ANOVA, with gender and age group as independent factors, detected significant association between these two variables and 25(OH)D levels in patients (p < 0.01).
Fig. 7.
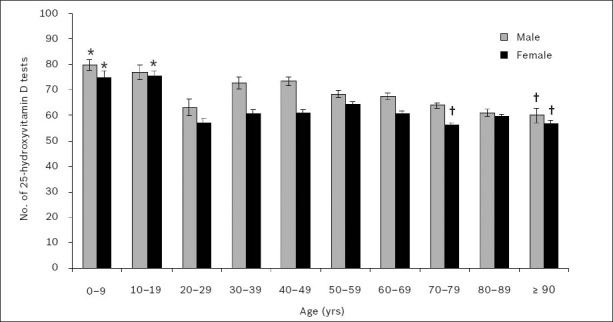
Gender-wise unadjusted mean serum or plasma 25-hydroxyvitamin D levels in 2010, according to age group. *Significantly highest means (p < 0.05). †Significantly lowest means.
The Games-Howell post hoc test showed that mean 25(OH)D levels were significantly higher in younger age groups for both men and women. In men, mean 25(OH)D levels were significantly highest in patients aged 0–9 years (25[OH]D 80 ± 2 nmol/L) and significantly lowest in those aged 90 years and over (25[OH]D 60 ± 3 nmol/L) (p < 0.05). In women, mean 25(OH)D levels were significantly highest in patients aged 0–9 years (25[OH]D 75 ± 2 nmol/L) and 10–19 years (25[OH]D 75 ± 2 nmol/L), and significantly lowest in those aged 70–79 years (25[OH]D 56 ± 1 nmol/L) and 90 years and over (25[OH]D 56 ± 2 nmol/L) (p < 0.05). However, the mean 25(OH)D levels for patients aged 20–29 years were found to deviate from the general trend of decreasing mean 25(OH)D levels with increasing age, for both men (25[OH]D 63 ± 3 nmol/L) and women (25[OH]D 57 ± 2 nmol/L); the mean 25(OH)D levels in these patients were found to be significantly lower or no different than that in older age groups (p < 0.05).
Fig. 8 shows the gender-wise monthly age-adjusted mean 25(OH)D levels in 2010. Linear regression with Bonferroni corrected multiple comparisons revealed that monthly age-adjusted mean 25(OH)D levels varied significantly during the year. Generally, 25(OH)D levels were higher during the southern hemisphere’s late summer (February) and lowest in early to mid-spring (September–October) in both men and women. In men, mean 25(OH)D levels were highest in February (71 ± 1 nmol/L) and lowest in October (52 ± 1 nmol/L) (p < 0.05). In women, mean 25(OH)D levels were highest in February (64 ± 1 nmol/L) and lowest in September (46 ± 1 nmol/L) (p < 0.05).
Fig. 8.
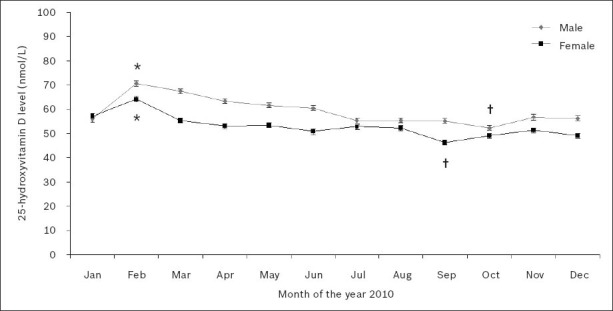
Gender-wise monthly age-adjusted mean serum or plasma 25-hydroxyvitamin D levels in 2010.
*Significantly highest means (p < 0.05). †Significantly lowest means.
25(OH)D levels were determined for 32,712 patient samples during the five-year period between 2006 and 2010. Fig. 9 shows the cyclical variation in the age-adjusted mean 25(OH)D levels of men and women during this period, with peaks seen during the southern hemisphere’s late summer/early autumn months of February and March and troughs in the late winter/early spring months of August and September.
Fig. 9.
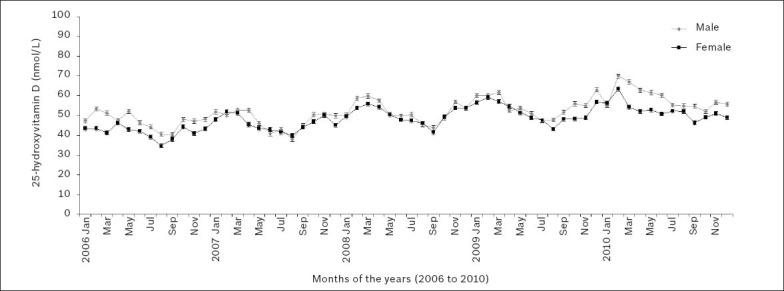
Gender-wise monthly age-adjusted mean serum or plasma 25-hydroxyvitamin D levels over the 2006–2010 five-year period.
DISCUSSION
Although in the past decade we have witnessed great interest in vitamin D and its association with health and disease, no studies have, to the best of our knowledge, reported on the vitamin D status of the population of New South Wales, Australia. The present retrospective study aimed to evaluate the prevalence of vitamin D deficiency and toxicity, the demand for vitamin D testing, and any variations in vitamin D status in the local population, according to gender, age and season.
The demand for vitamin D testing has increased dramatically in the past decade. In the United States, for instance, 25(OH)D testing at the San Francisco General Hospital and Trauma Center, San Francisco, California, USA, increased 20-fold from 2006 to 2009.(29) In Ontario, Canada, 25(OH)D testing was reported to have increased 25-fold from 2004 to 2010.(30) Similarly, 25(OH)D testing at a London hospital in the United Kingdom rose from 7,537 tests in 2007 to nearly 46,000 in 2010.(31) The Glasgow Royal infirmary in Scotland witnessed comparable increases as well – from 18,682 in 2008 to 37,830 in 2010.(31) Correspondingly, we found an overall sevenfold increase in vitamin D testing in New South Wales, Australia, between 2001 and 2010; an increase that prompted the laboratory rendering these services to switch from a manual radioimmunoassay to a faster automated platform. These increases suggest a greater awareness within the medical community regarding the importance of vitamin D status to effective healthcare.
Our data indicated that vitamin D deficiency was clearly prevalent in our population – (i) the frequency distribution of 25(OH)D levels was skewed towards the deficient end of the spectrum; (ii) mean 25(OH)D levels for both men and women were well within the insufficiency range; and (iii) a substantial proportion of 25(OH)D levels in men and women could be classified as deficient. Our findings mirrored those of studies from the United States(29,32,33) and Denmark,(34) where a high degree of vitamin D deficiency was seen among the populations studied. According to Hirani et al, women were more likely to be vitamin D deficient than men.(35) We likewise found that a greater proportion of women were vitamin D deficient and had significantly lower mean 25(OH)D levels when compared to men, despite twice the number of 25(OH)D tests being performed for women. Several studies have reported an association between vitamin D deficiency and elevated PTH levels in children from New Zealand,(36) adolescents from the United Kingdom and Gambia,(37) elderly women from Poland,(38) and hospital inpatients from Israel.(39) Our findings were in agreement with these reports, as we also found a negative association between PTH and 25(OH)D levels.
Demand for 25(OH)D testing saw considerable growth in our population from 2006 onwards. During this period, mean 25(OH)D levels also rose with each year, with 2010 showing the highest 25(OH)D levels during the ten-year study period. While this finding does not prove causation, our data shows that the greater number of vitamin D testing in our population was associated with rising mean vitamin D levels. However, it is also possible that with such increased demand for 25(OH)D testing, our results in fact reflect the true population mean of 25(OH)D with greater accuracy. There are significant health and economic benefits to be gained from improving the mean vitamin D levels of a population.(40-42) According to Grant et al, an estimated 50,000–63,000 people in the United States and 19,000–25,000 in the United Kingdom die prematurely due to cancer each year as a result of suboptimal vitamin D levels, and the economic burden of vitamin D deficiency in the United States was reported to be nearly USD 40–56 billion in 2004.(43)
Unlike vitamin D deficiency, vitamin D toxicity is extremely rare, and usually occurs as a result of inadvertent excessive consumption of nutritional supplements or medication. Vitamin D toxicity is characterised by raised circulatory calcium,(27) and studies have reported hypercalcaemia in patients with 25(OH)D levels exceeding 500 nmol/L.(44,45) While uncommon, these instances were attributed to the consumption of incorrectly formulated nutritional vitamin D supplements. Similarly, we found vitamin D toxicity to be rare in our population, with only 8 patients having 25(OH)D levels in excess of 200 nmol/L during the ten-year study period, and of these, only three showed hypercalcaemia. However, we were unable to draw any conclusive inferences related to this finding, as details of the medications or supplements taken by these patients and their clinical conditions were not recorded in the laboratory database.
Vitamin D deficiency is prevalent among elderly persons,(35,38,46) and is a contributing risk factor for diseases such as osteoporosis and osteomalacia, which are common among the elderly.(47) Vitamin D deficiency in geriatric populations is largely due to poor nutrition and limited exposure to sunlight.(48) Many elderly patients in elderly-care facilities also have limited mobility due to illness.(48) A study from the United States found that vitamin D deficiency, defined as serum 25(OH)D levels < 50 nmol/L, was more prevalent in individuals aged 98 years and over, than in those aged 80–89 years.(46) In the United Kingdom, a study found that among adults aged 65 years and over, 57% of women and 49% of men had serum 25(OH)D levels < 50 nmol/L.(35) Likewise, a Polish assessment of women in the age group of 60–90 years in the general population found that 83% had serum 25(OH)D levels < 50 nmol/L.(38) In our study, the link between vitamin D deficiency and age was supported by two sets of data. Firstly, the number of vitamin D tests being requested by medical practitioners increased with the age of patients for both men and women, suggesting that the medical practitioners recognised that vitamin D deficiency was a significant health problem in older individuals. Secondly, mean 25(OH)D levels were observed to fall with increasing patient age in both men and women.
Vitamin D deficiency is re-emerging as a serious paediatric health crisis in Australia and New Zealand.(49) The main contributing factors that have been reported include vitamin D-deficient breast-feeding mothers, dark skin pigmentation, poor nutrition, intestinal malabsorption and limited solar exposure.(49) Conversely, we found that the paediatric (age group 0–9 years) and adolescent (age group 10–19 years) patients in our study had the highest mean 25(OH)D levels. These results, however, should be interpreted with caution, as the mean 25(OH)D levels in these two patient groups, although considered sufficient, were in the vicinity of the insufficiency spectrum.
Surprisingly, the mean 25(OH)D levels among patients in the age group 20–29 years were lower than those in some of the patients in older age groups in our study. Although the reason for this finding is unclear, lifestyle was likely a contributing factor. The demands of a nascent career and the pressures of starting a family, which were mostly associated with individuals in this age group, would not only impact personal nutrition but also restrict time for outdoor recreational activities, and thereby limit sun exposure. The ramifications of this finding may be multifarious, as studies have found that pregnant and breast-feeding mothers belonging to this age group could confer vitamin D deficiency to their children,(49) and that vitamin D deficiency earlier in life may lay the foundations for future health problems.(41)
While vitamin D can be obtained from dietary sources, it is primarily synthesised in the skin as an outcome of ultraviolet light exposure.(2,50) Therefore, 25(OH)D levels in individuals might be influenced by factors such as geography and the climate of a region. Higher latitudes receive sunlight at a lesser intensity compared to equatorial regions, and have greater seasonal variations with respect to daylight hours in the summer and winter. Also, in colder climates, less skin surface area is exposed to sunlight.(51) A study from Southeastern Australia (latitude 38–39º South) found that serum 25(OH)D levels peaked in late summer and were lowest in late winter among women aged 55 years and over.(52) Similarly, a Norwegian study (latitude 69º North) that assessed vitamin D status showed that people had significantly higher mean 25(OH)D levels in late summer.(53) Seasonal vitamin D variations have even been detected in populations inhabiting warmer climates such as Brazil(54) and Israel.(55) New South Wales, Australia, has a temperate climate and the study population is located approximately 34º South of the equator. We found that our population experienced seasonal variations in mean 25(OH)D levels, with the highest readings observed in late summer and the lowest levels seen in early spring. Mean 25(OH)D levels observed over several years showed an evident and cyclical seasonal pattern in our population.
Our study was not without limitations. Due to its retro- spective nature, we could only observe associations but not establish causal relationships between variables. While serum was the preferred sample for analysis at the laboratory studied, lithium heparin plasma was also accepted infrequently when serum was unavailable. Patient information such as medical condition, ethnicity (as a guide to skin pigmentation), and medications or supplements being consumed were not contained in the database analysed. To minimise repeat 25(OH)D measurements for individuals, mean 25(OH)D values were calculated for each year and the data analysis was restricted, in certain cases, to the year 2010.
To the best of our knowledge, this is the first study to report the 25(OH)D status and prevalence of vitamin D deficiency of patients from New South Wales, Australia. The demand for 25(OH)D testing dramatically increased over the years from 2001 to 2010, similar to that reported in other studies. Vitamin D deficiency was associated with elevated PTH levels, and vitamin D toxicity was rare in our population, the latter was observed only once during the ten-year study period. 25(OH)D levels decreased with age and varied with season, with the highest levels observed in late summer and the lowest levels observed in early spring.
As the health and economic burden of vitamin D deficiency is high, the potential benefits of improving a population’s vitamin D status would be substantial. Further studies to determine subpopulations that are mostly affected by vitamin D deficiency are warranted. This will allow for the improved, efficient and targeted delivery of limited healthcare resources and services.
ACKNOWLEDGEMENTS
This work was carried out with the permission of Hunter Area Pathology Service, Hunter New England Local Health District, New South Wales, Australia. The authors are highly appreciative of the biochemical analysis performed by the staff at the Department of Clinical Chemistry, Hunter Area Pathology Service, John Hunter Hospital, New South Wales.
REFERENCES
- 1.Holick MF. High prevalence of vitamin D inadequacy and implications for health. Mayo Clin Proc. 2006;81:353–73. doi: 10.4065/81.3.353. [DOI] [PubMed] [Google Scholar]
- 2.Stroud ML, Stilgoe S, Stott VE, Alhabian O, Salman K. Vitamin D - a review. Aust Fam Physician. 2008;37:1002–5. [PubMed] [Google Scholar]
- 3.Chen TC, Chimeh F, Lu Z, et al. Factors that influence the cutaneous synthesis and dietary sources of vitamin D. Arch Biochem Biophys. 2007;460:213–7. doi: 10.1016/j.abb.2006.12.017. [DOI] [PMC free article] [PubMed] [Google Scholar]
- 4.Omdahl JL, Morris HA, May BK. Hydroxylase enzymes of the vitamin D pathway: expression, function, and regulation. Annu Rev Nutr. 2002;22:139–66. doi: 10.1146/annurev.nutr.22.120501.150216. [DOI] [PubMed] [Google Scholar]
- 5.Prosser DE, Jones G. Enzymes involved in the activation and inactivation of vitamin D. Trends Biochem Sci. 2004;29:664–73. doi: 10.1016/j.tibs.2004.10.005. [DOI] [PubMed] [Google Scholar]
- 6.Holick MF. Vitamin D deficiency. N Engl J Med. 2007;357:266–81. doi: 10.1056/NEJMra070553. [DOI] [PubMed] [Google Scholar]
- 7.Zerwekh JE. Blood biomarkers of vitamin D status. Am J Clin Nutr. 2008;87:1087S–91S. doi: 10.1093/ajcn/87.4.1087S. [DOI] [PubMed] [Google Scholar]
- 8.Shroff R, Knott C, Rees L. The virtues of vitamin D - but how much is too much? Pediatr Nephrol. 2010;25:1607–20. doi: 10.1007/s00467-010-1499-9. [DOI] [PubMed] [Google Scholar]
- 9.Holick MF, Binkley NC, Bischoff-Ferrari HA, et al. Evaluation, treatment, and prevention of vitamin D deficiency: an Endocrine Society clinical practice guideline. J Clin Endocrinol Metab. 2011;96:1911–30. doi: 10.1210/jc.2011-0385. [DOI] [PubMed] [Google Scholar]
- 10.Working Group of the Australian and New Zealand Bone and Mineral Society. Vitamin D and adult bone health in Australia and New Zealand: a position statement. Med J Aust. 2005;182:281–5. doi: 10.5694/j.1326-5377.2005.tb06701.x. [DOI] [PubMed] [Google Scholar]
- 11.Hekimsoy Z, Dinç G, Kafesçiler S, et al. Vitamin D status among adults in the Aegean region of Turkey. BMC Public Health. 2010;10:782. doi: 10.1186/1471-2458-10-782. [DOI] [PMC free article] [PubMed] [Google Scholar]
- 12.Kuchuk NO, Pluijm SM, van Schoor NM, et al. Relationships of serum 25-hydroxyvitamin D to bone mineral density and serum parathyroid hormone and markers of bone turnover in older persons. J Clin Endocrinol Metab. 2009;94:1244–50. doi: 10.1210/jc.2008-1832. [DOI] [PubMed] [Google Scholar]
- 13.Billoo AG, Murtaza G, Memon MA, et al. Comparison of oral versus injectable vitamin-D for the treatment of nutritional vitamin D deficiency rickets. J Coll Physicians Surg Pak. 2009;19:428–31. [PubMed] [Google Scholar]
- 14.Lips P, van Schoor NM. The effect of vitamin D on bone and osteoporosis. Best Pract Res Clin Endocrinol Metab. 2011;25:585–91. doi: 10.1016/j.beem.2011.05.002. [DOI] [PubMed] [Google Scholar]
- 15.Kendrick J, Targher G, Smits G, Chonchol M. 25-Hydroxyvitamin D deficiency is independently associated with cardiovascular disease in the Third National Health and Nutrition Examination Survey. Atherosclerosis. 2009;205:255–60. doi: 10.1016/j.atherosclerosis.2008.10.033. [DOI] [PubMed] [Google Scholar]
- 16.Williams S, Malatesta K, Norris K. Vitamin D and chronic kidney disease. Ethn Dis. 2009;19 S5-8-11. [PMC free article] [PubMed] [Google Scholar]
- 17.Penckofer S, Kouba J, Wallis DE, Emanuele MA. Vitamin D and diabetes: let the sunshine in. Diabetes Educ. 2008;34:939–40. doi: 10.1177/0145721708326764. [DOI] [PMC free article] [PubMed] [Google Scholar]
- 18.Raghuwanshi A, Joshi SS, Christakos S. Vitamin D and multiple sclerosis. J Cell Biochem. 2008;105:338–43. doi: 10.1002/jcb.21858. [DOI] [PMC free article] [PubMed] [Google Scholar]
- 19.Lane NE. Vitamin D and systemic lupus erythematosus: bones, muscles, and joints. Curr Rheumatol Rep. 2010;12:259–63. doi: 10.1007/s11926-010-0106-1. [DOI] [PMC free article] [PubMed] [Google Scholar]
- 20.Rovner AJ, Stallings VA, Schall JI, Leonard MB, Zemel BS. Vitamin D insufficiency in children, adolescents, and young adults with cystic fibrosis despite routine oral supplementation. Am J Clin Nutr. 2007;86:1694–9. doi: 10.1093/ajcn/86.5.1694. [DOI] [PubMed] [Google Scholar]
- 21.Jenab M, Bueno-de-Mesquita HB, Ferrari P, et al. Association between pre-diagnostic circulating vitamin D concentration and risk of colorectal cancer in European populations: a nested case-control study. BMJ. 2010;340:b5500. doi: 10.1136/bmj.b5500. [DOI] [PMC free article] [PubMed] [Google Scholar]
- 22.Engel P, Fagherazzi G, Boutten A, et al. Serum 25(OH) vitamin D and risk of breast cancer: a nested case-control study from the French E3N cohort. Cancer Epidemiol Biomarkers Prev. 2010;19:2341–50. doi: 10.1158/1055-9965.EPI-10-0264. [DOI] [PubMed] [Google Scholar]
- 23.Choo CS, Mamedov A, Chung M, et al. Vitamin D insufficiency is common in patients with nonmetastatic prostate cancer. Nutr Res. 2011;31:21–6. doi: 10.1016/j.nutres.2010.12.007. [DOI] [PubMed] [Google Scholar]
- 24.Heaney RP. Vitamin D: criteria for safety and efficacy. Nutr Rev. 2008;66:S178–81. doi: 10.1111/j.1753-4887.2008.00102.x. [DOI] [PubMed] [Google Scholar]
- 25.Nowson CA, McGrath JJ, Ebeling PR, et al. Vitamin D and health in adults in Australia and New Zealand: a position statement. Med J Aust. 2012;196:686–7. doi: 10.5694/mja11.10301. [DOI] [PubMed] [Google Scholar]
- 26.Hathcock JN, Shao A, Vieth R, Heaney R. Risk assessment for vitamin D. Am J Clin Nutr. 2007;85:6–18. doi: 10.1093/ajcn/85.1.6. [DOI] [PubMed] [Google Scholar]
- 27.Vieth R. Vitamin D and cancer mini-symposium: the risk of additional vitamin D. Ann Epidemiol. 2009;19:441–5. doi: 10.1016/j.annepidem.2009.01.009. [DOI] [PubMed] [Google Scholar]
- 28.Vieth R. Critique of the considerations for establishing the tolerable upper intake level for vitamin D: critical need for revision upwards. J Nutr. 2006;136:1117–22. doi: 10.1093/jn/136.4.1117. [DOI] [PubMed] [Google Scholar]
- 29.French D, Gorgi AW, Ihenetu KU, et al. Vitamin D status of county hospital patients assessed by the DiaSorin LIAISON®25-hydroxyvitamin D assay. Clin Chim Acta. 2011;412:258–62. doi: 10.1016/j.cca.2010.10.013. [DOI] [PubMed] [Google Scholar]
- 30.Bilinski K, Boyages S. The rise and rise of vitamin D testing. BMJ. 2012;345:e4743. doi: 10.1136/bmj.e4743. [DOI] [PubMed] [Google Scholar]
- 31.Sattar N, Welsh P, Panarelli M, Forouhi NG. Increasing requests for vitamin D measurement: costly, confusing, and without credibility. Lancet. 2012;379:95–6. doi: 10.1016/S0140-6736(11)61816-3. [DOI] [PubMed] [Google Scholar]
- 32.Kuriacose R, Olive KE. Prevalence of vitamin D deficiency and insufficiency in northeast Tennessee. South Med J. 2008;101:906–9. doi: 10.1097/SMJ.0b013e318181881b. [DOI] [PubMed] [Google Scholar]
- 33.Anderson JL, May HT, Horne BD, et al. Relation of vitamin D deficiency to cardiovascular risk factors, disease status, and incident events in a general healthcare population. Am J Cardiol. 2010;106:963–8. doi: 10.1016/j.amjcard.2010.05.027. [DOI] [PubMed] [Google Scholar]
- 34.Bang UC, Semb S, Nordgaard-Lassen I, Jensen JE. A descriptive cross-sectional study of the prevalence of 25-hydroxyvitamin D deficiency and association with bone markers in a hospitalized population. Nutr Res. 2009;29:671–5. doi: 10.1016/j.nutres.2009.09.010. [DOI] [PubMed] [Google Scholar]
- 35.Hirani V, Tull K, Ali A, Mindell J. Urgent action needed to improve vitamin D status among older people in England! Age Ageing. 2010;39:62–8. doi: 10.1093/ageing/afp195. [DOI] [PubMed] [Google Scholar]
- 36.Houghton LA, Szymlek-Gay EA, Gray AR, et al. Predictors of vitamin D status and its association with parathyroid hormone in young New Zealand children. Am J Clin Nutr. 2010;92:69–76. doi: 10.3945/ajcn.2009.29055. [DOI] [PubMed] [Google Scholar]
- 37.Schoenmakers I, Ginty F, Jarjou LM, et al. Interrelation of parathyroid hormone and vitamin D metabolites in adolescents from the UK and The Gambia. J Steroid Biochem Mol Biol. 2010;121:217–20. doi: 10.1016/j.jsbmb.2010.03.012. [DOI] [PubMed] [Google Scholar]
- 38.Napiórkowska L, Budlewski T, Jakubas-Kwiatkowska W, et al. Prevalence of low serum vitamin D concentration in an urban population of elderly women in Poland. Pol Arch Med Wewn. 2009;119:699–703. [PubMed] [Google Scholar]
- 39.Hochwald O, Harman-Boehm I, Castel H. Hypovitaminosis D among inpatients in a sunny country. Isr Med Assoc J. 2004;6:82–7. [PubMed] [Google Scholar]
- 40.Grant WB, Cross HS, Garland CF, et al. Estimated benefit of increased vitamin D status in reducing the economic burden of disease in western Europe. Prog Biophys Mol Biol. 2009;99:104–13. doi: 10.1016/j.pbiomolbio.2009.02.003. [DOI] [PubMed] [Google Scholar]
- 41.Grant WB, Schwalfenberg GK, Genuis SJ, Whiting SJ. An estimate of the economic burden and premature deaths due to vitamin D deficiency in Canada. Mol Nutr Food Res. 2010;54:1172–81. doi: 10.1002/mnfr.200900420. [DOI] [PubMed] [Google Scholar]
- 42.Grant WB, Schuitemaker GE. Health benefits of higher serum 25-hydroxyvitamin D levels in The Netherlands. J Steroid Biochem Mol Biol. 2010;121:456–8. doi: 10.1016/j.jsbmb.2010.03.089. [DOI] [PubMed] [Google Scholar]
- 43.Grant WB, Garland CF, Holick MF. Comparisons of estimated economic burdens due to insufficient solar ultraviolet irradiance and vitamin D and excess solar UV irradiance for the United States. Photochem Photobiol. 2005;81:1276–86. doi: 10.1562/2005-01-24-RA-424. [DOI] [PubMed] [Google Scholar]
- 44.Kaptein S, Risselada AJ, Boerma EC, Egbers PH, Nieboer P. Life-threatening complications of vitamin D intoxication due to over-the-counter supplements. Clin Toxicol (Phila) 2010;48:460–2. doi: 10.3109/15563650.2010.486382. [DOI] [PubMed] [Google Scholar]
- 45.Klontz KC, Acheson DW. Dietary supplement-induced vitamin D intoxication. N Engl J Med. 2007;357:308–9. doi: 10.1056/NEJMc063341. [DOI] [PubMed] [Google Scholar]
- 46.Johnson MA, Davey A, Park S, Hausman DB, Poon LW. Georgia Centenarian Study. Age, race and season predict vitamin D status in African American and white octogenarians and centenarians. J Nutr Health Aging. 2008;12:690–5. doi: 10.1007/BF03028616. [DOI] [PMC free article] [PubMed] [Google Scholar]
- 47.Lanske B, Razzaque MS. Vitamin D and aging: old concepts and new insights. J Nutr Biochem. 2007;18:771–7. doi: 10.1016/j.jnutbio.2007.02.002. [DOI] [PMC free article] [PubMed] [Google Scholar]
- 48.Bruyere O, Decock C, Delhez M, Collette J, Reginster JY. Highest prevalence of vitamin D inadequacy in institutionalized women compared with noninstitutionalized women: a case-control study. Womens Health (Lond Engl) 2009;5:49–54. doi: 10.2217/17455057.5.1.49. [DOI] [PubMed] [Google Scholar]
- 49.Munns C, Zacharin MR, Rodda CP, et al. Prevention and treatment of infant and childhood vitamin D deficiency in Australia and New Zealand: a consensus statement. Med J Aust. 2006;185:268–72. doi: 10.5694/j.1326-5377.2006.tb00558.x. [DOI] [PubMed] [Google Scholar]
- 50.Wolpowitz D, Gilchrest BA. The vitamin D questions: how much do you need and how should you get it? J Am Acad Dermatol. 2006;54:301–17. doi: 10.1016/j.jaad.2005.11.1057. [DOI] [PubMed] [Google Scholar]
- 51.Huotari A, Herzig KH. Vitamin D and living in northern latitudes--an endemic risk area for vitamin D deficiency. Int J Circumpolar Health. 2008;67:164–78. doi: 10.3402/ijch.v67i2-3.18258. [DOI] [PubMed] [Google Scholar]
- 52.Pasco JA, Henry MJ, Kotowicz MA, et al. Seasonal periodicity of serum vitamin D and parathyroid hormone, bone resorption, and fractures: the Geelong Osteoporosis Study. J Bone Miner Res. 2004;19:752–8. doi: 10.1359/JBMR.040125. [DOI] [PubMed] [Google Scholar]
- 53.Brustad M, Edvardsen K, Wilsgaard T, et al. Seasonality of UV-radiation and vitamin D status at 69 degrees north. Photochem Photobiol Sci. 2007;6:903–8. doi: 10.1039/b702947k. [DOI] [PubMed] [Google Scholar]
- 54.Maeda SS, Kunii IS, Hayashi LF, Lazaretti-Castro M. Increases in summer serum 25-hydroxyvitamin D (25OHD) concentrations in elderly subjects in São Paulo, Brazil vary with age, gender and ethnicity. BMC Endocr Disord. 2010;10:12. doi: 10.1186/1472-6823-10-12. [DOI] [PMC free article] [PubMed] [Google Scholar]
- 55.Saliba W, Rennert HS, Kershenbaum A, Rennert G. Serum 25(OH)D concentrations in sunny Israel. Osteoporos Int. 2012;23:687–94. doi: 10.1007/s00198-011-1597-y. [DOI] [PubMed] [Google Scholar]