

Abstract
In Mekong Delta farms (Vietnam), antimicrobials are extensively used, but limited data are available on levels of antimicrobial resistance (AMR) among Escherichia coli isolates. We performed a structured survey of AMR in E. coli isolates (n = 434) from 90 pig, chicken, and duck farms. The results were compared with AMR among E. coli isolates (n = 234) from 66 small wild animals (rats and shrews) trapped on farms and in forests and rice fields. The isolates were susceptibility tested against eight antimicrobials. E. coli isolates from farmed animals were resistant to a median of 4 (interquartile range [IQR], 3 to 6) antimicrobials versus 1 (IQR, 1 to 2) among wild mammal isolates (P < 0.001). The prevalences of AMR among farmed species isolates (versus wild animals) were as follows: tetracycline, 84.7% (versus 25.6%); ampicillin, 78.9% (versus 85.9%); trimethoprim-sulfamethoxazole, 52.1% (versus 18.8%); chloramphenicol, 39.9% (versus 22.5%); amoxicillin-clavulanic acid, 36.6% (versus 34.5%); and ciprofloxacin, 24.9% (versus 7.3%). The prevalence of multidrug resistance (MDR) (resistance against three or more antimicrobial classes) among pig isolates was 86.7% compared to 66.9 to 72.7% among poultry isolates. After adjusting for host species, MDR was ∼8 times greater among isolates from wild mammals trapped on farms than among those trapped in forests/rice fields (P < 0.001). Isolates were assigned to unique profiles representing their combinations of susceptibility results. Multivariable analysis of variance indicated that AMR profiles from wild mammals trapped on farms and those from domestic animals were more alike (R2 range, 0.14 to 0.30) than E. coli isolates from domestic animals and mammals trapped in the wild (R2 range, 0.25 to 0.45). The results strongly suggest that AMR on farms is a key driver of environmental AMR in the Mekong Delta.
INTRODUCTION
Bacterial resistance to antimicrobial agents now ranks as one of the most important global health concerns (1), particularly since the development of new antimicrobials has stalled over recent years (2). Antimicrobials are extensively used in food animal production to prevent and treat animal diseases, as well as to promote growth (3). Antimicrobials used in animal farming and human medicine are largely similar (4). In Vietnam, extensive use of antimicrobials in farming has been documented, including compounds considered to be critical for human medicine, such as fluoroquinolones, macrolides, and aminoglycosides (5, 6). As a result, high levels of antimicrobial resistance (AMR) in zoonotic bacteria, such as nontyphoid Salmonella and Campylobacter spp., have been reported both on farms and in meat products (7–9).
The use of antimicrobials on farms raising domestic animals for food is suspected to play an important role in generating/disseminating AMR organisms (organisms that demonstrate AMR) and determinants through environmental pathways (10). Humans may become infected with AMR bacteria through occupational exposure and ingestion of contaminated food and water (11). In addition, antimicrobials used on farms have been reported to increase AMR in organisms isolated from areas exposed to farm waste (12), as well as in the flora of wildlife trapped in their proximity (13, 14).
Escherichia coli organisms are generally commensal bacteria of warm-blooded animals. They are often used as indicators for the presence of AMR in monitoring and surveillance programs, given the availability of simple and efficient isolation procedures (15, 16).
To date, no studies have investigated the prevalence of AMR in E. coli strains isolated from the most common farmed and wildlife species in the Mekong Delta of Vietnam. The Mekong Delta is a region criss-crossed by a maze of canals and rivers, with rice as the predominant agricultural crop. In addition, the area has a high density of poultry and pigs farmed under conditions of low biosecurity and biocontainment. We performed a survey of AMR in commensal E. coli isolates from the three most commonly farmed species (chickens, ducks, and pigs) and small wild mammals trapped in the same district. The aims were (i) to describe AMR phenotypic profiles, (ii) to investigate risk factors for AMR (farms), and (iii) to investigate the level of similarity between profiles of E. coli from farmed animals and wildlife.
MATERIALS AND METHODS
Farm survey design.
The survey was conducted between February and May 2012 in the district of Cao Lanh (population, 193,184), located in Dong Thap Province. In the district of Cao Lanh, the median farm sizes (number of animals) are 22 (interquartile range [IQR], 16 to 45), 57 (IQR, 40 to 200), and 4 (IQR, 3 to 8) for chicken, duck, and pig farms, respectively (data provided by the Sub-Department of Animal Health in Dong Thap {lsqb]SDAH-DT]). The selected study area is representative of the Mekong Delta of Vietnam. The area has a tropical monsoon climate, with temperatures ranging from 25 to 28°C with slight annual variations, and a rainy season from May to October.
We aimed to investigate ∼450 E. coli isolates from 90 randomly selected farms for the three main farmed species (pigs, ducks, and chickens; 30 each, i.e., 5 colonies per farm). The purpose was to estimate the probability of a randomly selected E. coli colony being resistant to a panel of antimicrobials, as well as being multiresistant. This sample size, based on a cluster study design, would theoretically allow the estimation of an AMR prevalence of 25%, with a relative error of 20% and 80% confidence, assuming a design effect of 4 (i.e., a medium level of farm level clustering) (17). Farms were classified by size (small, medium, and large; total, 9 strata) to maximize the chance of capturing differences between production systems. The cutoffs for animal numbers that determined farm size were as follows: for chickens, 20 to 50 (small), 51 to 100 (medium), and >100 (large); for ducks, 50 to 200 (small), 201 to 1,000 (medium), and >1,000 (large); and for pigs, 5 to 20 (small), 21 to 50 (medium), and >50 (large).
Farm sampling and data collection.
From each farm, naturally pooled feces were collected from the area housing the target species using one pair of boot swabs. These were used to walk for at least 30 steps on areas where fresh droppings were visible. When it was not practicable to use boot swabs (i.e., farrowing crates or chicken houses built on stilts), visible fresh fecal material from at least 10 different points was collected using hand gauze swabs. Immediately after collection, the swab samples were placed in individually sealed containers and transferred to the laboratory at 4°C. Data on farm management practices, experience of disease in the flocks/herds, and other variables were collected using structured questionnaires aimed at the person with primary responsibility for animal husbandry. The questionnaire also enquired about any antimicrobial formulation used over the previous 90 days on the target species (see the supplemental material). Both interviews and fecal sample collection were conducted by trained veterinarians from the SDAH-DT.
Trapping and processing of small wild mammals.
Small wild mammals (rats and shrews) were trapped in different locations (pig and poultry farms, forests, and the perimeters of rice fields) in Cao Lanh District during March 2013 using live-cage metal “tomahawk” traps (∼0.04 cubic meters in volume each). A total of 30 lines (one per location) of 10 traps were set up, checked for animals trapped, and reset over 10 subsequent days (totaling 3,000 trap-days). Traps with a caught animal were collected and replaced by a new trap. The animals were humanely culled by overdose of an inhalant anesthetic (isoflurane) following American Veterinary Medical Association (AVMA) guidelines (18). After measuring the main biological and morphometric parameters, ∼0.2 g of cecal contents extracted from each animal was mixed with 0.5 ml glycerol and transferred to the laboratory at 4°C. Species identification was carried out by examination of morphological characteristics following existing guidelines (19). Species identification was confirmed for a representative number of mammals (n = 22) by amplification of a conserved housekeeping gene (cytochrome oxidase I [COI]) using PCR followed by molecular sequencing of the product and blasting using the RatSEA barcoding tool (http://www.ceropath.org/barcoding_tool/rodentsea).
Laboratory processing of samples.
All samples were processed in the laboratory within 24 h of collection. A fixed volume of saline solution (100 ml) was added to each swab sample and was then manually shaken. Swab samples (100 μl of the mixture described above) and small wild fecal samples (100 μg of fecal material) were further diluted 1:1,000 in saline solution, and 50 μl of this suspension was plated onto MacConkey agar and incubated at 37°C overnight. From each sample, up to five colonies showing typical E. coli morphology were confirmed using standard biochemical tests (motility, indole, lactose/glucose fermentation, methyl red, citrate, urease, hydrogen sulfide, and gas production).
Antimicrobial resistance of E. coli isolates was determined by the disk diffusion method using the procedure of the Clinical and Laboratory Standards Institute (CLSI) (20). The following antimicrobials were used at the concentrations shown: amoxicillin-clavulanic acid (30 μg), ceftazidime (30 μg), ampicillin (10 μg), chloramphenicol (30 μg), tetracycline (30 μg), trimethoprim-sulfamethoxazole (1.25/23.75 μg), gentamicin (10 μg), and ciprofloxacin (5 μg). Isolates were classified as susceptible, intermediate, or resistant according to interpretation of the zone diameter as recommended by CLSI. Potential production of extended-spectrum beta-lactamase (ESBL), as indicated by resistance to ceftazidime and by an inhibitory effect of clavulanic acid, was confirmed using a double disk diffusion test. A reference E. coli strain (ATCC 25922) was used to verify the quality and accuracy of the testing procedures. Colonies that were intermediate-resistant based on the measured zone were also regarded as resistant. A multidrug-resistant (MDR) strain was defined as a strain resistant to at least three different classes of antimicrobials.
Statistical analyses.
We aimed to model the overall probability of one E. coli colony from a given farm or from a small wild mammal being AMR. The farm E. coli data were adjusted for the sampling frame by assigning a stratum-specific sampling weight (Wi) to each observation unit (i.e., an isolate obtained from a farm) using the following equation: , where NT is the total number of pig and poultry farms in Cao Lanh (35,248) and Ni is the total number of farms of each stratum sampled (i = 1…9). This adjustment gives more weight to isolates from more common farm types (i.e., small chicken farms). Standard errors were corrected to take into account potential similarities of usage between farms in each stratum (21). Survey prevalence calculations were carried out using R software (http://www.r-project.org) with the package “survey.”
The potential statistical association between resistances against any combination of two antimicrobials of eight tested (number of comparisons, 28) was investigated using Pearson's correlation test and was visualized using a correlogram built with the R package “corrgram.”
Potential factors associated with MDR were investigated by hierarchical logistical regression, taking into account the survey sampling frame, with “farm” as the clustering variable, using the R package “lmer.” The variables investigated were main farmed species, farm size, farmer demographics, recent use of antimicrobials (90 days), and type of water and feed. For E. coli isolates from small mammals, generalized estimating equation (GEE) models were used to calculate the adjusted prevalence of AMR for isolates from animals trapped on farms versus those from animals trapped in forests and rice fields. The species and site of collection (trapped on farms versus trapped at other sites) were modeled as independent variables, and the animal identity was taken as the clustering variable. Model building was carried out in a step-forward fashion from univariable models, and variables were deemed significant if their P values were <0.05 (22). Interaction between main significant variables was tested.
Each isolate was characterized by a profile defined by its unique combination of susceptibility/resistance to the 8 antimicrobials tested. The Shannon-Weaver entropy (H) was used to estimate the diversity of the AMR profiles (i.e., the combination of susceptibilities) observed among isolates from each farmed species (chickens, ducks, and pigs), as well as among isolates from each farm separately. H was defined as follows: , where pi is the proportion of isolates with the ith resistance profile and R is the total number of profiles. Higher values of H correspond to greater diversity in AMR profiles.
A minimum spanning tree was plotted to visualize the relationships between the most common AMR profiles using the “adegenet” package in R.
Permutational nonparametric multivariate analysis of variance of profiles using distance matrices (23) was carried out to investigate the fraction of the total variation in AMR profiles among E. coli isolates attributable to the host type (pig/chicken/duck/wild mammal trapped on a farm/wild mammal trapped at a nonfarm site). The variability of profiles attributed to the farm was calculated separately for each farmed species. In addition, the relative similarity between profiles of isolates from small wild mammals trapped on farms and at nonfarm sites compared with profiles of isolates from farmed species (chickens, ducks, and pigs) was assessed by analysis of variance. This was performed by fitting two separate models with isolates from each of the three target species: one including data from isolates from farmed species and small wild mammals trapped on farms and another one including isolates from farmed species and small wild mammals trapped on nonfarm sites. The variability was tested by fitting the variable “species” (farmed animal/small wild mammal). Analyses were carried out using the R package “vegan.”
Discriminant analysis of principal components (DAPC) (24) was used to investigate overall differences between AMR profiles in E. coli isolates from different sources. Because of the small number of variables compared to the number of observations, no information was discarded in the prior-dimension reduction step. This analysis was carried out using the “adegenet” R package, and the results were visualized using the “ggplot2” R package.
RESULTS
E. coli isolates.
A total of 668 E. coli isolates were recovered and characterized, 434 from 90 domestic animals (148, 143, and 143 from chicken, duck, and pig farms, respectively) and 234 from 66 small wild mammals (59 rats [19 Rattus tanezumi, 16 Bandicota indica, 10 Rattus norvegicus, 9 Rattus argentiventer, and 5 Rattus exulans] and 7 Suncus murinus shrews).
AMR in E. coli isolates from farms and small wild mammals.
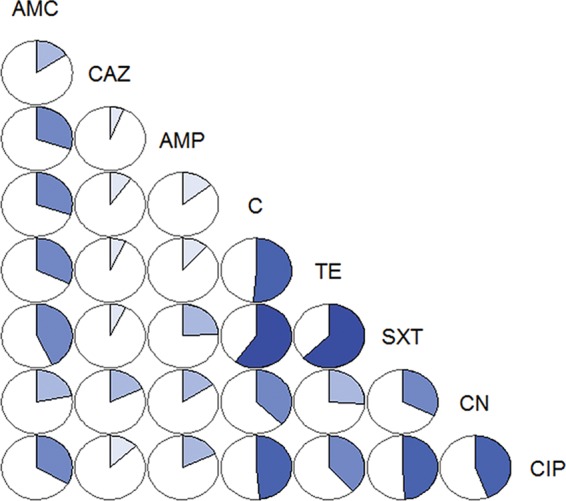
E. coli isolates recovered from farmed animals (n = 434) were resistant to a median of 4 (75% IQR, 3 to 6) antimicrobials. The crude (unadjusted) and survey-adjusted prevalences of resistance to each type of antimicrobial by farmed species are presented in Fig. 1. Overall, the highest adjusted prevalence of resistance was to tetracycline (84.7%), followed by ampicillin (78.9%), trimethoprim-sulfamethoxazole (52.1%), chloramphenicol (39.9%), amoxicillin-clavulanic acid (36.6%), and ciprofloxacin (24.9%). The overall survey-adjusted prevalence of MDR was 62.2% (95% confidence interval [CI], 58.0 to 66.4%) (66.9% [95% CI, 59.3 to 74.5%], 72.7% [95% CI, 65.4 to 80.0%], and 86.7% [95% CI, 81.1 to 92.3%] for chicken, duck, and pig isolates, respectively). Isolates from pigs had a statistically higher prevalence of MDR than both chicken and duck isolates (P < 0.001).
FIG 1.

Prevalence of AMR, ESBL production, and MDR among 434 E. coli isolates recovered from 90 farms in Dong Thap, Vietnam (2012). Gray bars, unadjusted data; white bars, survey-adjusted data. The error bars indicate 95% confidence intervals. AMC, amoxicillin-clavulanic acid; CAZ, ceftazidime; AMP, ampicillin; C, chloramphenicol; TE, tetracycline; SXT, trimethoprim-sulfamethoxazole; CN, gentamicin; CIP, ciprofloxacin.
The overall level of gentamicin resistance was 7.6% (95% CI, 3.3 to 12.0%), and the levels were significantly higher for pig (38.1% [95% CI, 24.6 to 51.7%]) than for chicken (10.8% [95% CI, 4.1 to 17.4%]) and duck (5.5% [95% CI, 0.0 to 11.5%] (P < 0.001) isolates.
The overall levels of ciprofloxacin resistance were 24.9% (95% CI, 19.0 to 30.7%), with the highest levels corresponding to pig isolates (41.4% [95% CI, 27.4 to 55.5%]), followed by duck (25.7% [95% CI, 17.3 to 34.1%]) and chicken (21.0% [95% CI, 14.1 to 28.1%]) isolates. Pig isolates had a borderline statistically higher prevalence of ciprofloxacin resistance than chicken isolates (P = 0.062), but not duck isolates.
The farm-adjusted prevalence of ceftazidime resistance was 0.8% (95% CI, 0.3 to 1.4%) and ranged between 0.05% (pigs) and 2.2% (chickens). A total of 11 isolates (from 3 chickens, 2 ducks, and 1 pig) were resistant to ceftazidime. These isolates were virtually panresistant (resistant to a median of 7.5 antimicrobials [IQR, 7 to 8]). Three of 11 ceftazidime-resistant isolates (all recovered from the duck farms) were also ESBL positive.
Isolates recovered from small wild mammals (n = 234) were resistant to a median of 1 antimicrobial (IQR, 1 to 2), significantly lower than the equivalent figure for isolates from farms (median, 4 [IQR, 3 to 6]) (Kruskal-Wallis test, 180.3; P < 0.001). The adjusted prevalence of resistance against each antimicrobial for E. coli isolates stratified by trapping location is presented in Table 1. Individual results for each small-mammal species are presented in Fig. 2. Overall, the highest levels of resistance were to ampicillin (85.9%, 60% of which were intermediate), followed by tetracycline (34.5%), amoxicillin-clavulanic acid (34.5%), and chloramphenicol (22.5%). Resistance to all other antimicrobials was <8%. After adjusting for species, the risk ratio (RR) for MDR among small mammals from farms compared with small mammals from other locations was 7.6 (95% CI, 4.6 to 10.6). Small mammals trapped on farms had a significantly higher probability of resistance to trimethoprim-sulfamethoxazole (RR, 13.8) and chloramphenicol (odds ratio [OR], 6.0) and (borderline significant; P = 0.062) increased resistance to ciprofloxacin (RR, 10.2) and amoxicillin-clavulanic acid (RR, 2.0) compared to those trapped at other sites. E. coli isolates from small wild mammals trapped in rice fields and forests were fully susceptible to gentamicin. Only one isolate (an ESBL producer) from a B. indica rat trapped in a rice field tested positive for ceftazidime. The prevalence of MDR was greatest among S. murinus (64.3% [95% CI, 46.2 to 82.4%]), followed by R. norvegicus (32.1% [95% CI, 14.5% to 49.8%]), R. exulans (31.3% [95% CI, 8.1 to 54.4%]), B. indica (14.9% [95% CI, 6.2 to 23.6%]), R. tanezumi (11.3% [95% CI, 3.3 to 19.3%]), and R. argentiventer (3.0% [95% CI, 0 to 9.0%]). Isolates from S. murinus shrews trapped on farms had the highest prevalence of MDR (89.5% [95% CI, 75.7 to 100.0%]).
TABLE 1.
Adjusted prevalences of antimicrobial resistance in E. coli isolates (n = 234) from small wild mammals by type of trapping site (Dong Thap, Vietnam, 2013)
| Antimicrobial | Prevalence (%) of antimicrobial-resistant E. coli in small mammals |
RR (95% CI) | ||
|---|---|---|---|---|
| All (n = 234) | Trapped on farms (n = 145) | Trapped at other sitesa (n = 89) | ||
| Amoxicillin-clavulanic acid | 34.5 (25.7–46.3) | 43.6 (30.5–62.1) | 21.9 (12.7–37.7) | 2.0 (0.9–3.1) |
| Ceftazidime | <1 (NCb) | 0 (NC) | <1 (NC) | NC |
| Ampicillin | 85.9 (79.6–91.9) | 87.6 (76.8–100.0) | 83.0 (67.1–100.0) | 1.1 (0.6–1.5) |
| Chloramphenicol | 22.5 (16.2–31.3) | 35.5 (24.5–51.5) | 5.9 (2.4–14.7) | 6.0 (3.3–8.7) |
| Tetracycline | 34.5 (25.7–42.3) | 42.1 (29.5–60.2) | 23.6 (13.8–40.2) | 1.8 (0.6–3.0) |
| Trimethoprim-sulfamethoxazole | 18.8 (13.2–26.7) | 31.8 (21.9–46.2) | 2.3 (0.5–9.4) | 13.8 (5.5–22.1) |
| Gentamicin | 3.1 (1.4–6.5) | 5.1 (2.3–10.8) | 0 (NC) | NC |
| Ciprofloxacin | 7.3 (4.4–12.2) | 11.5 (6.7–17.7) | 1.13 (0.1–8.24) | 10.2 (0.9–19.5) |
| MDR | 27.2 (19.9–37.1) | 45.0 (31.6–64.1) | 5.8 (2.3–14.6) | 7.6 (4.6–10.6) |
Forests and edge of rice fields.
NC, not calculated.
FIG 2.

Prevalence of AMR, ESBL production, and MDR among 234 E. coli isolates from 66 trapped small wild mammals (19 R. tanezumi, 10 R. norvegicus, 9 R. argentiventer, 5 R. exulans, 16 B. indica, and 7 S. murinus) (Dong Thap, Vietnam, 2013). Gray bars, mammals trapped on farms; white bars, mammals trapped in forests and rice paddies. The error bars indicate 95% confidence intervals.
Pairwise correlations of AMR.
The pairwise correlation between all possible antimicrobial combinations is shown in Fig. 3. The highest correlation was observed between the pairs trimethoprim-sulfamethoxazole–tetracycline (Pearsons' correlation, 0.63), followed by trimethoprim-sulfamethoxazole–chloramphenicol (0.60), chloramphenicol-tetracycline (0.51), ciprofloxacin–trimethoprim-sulfamethoxazole (0.49), ciprofloxacin-gentamicin (0.49), and ciprofloxacin-chloramphenicol (0.48) (all P < 0.001).
FIG 3.
Pairwise correlation between levels of resistance to eight antimicrobials used to test 668 E. coli isolates from chicken, duck, and pig farms and small wild mammals (Dong Thap, Vietnam, 2012 and 2013). Both the size of the highlighted sector and the intensity of the color are directly proportional to the correlation coefficient between levels of resistance to any two antimicrobials.
Risk factors for AMR in E. coli on farms.
Factors independently associated with MDR were (i) pig farm (OR, 1.18 and 1.41, depending on size) and (ii) age of farmer (protective) (OR, 0.86) (per 10-year period). There were significant interactions between the presence of a well water source and pig farms, with different magnitudes for small/medium and large farms (OR, 1.55 and 1.24, respectively), suggesting a greater impact of well water on MDR in small and medium pig farms than on large farms (Table 2). The variable “use of antimicrobials over the last 90 days” (reported as “yes” by 88.9% of the farms) was not significant.
TABLE 2.
Hierarchical multivariable logistic regression model investigating risk factors for MDR among E. coli isolates from farmed species (chickens, pigs, and ducks) (Dong Thap, Vietnam, 2012)a
| Risk factor | OR | 95% CI | P value |
|---|---|---|---|
| Type of farm (baseline, chicken or duck) | 1.0 | ||
| Small and medium pig farms | 1.18 | 1.04–1.35 | 0.0104 |
| 1.41 | 1.27–1.57 | <0.001 | |
| Age of farmer (per 10-yr period) | 0.86 | 0.82–0.90 | <0.001 |
| Well water | |||
| Large pig farm | 1.24 | 1.15–1.33 | <0.001 |
| Small and medium pig farms | 1.55 | 1.37–1.75 | <0.001 |
Intercept, −5.29 (standard error, ±1.38).
Resistance profiles and diversity by species and farm.
A total of 59 resistance profiles were observed. Twenty-four resistance profiles represented 91.7% of the isolates. The numbers of different profiles/total number of isolates for each species and their calculated H values were (in decreasing order) 37/143 (H = 150.4) (ducks), 36/148 (H = 148.0) (chickens), 30/143 (H = 121.6) (pigs), 25/145 (H = 99.1) (small wild mammals trapped on farms), and 12/89 (H = 42.0) (small wild mammals trapped at other sites). The overall H value per farm was 1.33 (IQR, 0.95 to 1.39). There were no statistical differences in H values between chicken, pig, and duck isolates at the farm level (data not shown). Isolates from individual small wild mammals (H = 0.50 [IQR, 0 to 0.69]) were less diverse than isolates from farms (Kruskal χ2 = 54.19; P < 0.001). No difference in diversity among isolates between small mammals by trapping location were found (Kruskal χ2 = 0.58; P = 0.443). A minimum spanning tree of the 23 most common profiles (representing at least 5 isolates and excluding fully susceptible isolates) is shown in Fig. 4. Among small wild mammals, resistance to ampicillin only was by far the most common profile. There was a considerable degree of clustering among pig resistance profiles, with 70.6% of the isolates from pigs resistant to trimethoprim-sulfamethoxazole or to ampicillin and chloramphenicol only or in addition to other antimicrobials.
FIG 4.

Minimum spanning tree illustrating distances between the 23 most common profiles representing a total of 572/668 (85.6%) E. coli isolates resistant to at least 1 antimicrobial (of 8 tested) (Dong Thap, Vietnam, 2012 and 2013). Each circle represents a unique phenotypic profile; its size is directly proportional to the number of isolates with that profile. The number of red dots between any two circles indicates the number of antimicrobials that differentiate the profiles. SM-F, small wild mammals trapped on farms; SM-O, small wild mammals trapped at nonfarm sites.
The type of animal host (chicken/duck/pig/small wild animals trapped on farms/small wild animals trapped at other sites) accounted for 26% of the total profile variability. Among isolates from each farmed species, the term “farm” explained from 41% (pig isolates) to 55% (chicken isolates) of the total variability. A comparison of variability between farm animal isolates and (i) isolates from small wild animals trapped on farms and (ii) isolates from wild animals trapped in forests/rice fields (two separate comparisons) indicated less variability between isolates from farms and those from wild animals trapped on farms (14%, 19%, and 30% for chickens, ducks, and pigs, respectively) and more variability between isolates from farmed animals and those from wild animals trapped at other sites (25%, 32%, and 45% for chickens, ducks, and pigs, respectively) (Table 3).
TABLE 3.
Results of multivariable analyses of variance for all isolates (model 1), farmed animals (models 2 to 4), and a combination of isolates from small wild mammals with each farmed species (models 5 to 10) (Dong Thap, Vietnam, 2012 and 2013)a
| Model | Isolateb | Factor | R2d |
|---|---|---|---|
| 1 | All isolates | Animal typec | 0.26 |
| 2 | Chicken | Farm | 0.55 |
| 3 | Duck | Farm | 0.43 |
| 4 | Pig | Farm | 0.41 |
| 5 | Chicken and SM-F | Chickens vs. SM-F | 0.14 |
| 6 | Chicken and SM-O | Chickens vs. SM-O | 0.25 |
| 7 | Ducks and SM-F | Ducks vs. SM-F | 0.19 |
| 8 | Ducks and SM-O | Ducks vs. SM-O | 0.32 |
| 9 | Pigs and SM-F | Pigs vs. SM-F | 0.30 |
| 10 | Pigs and SM-O | Pigs vs. SM-O | 0.45 |
All P values were <0.05.
SM-F, small wild mammals trapped on farms; SM-O, small wild mammals trapped at nonfarm sites.
Pig, chicken, or duck.
R2, variance.
Only one discriminant function was retained, as it expressed most (84.8%) of the differences between the groups. The DAPC of AMR (Fig. 5) indicated an overall similarity between isolates from farm sources, and this similarity was particularly marked between chickens and ducks. Isolates from small wild mammals (groups SM-F and SM-O) exhibited profiles that were overall fairly different from those of the other three groups (chickens, duck, and pigs), even though isolates from small animals trapped on farms display comparatively high levels of similarity with profiles of isolate from farmed animals.
FIG 5.

Representation of DAPC of AMR profiles by host type (Dong Thap, Vietnam, 2012 and 2013). Each dot corresponds to a given profile. The colored density curves indicate the distributions of profiles on the first discriminant function, with thicker shapes corresponding to more profiles at that position. Within a given host type, positions of the profiles on the x axis have been randomized for better visualization.
DISCUSSION
Among E. coli isolates from domestic animal species, we observed very high levels (∼80%) of ampicillin and tetracycline resistance, as well as moderate levels (∼25 to 50%) of trimethoprim-sulfamethoxazole, chloramphenicol, amoxicillin-clavulanic acid, and ciprofloxacin resistance. In contrast, the levels of gentamicin and ceftazidime resistance were low (∼8% and <1%, respectively).
Levels of AMR among E. coli isolates from farms were considerably higher than AMR levels recently reported in E. coli isolates from meat and farmed animals in developed countries: for example, monitoring data from the European Union (EU) (2012) indicate that 22 to 23% of isolates from broiler meat and pig farms were tetracycline resistant, 20 to 50% were ampicillin resistant (highest in broilers), 23 to 29% were sulfonamide resistant, 2 to 10% were chloramphenicol resistant, and 1.5 to 3.8% were gentamicin resistant (25).
Pig isolates were much more resistant to ciprofloxacin (41.4%) and gentamicin (38.1%) than isolates from pigs in Europe (5.6% and 1.1%, respectively). In contrast, levels of ciprofloxacin and gentamicin resistance among chicken isolates (21% and 10.8%) were not too dissimilar to levels reported in Europe (29.1% and 3.2%, respectively) (25). Although levels of AMR and MDR were very high among pig isolates, they were still marginally lower than those reported in Thailand (i.e., 96.2% tetracycline resistant, 91.6% ampicillin resistant, and 98% MDR) (26).
We have limited quantitative data on the use of antimicrobials in different farmed species on Mekong Delta farms. Because of this, we cannot establish whether the differences in AMR against different antimicrobials or the higher prevalence of AMR in the pig species is the result of differences in antimicrobial consumption. Overall relatively high levels of tetracycline and ampicillin resistance have been reported in other studies and probably reflect the long history of use of both of these antimicrobials as both therapeutic and prophylactic agents (16).
A previous survey of chicken farms in the nearby province of Tien Giang indicated that over an ∼90-day period, polypeptides (colistin), tetracyclines, and penicillins were the three most commonly used classes of antimicrobials (by 18.6%, 17.5%, and 11.3% of farms, respectively). The study indicated a total usage of 690.4 g (±203.6 g) of antimicrobial compound per chicken produced, which is very high compared with European standards (6).
A (qualitative) survey in the Red River Delta of Vietnam indicated a higher frequency of antimicrobial usage among pig farms both as growth promoters and for disease prevention and chemotherapy than on chicken farms (5). In addition, in the Mekong Delta and elsewhere in Vietnam, anecdotal field observations indicate that antimicrobials, such as tetracycline, tylosin, avilamcyin, enramycin, and colistin, are commonly used in feed formulations. Both tetracycline and colistin are important antimicrobials for human medicine. Unfortunately, due to logistical limitations, E. coli isolates were not tested for colistin resistance in our study.
Neither chloramphenicol nor ciprofloxacin is an antimicrobial approved for use in terrestrial-animal farming in Vietnam (27). The observed levels of chloramphenicol resistance may partly be explained by the common use of florfenicol, a fluorinated derivative that shows some cross-resistance with chloramphenicol (28). The observed high levels of resistance against ciprofloxacin (a quinolone antimicrobial not licensed for veterinary use) is probably explained by cross-resistance with other quinolones licensed for veterinary use, such as enrofloxacin and norfloxacin (29). In contrast, levels of resistance against third-generation cephalosporins (ceftazidime, 0.8% [95% CI, 0.3 to 1.4%]) were very low and comparable with those reported in the EU (cefotaxime) (1.1 to 3.0%) (25).
A large fraction of farmers (∼90%) reported having used antimicrobials over the previous 3 months. Unfortunately our study did not succeed in gathering detailed information on antimicrobial usage to be able to explain the observed differences in the levels of AMR at the farm level. More precise estimates of antimicrobial usage practices are required to establish this. Obtaining this type of data requires a longitudinal study design and dedicated farmer training in record keeping.
The observed lower levels of AMR on farms run by older farmers is probably a reflection of more experience in farming, resulting in better disease control with fewer antimicrobials. Overall, a high percentage of the total variability (41 to 55%) in AMR profiles was explained by the term “farm,” suggesting that on-farm interventions (likely including antimicrobial usage) may explain the observed AMR profiles. The overall highest diversity was found among isolates from duck flocks. A possible explanation is the characteristic management system of duck flocks that involves daily grazing on communal rice fields, representing a greater opportunity for infection with foreign E. coli strains (30).
We found relatively high levels of AMR among isolates from wild mammals and an unequivocally higher prevalence of AMR among isolates from wild mammals trapped in farming locations, suggesting that AMR in wildlife may be driven partly by on-farm antimicrobial usage and/or AMR on farms. These results are consistent with findings from a Canadian study, where levels of AMR among E. coli isolates from wild mammals trapped on pig farms were considerably higher than AMR levels among isolates from mammals trapped in natural areas (30.9% versus 5.4%, respectively) (13). A further Canadian study comparing E. coli isolates from wild mammals trapped in different environments reported the highest levels of AMR among wild mammals trapped on pig farms (48.0%) compared to isolates from wild mammals in residential areas (9.0%) (31). All our study farms and trapping sites were no less than 5 km away from the closest urban center (the city of Cao Lanh) and 15 km from the closest sewage treatment plant. Therefore, the impact of human sewage from farming populations on the AMR patterns of wildlife flora cannot be separated from the impact of the farmed animals themselves.
AMR may develop in the gut flora of wild mammals when the animals consume antimicrobials present in feed and water on farms, but also indirectly as a result of exposure to farm waste (32, 33). However, comparisons using pulsed-field profiles between E. coli isolates from pigs and from rodents trapped on the same farms indicated that most E. coli isolates from rodents were not of porcine origin. Their observed similarities in resistance profiles were attributed to horizontal transfer of the resistance genes via plasmids and integrons rather than transfer of the strains themselves (14). Areas exposed to farm waste may represent “hot spots” of AMR by providing conditions that promote horizontal gene transmission between commensal, pathogenic, and environmental bacteria. Unlike most antimicrobial agents, which are easily degraded in nature, the genetic platforms containing resistance genes may be rather stable (34). It is likely that the particular features of the Mekong Delta region, with a high density of animal farms close to waterways and low levels of biosecurity and biocontainment, as well as the common practice of discharging animal excreta directly into ponds or waterways (often used to grow fish) (35), may indeed contribute to the dissemination and environmental persistence of resistant bacteria and resistance genes. A survey conducted in several Southeast Asian countries (including Vietnam) has documented the widespread presence of antimicrobials in the environment, probably as a result of these practices (33).
The observed high prevalence of ampicillin resistance among isolates from trapped wild mammals is intriguing, although these results are consistent with studies elsewhere. The prevalence of ampicillin resistance among E. coli isolates from bank voles and wood mice from forest sites in England was also very high (90.0%) (36). Furthermore, in a Canadian study, the prevalence of ampicillin resistance was higher among wild mammals trapped in a natural environment than among those trapped on swine farms (8.0% versus 2.0%, respectively) (31). Further molecular studies are needed to elucidate the molecular basis of this.
The relative ease of rodent/shrew trapping in the Mekong Delta suggests that routine trapping could be integrated into surveillance programs to monitor AMR in the environment, as suggested by some authors (37).
Since AMR genes originate in environmental bacteria, there is a concern that antimicrobials used on farms and discharged into the environment may accelerate evolution toward resistance among environmental bacteria, inducing even more drastic resistance among both commensal and pathogenic bacteria (34).
In summary, we report high levels of AMR among commensal E. coli isolates for a number of common antimicrobials, including some considered to be of critical importance, such as quinolones and aminoglycosides. Levels of resistance and MDR were highest among pig isolates. We also report an unequivocal association between AMR among isolates from small wild mammals and a farm trapping location. These results should help promote awareness of the direct links between AMR in food production and the environment. We propose that similar data should be collected over time to be used as part of integrated AMR surveillance systems to monitor the emergence of new resistance types, as well as for evaluation of interventions aimed at encouraging more sustainable farming practices, including less use of antimicrobials and better biocontainment on farms in the Mekong Delta of Vietnam.
Supplementary Material
ACKNOWLEDGMENTS
We thank the staff of the Dong Thap Sub-Department of Animal Health for their support with wild mammal trapping. We also thank Yannick Chaval (Centre Nationale de la Recherche Scientifique) and Serge Morand (ISEM, Université Montpellier) for help with small wild mammal identification and Marcel Wolbers (OUCRU) for statistical advice.
This work has been cofunded by the Vietnam Initiative on Zoonotic Infections (VIZIONS WT/093724), part of the Wellcome Trust Major Overseas Programme (United Kingdom); by the VIBRE Project (ZoNMW/WOTRO/205100012; The Netherlands); and by the Li-Ka-Shing Foundation (085GR).
Footnotes
Supplemental material for this article may be found at http://dx.doi.org/10.1128/AEM.03366-14.
REFERENCES
- 1.WHO. 2014. Antimicrobial resistance: global report on surveillance. http://www.who.int/drugresistance/documents/surveillancereport/en/ Accessed 10 July 2014.
- 2.Laxminarayan R, Duse A, Wattal C, Zaidi AK, Wertheim HF, Sumpradit N, Vlieghe E, Hara GL, Gould IM, Goossens H, Greko C, So AD, Bigdeli M, Tomson G, Woodhouse W, Ombaka E, Peralta AQ, Qamar FN, Mir F, Kariuki S, Bhutta ZA, Coates A, Bergstrom R, Wright GD, Brown ED, Cars O. 2013. Antibiotic resistance: the need for global solutions. Lancet Infect Dis 13:1057–1098. doi: 10.1016/S1473-3099(13)70318-9. [DOI] [PubMed] [Google Scholar]
- 3.Pagel SW, Gautier P. 2012. Use of antimicrobial agents in livestock. Rev Sci Tech 31:145–188. doi: [DOI] [PubMed] [Google Scholar]
- 4.FAO. 2008. Report of the Joint FAO/WHO/OIE Expert Meeting on Critically Important Antimicrobials Rome, Italy. Food and Agriculture Organization of the United Nations, Rome, Italy http://www.who.int/foodborne_disease/resources/Report%20joint%20CIA%20Meeting.pdf Accessed 14 March 2014. [Google Scholar]
- 5.Dang PK, Saegerman C, Douny C, Ton VD, Bo HX, Binh DV, Ngan PH, Scippo ML. 2013. First survey on the use of antibiotics in pig and poultry production in the Red River Delta region of Vietnam. Food Public Health 3:247–256. [Google Scholar]
- 6.Carrique-Mas J, Trung NV, Hoa NT, Mai HH, Thanh TT, Campbell J, Wagenaar J, Hardon A, Hieu TQ, Schultsz C. 28 November 2014. Antimicrobial usage in chicken production in the Mekong delta of Vietnam. Zoonoses Public Health. doi: 10.1111/zph.12165. [DOI] [PubMed] [Google Scholar]
- 7.Van TT, Moutafis G, Istivan T, Tran LT, Coloe PJ. 2007. Detection of Salmonella spp. in retail raw food samples from Vietnam and characterization of their antibiotic resistance. Appl Environ Microbiol 73:6885–6890. doi: 10.1128/AEM.00972-07. [DOI] [PMC free article] [PubMed] [Google Scholar]
- 8.Carrique-Mas JJ, Bryant JE, Cuong NV, Hoang NV, Campbell J, Hoang NV, Dung TT, Duy DT, Hoa NT, Thompson C, Hien VV, Phat VV, Farrar J, Baker S. 2014. An epidemiological investigation of Campylobacter in pig and poultry farms in the Mekong delta of Vietnam. Epidemiol Infect 142:1425–1436. doi: 10.1017/S0950268813002410. [DOI] [PMC free article] [PubMed] [Google Scholar]
- 9.Thai TH, Hirai T, Lan NT, Yamaguchi R. 2012. Antibiotic resistance profiles of Salmonella serovars isolated from retail pork and chicken meat in North Vietnam. Int J Food Microbiol 156:147–151. doi: 10.1016/j.ijfoodmicro.2012.03.016. [DOI] [PubMed] [Google Scholar]
- 10.Aarestrup FM, Wegener HC, Collignon P. 2008. Resistance in bacteria of the food chain: epidemiology and control strategies. Expert Rev Anti Infect Ther 6:733–750. doi: 10.1586/14787210.6.5.733. [DOI] [PubMed] [Google Scholar]
- 11.Marshall BM, Levy SB. 2011. Food animals and antimicrobials: impacts on human health. Clin Microbiol Rev 24:718–733. doi: 10.1128/CMR.00002-11. [DOI] [PMC free article] [PubMed] [Google Scholar]
- 12.Dang STT, Petersen A, Van Truong D, Chu HTT, Dalsgaard A. 2011. Impact of medicated feed on the development of antimicrobial resistance in bacteria at integrated pig-fish farms in Vietnam. Appl Environ Microbiol 77:4494–4498. doi: 10.1128/AEM.02975-10. [DOI] [PMC free article] [PubMed] [Google Scholar]
- 13.Kozak GK, Boerlin P, Janecko N, Reid-Smith RJ, Jardine C. 2009. Antimicrobial resistance in Escherichia coli isolates from swine and wild small mammals in the proximity of swine farms and in natural environments in Ontario, Canada. Appl Environ Microbiol 75:559–566. doi: 10.1128/AEM.01821-08. [DOI] [PMC free article] [PubMed] [Google Scholar]
- 14.Literak I, Dolejska M, Rybarikova J, Cizek A, Strejckova P, Vyskocilova M, Friedman M, Klimes J. 2009. Highly variable patterns of antimicrobial resistance in commensal Escherichia coli isolates from pigs, sympatric rodents, and flies. Microb Drug Resist 15:229–237. doi: 10.1089/mdr.2009.0913. [DOI] [PubMed] [Google Scholar]
- 15.European Food Safety Authority. 2012. Technical specifications on the harmonised monitoring and reporting of antimicrobial resistance in Salmonella, Campylobacter and indicator Escherichia coli and Enterococcus spp. bacteria transmitted through food. EFSA J 10:1–64. [Google Scholar]
- 16.Tadesse DA, Zhao S, Tong E, Ayers S, Singh A, Bartholomew MJ, McDermott PF. 2012. Antimicrobial drug resistance in Escherichia coli from humans and food animals, United States, 1950–2002. Emerg Infect Dis 18:741–749. doi: 10.3201/eid1805.111153. [DOI] [PMC free article] [PubMed] [Google Scholar]
- 17.Levy PS, Lemeshow S. 1999. Sampling of populations: methods and applications. Wiley series in probability and statistics, p 258 Wiley, London, United Kingdom. [Google Scholar]
- 18.American Veterinary Medical Association. 2007. AVMA guidelines on euthanasia. http://grants.nih.gov/grants/olaw/Euthanasia2007.pdf Accessed 4 January 2014.
- 19.Chaval Y. 2011. South East Asian murines field guide, version 03. CERoPath Project, French Ministry of Research. http://en.calameo.com/read/001494710bc6243baa59c Accessed 2 July 2014.
- 20.CLSI. 2011. Performance standards for antimicrobial susceptibility testing; 21st informational supplement. CLSI/NCCLS M100-S21. Clinical and Laboratory Standards Institute, Wayne, PA. [Google Scholar]
- 21.Dohoo I, Martyn W, Stryhn H. 2003. Veterinary epidemiologic research. AVC Inc., Charlottetown, Canada. [Google Scholar]
- 22.Hosmer D, Lemeshow S. 2000. Applied logistic regression, 2nd ed. John Wiley and Sons, Hoboken, NJ. [Google Scholar]
- 23.Anderson M. 2001. A new method for non-parametric multivariate analysis of variance. Aust Ecol 26:32–46. doi: 10.1046/j.1442-9993.2001.01070.x. [DOI] [Google Scholar]
- 24.Jombart T, Devillard S, Balloux F. 2010. Discriminant analysis of principal components: a new method for the analysis of genetically structured populations. BMC Genet 11:94. doi: 10.1186/1471-2156-11-94. [DOI] [PMC free article] [PubMed] [Google Scholar]
- 25.European Food Safety Authority. 2014. The European Union summary report on antimicrobial resistance in zoonotic and indicator bacteria from humans, animals and food in 2012. EFSA J 12:3590. [DOI] [PMC free article] [PubMed] [Google Scholar]
- 26.Lay KK, Koowattananukul C, Chansong N, Chuanchuen R. 2012. Antimicrobial resistance, virulence, and phylogenetic characteristics of Escherichia coli isolates from clinically healthy swine. Foodborne Pathog Dis 9:992–1001. doi: 10.1089/fpd.2012.1175. [DOI] [PubMed] [Google Scholar]
- 27.Anonymous. 2009. List of medicinal products, substances and antimicrobials banned for use in terrestrial animal farming. 15/2009/TT-BNN Ministry of Agriculture, Hanoi, Vietnam: (In Vietnamese.) [Google Scholar]
- 28.Schwarz S, Kehrenberg C, Doublet B, Cloeckaert A. 2004. Molecular basis of bacterial resistance to chloramphenicol and florfenicol. FEMS Microbiol Rev 28:519–542. doi: 10.1016/j.femsre.2004.04.001. [DOI] [PubMed] [Google Scholar]
- 29.Literak I, Reitschmied T, Bujnakova D, Dolejska M, Cizek A, Bardon J, Pokludova L, Alexa P, Halova D, Jamborova I. 2013. Broilers as a source of quinolone-resistant and extraintestinal pathogenic Escherichia coli in the Czech Republic. Microb Drug Resist 19:57–63. doi: 10.1089/mdr.2012.0124. [DOI] [PubMed] [Google Scholar]
- 30.Minh PQ, Stevenson MA, Schauer B, Morris RS, Quy TD. 2010. A description of the management of itinerant grazing ducks in the Mekong river delta of Vietnam. Prev Vet Med 94:101–107. doi: 10.1016/j.prevetmed.2009.11.011. [DOI] [PubMed] [Google Scholar]
- 31.Allen SE, Boerlin P, Janecko N, Lumsden JS, Barker IK, Pearl DL, Reid-Smith RJ, Jardine C. 2011. Antimicrobial resistance in generic Escherichia coli isolates from wild small mammals living in swine farm, residential, landfill, and natural environments in southern Ontario, Canada. Appl Environ Microbiol 77:882–888. doi: 10.1128/AEM.01111-10. [DOI] [PMC free article] [PubMed] [Google Scholar]
- 32.Guenther S, Ewers C, Wieler LH. 2011. Extended-spectrum beta-lactamases producing E. coli in wildlife, yet another form of environmental pollution? Front Microbiol 2:246. doi: 10.3389/fmicb.2011.00246. [DOI] [PMC free article] [PubMed] [Google Scholar]
- 33.Suzuki S, Hoa PT. 2012. Distribution of quinolones, sulfonamides, tetracyclines in aquatic environment and antibiotic resistance in Indochina. Front Microbiol 3:67. doi: 10.3389/fmicb.2012.00067. [DOI] [PMC free article] [PubMed] [Google Scholar]
- 34.Martinez JL. 2009. The role of natural environments in the evolution of resistance traits in pathogenic bacteria. Proc Biol Sci 276:2521–2530. doi: 10.1098/rspb.2009.0320. [DOI] [PMC free article] [PubMed] [Google Scholar]
- 35.Phong LT, Udo HM, Van Mensvoort ME, Tri LQ, Bosma RH, Nhan DK, Van der Zijpp AJ. 2008. Integrated agriculture-aquaculture systems in the Mekong Delta, Vietnam: an analysis of recent trends. Asian J Agric Dev 4:51–66. [Google Scholar]
- 36.Gilliver M, Bennett M, Begon M, Hazel S, Hart C. 1999. Enterobacteria: antibiotic resistance found in wild rodents. Nature 401:233–234. doi: 10.1038/45724. [DOI] [PubMed] [Google Scholar]
- 37.Martel JL, Tardy F, Sanders P, Boisseau J. 2001. New trends in regulatory rules and surveillance of antimicrobial resistance in bacteria of animal origin. Vet Res 32:381–392. doi: 10.1051/vetres:2001131. [DOI] [PubMed] [Google Scholar]
Associated Data
This section collects any data citations, data availability statements, or supplementary materials included in this article.