

Abstract
White-tailed deer are an important reservoir for pathogens that can contribute a large portion of microbial pollution in fragmented agricultural and forest landscapes. The scarcity of experimental data on survival of microorganisms in and release from deer feces makes prediction of their fate and transport less reliable and development of efficient strategies for environment protection more difficult. The goal of this study was to estimate parameters for modeling Escherichia coli survival in and release from deer (Odocoileus virginianus) feces. Our objectives were as follows: (i) to measure survival of E. coli in deer pellets at different temperatures, (ii) to measure kinetics of E. coli release from deer pellets at different rainfall intensities, and (iii) to estimate parameters of models describing survival and release of microorganisms from deer feces. Laboratory experiments were conducted to study E. coli survival in deer pellets at three temperatures and to estimate parameters of Chick's exponential model with temperature correction based on the Arrhenius equation. Kinetics of E. coli release from deer pellets were measured at two rainfall intensities and used to derive the parameters of Bradford-Schijven model of bacterial release. The results showed that parameters of the survival and release models obtained for E. coli in this study substantially differed from those obtained by using other source materials, e.g., feces of domestic animals and manures. This emphasizes the necessity of comprehensive studies of survival of naturally occurring populations of microorganisms in and release from wildlife animal feces in order to achieve better predictions of microbial fate and transport in fragmented agricultural and forest landscapes.
INTRODUCTION
Fecal bacteria are a leading cause of water body impairment in the United States (1), and Escherichia coli is currently used by the Environmental Protection Agency (EPA) as an indicator organism for fecal contamination and bacterial impairment for watersheds. Currently, there are 3,451 impaired water bodies in the United States, based on E. coli monitoring (1). It has been recognized that livestock and wastewater are major sources of fecal contamination in watersheds (2–4), while cattle are commonly considered a principal reservoir of E. coli O157:H7 (5–7). However, in fragmented agricultural and forest landscapes, wildlife can contribute a large portion of the fecal pollution (8–11), also serving as a reservoir for pathogens. E. coli O157:H7 was found in feral swine in Sweden (12) and in California, USA (13–15); E. coli O157:H7 were also isolated from feces of white-tailed deer cograzing with cattle (16–18). Black-tailed deer were identified as a source of E. coli O157:H7 strawberry-transmitted infection in Oregon, which caused 15 illness cases, including two deaths (19). Seventy people were reported to be infected by E. coli O157:H7 after consumption of unpasteurized apple juice in the western United States and British Columbia, Canada, in October 1996. This outbreak of E. coli O157:H7 infection was suspected to be associated with apples coming from orchards frequented by deer (20). Since E. coli O157:H7 is spread via a fecal-oral route and deer may harbor this pathogen, there is a possibility for other ruminants to become infected through exposure to contaminated feces (21).
Increasing microbial pollution associated with livestock operations and wildlife stimulated research of microbial survival in fecal materials, manure-amended soils, bottom sediment, and open bodies of water that has been summarized in several comprehensive reviews (22–25). Temperature, water content, and pH were suggested to be the most important factors that control bacterial survival. Reddy et al. (26) and Mubiru et al. (27) demonstrated that increases in water content caused a decrease in microbial die-off rates in soil. Shorter survival of enteric bacteria was reported in acid soils (28, 29). An increase in temperature was shown to increase growth rates of E. coli in river water (30) but reduce survival duration (31, 32).
The majority of previous work focused on E. coli from poultry and dairy sources, including manure slurries from dairy facilities and fresh cattle deposits. Less attention was devoted to survival of E. coli originating from wildlife. Specifically, Gallagher et al. (4) studied survival of E. coli originating from feral hogs and deer and isolated from soil and creek water, and survival of E. coli introduced into streambed sediments from goose and deer feces was examined by Kiefer et al. (33). Surprisingly, despite recognition that wildlife can potentially contribute E. coli contamination in the environment, to the best of our knowledge there are no published reports of E. coli survival in wildlife fecal material.
The survival of E. coli in feces is only one side of the coin; the other side is E. coli release from fecal material. Indeed, unless the bacteria are directly deposited into water bodies, only a fraction of surviving E. coli that is released from fecal deposits with rainfall water can be transported with runoff and contaminate surface water. Several works dealt with microbial release from manure or fecal deposits. Springer et al. (34) were probably the first to systematically address the release of fecal coliforms from artificial cowpats using a rain simulator and showed the effect of manure age and rainfall intensity on fecal coliform release. The effect of manure age in artificial cowpats was further studied by Thelin and Gifford (35), Kress and Gifford (36), and Muirhead et al. (37), whose results indicated that numbers of released bacterial cells correlated with declining bacterial concentrations in cowpats due to die-off. Additional experiments on kinetics of bacterial release from cattle manure reported differences in release kinetics for different manure components (38–40) and revealed the effects of manure type, temperature, and solution salinity on the release kinetics (41, 42). These experiments also provided parameters for the event-based model KINEROS2/STWIR (43–45), which predicts overland transport of bacteria released from fecal deposits or surface-applied manure. All listed studies used bovine manure or fecal deposits, and to the best of our knowledge, no attempts were undertaken to quantify release of E. coli from fecal material produced by wildlife.
This study aimed to fill a gap in this knowledge and provide parameters for modeling E. coli survival and release from wildlife fecal material. We chose white-tailed deer (Odocoileus virginianus) pellets as a source of E. coli. The objectives of this study were as follows: (i) to measure survival of E. coli in deer pellets at different temperatures, (ii) to measure kinetics of E. coli release from deer pellets at different rainfall intensity, and (iii) to estimate parameters of models describing survival and release of microorganisms from fecal material.
MATERIALS AND METHODS
Survival experiment.
Freshly deposited fecal pellets were collected from three female white-tailed deer (Odocoileus virginianus) maintained at the Michigan State University Veterinary Research Farm. Samples were transported to the laboratory, and individual pellets were placed in sterile specimen containers. The specimen containers were divided into three lots. One lot each was stored at 4°C, 20°C, and 35°C. Two pellets were removed from each storage condition and assayed for E. coli on days 1, 2, 4, 8, 13, 16, 19, and 31 after collection. A total of 56 pellets were used in E. coli assays. On each day, only two pellet replications were used at each temperature. The reason is that only fresh excreted material could be used for assays in order to avoid an influence of the differences in pellet compositions, pellet properties, and times between deposition and the start of incubation experiments on bacterial survival. Between measurements, all pellets were stored in closed sterile specimen containers to prevent water loss via evaporation. Fecal pellets were individually weighed to determine wet weight in sterile Whirl-Pak (Nasco, WI) bags. Sterile phosphate-buffered water (46) (100 ml) was added to each bag, and the pellets were homogenized for 5 min in a BagMixer 400P stomacher (Interscience, France) at 8 strokes per second. Forty milliliters of the homogenized pellet suspension was centrifuged at 4°C in a sterile centrifuge tube at 1,000 × g for 15 min to separate large debris. The supernatant was transferred into a sterile tube and serially diluted with sterile phosphate-buffered water. Dilutions were processed by membrane filtration, and membranes were transferred to mTEC (Becton, Dickinson and Company, Sparks, MD) agar plates. Two plates for each pellet were placed in waterproof bags and incubated at 35 ± 0.5°C for 1 h and then submerged in a water bath at 44.5 ± 0.2°C for 22 to 24 h. After incubation, magenta colonies were counted and adjusted by the processed volume to determine E. coli concentration per unit of pellet wet weight. In addition to E. coli content measurements, dry mass and water content were measured in pellets from each group. These measurements were used to calculate E. coli content per unit of dry mass of the pellet.
The inactivation of E. coli in the deer pellet was described using Chick's (47) exponential model with temperature correction based on the Arrhenius equation:
| (1) |
where C is the bacterial content in the pellet (CFU g of dry pellet−1), t is time (day), T is the temperature (°C), μ is the first-order inactivation rate constant (day−1), λ is the temperature correction coefficient (dimensionless), and Tr and μr are the reference temperature and the bacterial inactivation rate at Tr.
The inactivation parameters λ and μr for E. coli were obtained by fitting equation 1 to the experimental data using a regression wizard of the SigmaPlot software (Systat Software, San Jose, CA, USA). Equation 1 was applied only to the declining limb of measured E. coli concentration dynamics in the pellet:
| (2) |
where Ce is the E. coli concentration at the beginning of the exponential inactivation stage (CFU g of dry pellet−1) and te is the time of the beginning of this stage (day).
Release experiment.
Laboratory experiments were conducted to study the influence of rainfall and irrigation intensity on the release of E. coli from deer pellets. Fresh pellets from white-tailed deer (Odocoileus virginianus) were collected as described above and stored in a sterile screw-cap vials for 4 days at temperature of 4°C and 20°C to let E. coli approach the highest concentration in pellets. Then one pellet was placed on a metal screen mounted inside a 50-ml pipette and was subjected to irrigation. Deionized water was applied through a septum needle installed at a height of 56 cm above the pellet to mimic rain drops on the pellet surface. The needle was adjusted horizontally to drip on the center of the pellet. Six constant flow velocities ranging from 3.7 to 11.7 ml/h were maintained during the experiment by peristaltic pump (model RP-1; Dynamax; Rainin Instrument Co., Emeryville, CA). The effluent was collected from the pipette outlet and analyzed for E. coli content similarly to the survival experiment. The first portion of the effluent solution was taken 10 min after the peristaltic pump was turned on, and the other 11 samples were collected at 5-min intervals during the experiment. The experiment was conducted in a cold room at 4°C to minimize E. coli growth.
The measured release kinetics were used to compute the parameters of the Bradford-Schijven bacterial release model (41). The model was applied to the cumulative data of the released mass of bacteria to reduce model sensitivity to the oscillations in the concentration values:
| (3) |
where Mt is the cumulative number of bacterial CFU released into the aqueous phase within time t (CFU), M0 is the initial number of bacterial CFU in the pellet (CFU), q is the water application rate (ml h−1), ti is the time when the release started (h), and α (h−1) and β (dimensionless) are fitting parameters defining the shape of the release curve.
It has been shown (40) that model fitting to a single release curve does not provide reliable estimates of release parameters. Therefore, by following the approach suggested by Guber et al. (40), the Levenberg-Marquardt nonlinear least-squares algorithm was applied to the whole data set with the same values of the parameters (α and β) for all measured release curves but with M0 values being individual for each curve. The initial M0 values were estimated from E. coli measurements in the pellet taken from the same pellet group prior to irrigation and then corrected during model fitting to the experimental data. The goodness of fit for the model application was assessed by estimating the root mean square error (RMSE) between measured and simulated cumulative release curves.
RESULTS
Survival experiment.
Two distinct stages in E. coli survival were observed in the survival time series. A relatively short bacterial growth stage that lasted from 4 to 8 days was followed by a relatively long die-off stage. Detectable concentrations of E. coli were still present at the end of the experiment (Fig. 1). The E. coli content increased from 1.5 to 3 orders of magnitude during the first stage at three studied temperatures. Maximum E. coli growth was observed at temperature of 20°C, where the bacterial concentrations approached 9.62 log10(CFU g [dry weight]−1) at the end of the growth stage. The least growth occurred at 4°C, which produced maximum E. coli concentration of 5.07 log10(CFU g [dry weight]−1).
FIG 1.
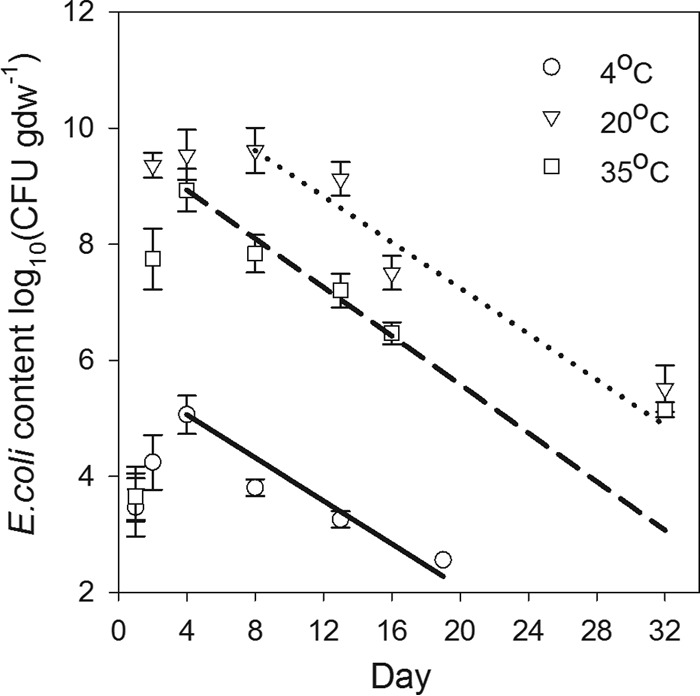
E. coli concentrations measured in deer pellets during the survival experiment at three studied temperatures. Lines represent results of fitting equation 2 to the bacterial die-off stage.
The duration of the first stage and the rates of E. coli growth were different for the three temperatures. The first stage lasted for 4 days at temperatures of 4°C and 35°C but was twice as long at 20°C. The bacterial growth was fastest between the first and second day of the experiment, with average daily rates of 0.776, 5.660, and 4.091 log10(CFU g [dry weight]−1) for 4°C, 20°C, and 35°C, respectively. After growth peaked on day 4 at 4°C and 35°C, E. coli concentrations rapidly declined. However, at 20°C, E. coli concentrations remained close to the maximum value between day 2 and day 13 (Fig. 1) before entering the declining stage.
The second stage of the E. coli survival experiment was characterized by approximately the same die-off rates for the three temperature regimens, as indicated by the slope in the graphs of log10 E. coli concentration versus day in Fig. 1. This was consistent with the values of parameters obtained in the fitting of equation 2 to the declining limb of the survival time series. Specifically, the value of the temperature correction coefficient (λ) was close to unity (1.007), indicating a minor influence of temperature on E. coli die-off. The computed value of the bacterial inactivation rate (μr) was 0.175 day−1 at a reference temperature (Tr) of 20°C, while μ values were 0.158 and 0.194 day−1 for 4°C and 35°C, respectively. Values of R2 (0.984) and RMSE of the E. coli concentrations {0.688 log10(CFU g [dry weight]−1])} indicated acceptable accuracy of the fit of the model (equation 2) to the experimental data.
Water content measured in the deer pellets varied during the survival experiment. We observed a decrease in water content from initial values of 2.379 ± 0.062 g g−1 to the final values of 0.564 ± 0.147 g g−1, 1.610 ± 0.109 g g−1, and 0.274 ± 0.055 g g−1 during the 32 days of the survival experiment at 4°C, 20°C, and 35°C, respectively. The decrease was more pronounced during the first 8 days of the experiment (Fig. 2). Average daily water content losses during the first week of the experiment ranged from 0.072 to 0.229 g g−1 and were largest at 35°C and smallest at 20°C. Overall, pellet water content during the survival experiment decreased faster at 4°C than 20°C and 35°C.
FIG 2.
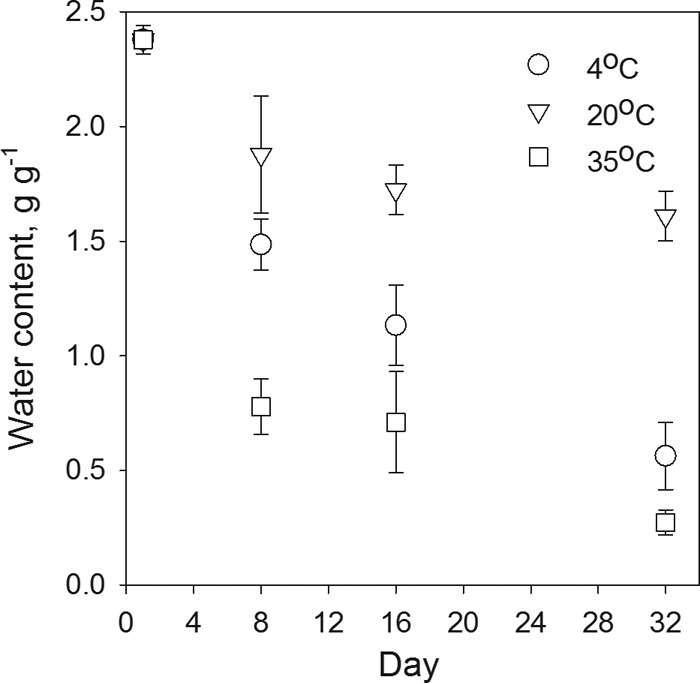
Changes in water content of deer pellets measured in the E. coli survival experiment at the three temperatures studied.
In order to determine how E. coli survival in deer pellets differs from its survival in other environments, we compared the results of this research with multiple published studies of E. coli survival conducted at different temperatures and in different environments. The environments addressed in the reviewed published studies included bovine feces (48, 49), fresh dairy manure and slurry, old dairy slurry (50), sheep feces (51), sandy loam soil (52), loamy sand and sandy loam sediment (53), and stream water (54). Results of these studies were used to estimate the value of the first order inactivation rate constant at a reference temperature of 20°C (μ20) and the value of the temperature correction coefficient (λ) in equation 1. The comparison of inactivation rates obtained for different environmental conditions showed that the μ20 value obtained in this study for deer pellets is the closest to that reported for bovine feces by Wang et al. (48) (Table 1). Among the examined studies, the smallest and largest μ20 values were obtained in sandy loam soil (67) and in stream water (54), respectively. Inactivation rates obtained for sediment by Garzio-Hadzick et al. (55) were higher or lower than the μ20 for deer pellets of our study depending on the sediment texture. We plotted E. coli die-off rates at different temperatures based on the data shown in Table 2 (Fig. 3). As can be seen from Fig. 3, the inactivation rate for deer pellets was nearly the same as that in stream water and considerably higher than that in the other environments at 4°C but was the lowest among all the environments at 35°C.
TABLE 1.
Parameters of E. coli inactivation model (equations 1 and 2) for different environments estimated from different data sources
| Environmenta | μ20 (day−1) | λ | R2 | Temperature range (°C) | Reference |
|---|---|---|---|---|---|
| Bovine feces* | 0.168 | 1.045 | 0.942 | 5–37 | 48 |
| Old dairy slurry* | 0.124 | 1.078 | 0.998 | 4–37 | 50 |
| Fresh dairy slurry* | 0.081 | 1.083 | 0.984 | 4–37 | 50 |
| Fresh dairy manure* | 0.090 | 1.069 | 0.975 | 4–37 | 50 |
| Sheep feces | 0.242 | 1.095 | 0.792 | 5–18 | 51 |
| Deer pellet | 0.175 | 1.007 | 0.984 | 4–35 | This study |
| Sandy loam soil | 0.069 | 1.072 | 0.996 | 5–37 | 67 |
| Loamy sand sediment | 0.230 | 1.109 | 0.988 | 4–24 | 55 |
| Sandy loam sediment | 0.088 | 1.066 | 0.894 | 4–24 | 55 |
| Stream water | 0.859 | 1.108 | 0.976 | 5–25 | 54 |
*, laboratory strains of E. coli O157:H7 were used. Naturally occurring E. coli was used in all other environments.
TABLE 2.
Measured and computed variables and statistics of the E. coli release model (equation 3)
| Irrigation rate (ml h−1) | Initial E. coli content in pellet |
E. coli recovery (%) | RMSE (105 CFU)b | ||
|---|---|---|---|---|---|
| Per dry mass (108 CFU g [dry wt]−1)a | Total cells (108 CFU)a | Fitted M0 (108 CFU) | |||
| 3.7 | 4.96, 8.06 | 1.00, 1.63 | 4.15 | 15.8 | 20.2 |
| 4.2 | 8.31, 13.9 | 1.13, 1.88 | 5.22 | 15.6 | 17.8 |
| 6.4 | 0.62, 1.24 | 0.12, 0.25 | 0.26 | 20.3 | 3.6 |
| 10.7 | 19.7, 23.2 | 4.18, 4.92 | 4.67 | 23.6 | 7.9 |
| 11.6 | 21.9, 25.9 | 5.65, 6.66 | 3.55 | 21.4 | 31.2 |
| 11.7 | 14.2, 17.5 | 3.35, 4.13 | 4.92 | 24.8 | 13.9 |
Minimum and maximum values measured in replicates.
Root mean square error of fitting equation 3 to the cumulative E. coli release curves.
FIG 3.
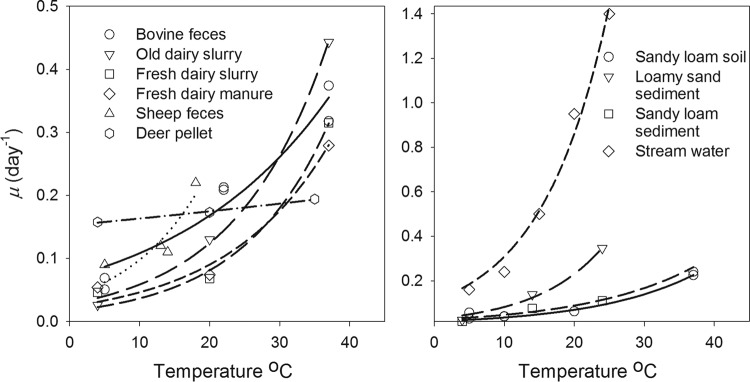
Relationships between E. coli die-off rates and temperature estimated for different environments based on parameters of E. coli inactivation model (equation 1 and equation 2) obtained from published studies listed in Table 2.
Release experiment.
High variation of naturally occurring E. coli concentrations was observed in the collected deer pellets used for the release experiments. The initial concentrations spanned an order of magnitude of 1.6 (Table 2). High oscillations of E. coli concentrations were observed in the effluent during the whole experiment (Fig. 4). Overall, a gradual decrease in E. coli concentrations was observed at low irrigation rates (Fig. 4a), while an abrupt decrease occurred at irrigation rates of 11.6 and 11.7 ml h−1 after 40 min of irrigation (Fig. 4b). Visual inspection revealed holes in the pellet formed by droplets. E. coli concentrations in the effluent were the highest for the irrigation rate of 4.2 ml h−1 and the lowest for 6.4 ml h−1.
FIG 4.
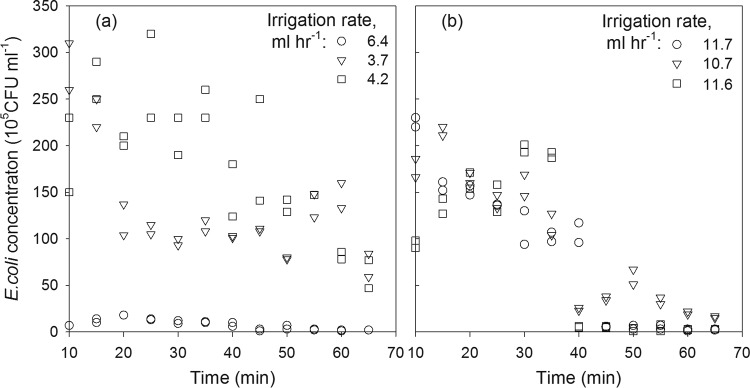
E. coli concentrations measured in the effluent during the release experiments with low (a) and high (b) irrigation rates.
Cumulative release curves had a smooth shape and a general increase in total numbers of released CFU with time was observed for all irrigation rates. More E. coli was released at high irrigation rates than at low rates (Fig. 5). The recovery of E. coli was also different at different irrigation rates: 15.8% to 20.3% of E. coli CFU were recovered from the pellets at low irrigation rates, while 21.4% to 24.8% were recovered at high rates (Table 2).
FIG 5.
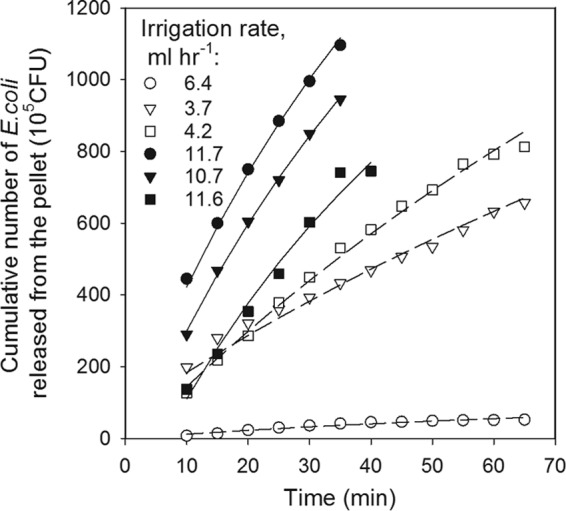
Measured (symbols) and simulated (lines) kinetics of E. coli release from deer pellets at low (open symbols) and high (closed symbols) irrigation rates.
The Bradford-Schijven bacterial release model (equation 3) reproduced all experimental data reasonably well (Fig. 5). Root mean square errors ranged from 3.6 × 10⁵ to 31.2 × 10⁵ CFU; that is, they constituted less than 10% of the recovered culturable bacteria. Given the high variability of E. coli concentrations in replicated measurements, the model accuracy can be regarded as acceptable. Fitted values of the initial number of bacterial CFU in pellets (M0) deviated slightly from measured values but also were within a reasonable range (Table 2). These deviations were rather random, since no correlation was found between the measured total CFU and the fitted values. The values of fitting parameters defining the shape of the release curves were as follows: a = 0.0969 ml−1 and β = 1.924 (Table 3).
TABLE 3.
Parameters of the microbial release model (equation 3) in different fecal materials reported or estimated from data sources
| Exptl conditionsa | a (cm−1) | β | Reference |
|---|---|---|---|
| Drip irrigation of dairy manure disk* | 0.00693 ± 0.00207 | 5.957 ± 3.917 | 42 |
| Mist irrigation of dairy manure disk | 0.00124 | 4.9 ± 1.3 | 42 |
| Drip irrigation of dairy manure disk* | 0.00698 ± 0.00161 | 6.005 ± 2.058 | 41 |
| Dairy slurry, runoff-box study, vegetation | 0.540 ± 0.022 | 0.884 ± 0.336 | 40 |
| Dairy slurry, runoff-plot study, vegetated plots | 1.077 | 0.602 ± 0.262 | 40 |
| Dairy slurry, runoff-plot study bare plots | 2.804 | 0.727 ± 0.873 | 40 |
| Deer pellet | 0.00685 | 1.924 | This study |
*, Cryptosporidium parvum oocysts and Giardia duodenalis cysts were used. E. coli was used for all other conditions.
DISCUSSION
Survival experiment.
The two-stage kinetics of E. coli survival in deer pellets observed in this study was consistent with results published by other authors for fecal coliform growth and die-off in manure amended soil, sediment, and runoff water in early (35, 48–50, 53, 56–58) and recent studies (33, 55). Specifically for dairy manure, Himathongkham et al. (50) observed a slight increase in E. coli O157:H7 GFP population during the first 3 days followed by a 6-log decrease during subsequent 35 days of the experiment. Wang et al. (48) reported a 2-log10 increase of inoculated E. coli O157:H7 population in bovine feces after 2 days at 37°C. A 1.5- to 2.0-log10(CFU/g) increase in E. coli O157:H7 population was observed in dairy cattle feces during the first 3 days, followed by a 2- to 5-log10(CFU/g) decrease during the next 4 weeks of incubation (49). In our study, the first stage of E. coli increase lasted much longer (up to 8 days) and the increase was much more pronounced [up to 3 log10(CFU/g)] than in the published dairy studies. This implies that E. coli concentrations measured in fresh deer deposits cannot be used directly for informing total maximum daily load (TMDL) models, because this could lead to substantial underestimation of the E. coli inputs. Higher potential of E. coli growth in deer pellets should not be neglected during estimations of E. coli loads in watersheds.
The increase in E. coli concentration during the first stage of survival in the fecal depositions is often attributed to several factors. Among them are reduction of environmental stresses on the bacteria and lowered levels of toxic compounds in the growth medium due to dilution, increased nutrient supply, fewer antagonistic effects from other organisms, and changes in oxygen level in the new environment (23). In our study, the change in oxygen level was likely the primary factor among those listed above that affected the enhanced E. coli growth, since the pellets were not diluted and the nutrient supply for E. coli populations was unlimited.
Temperature is an important factor affecting bacterial growth (30, 59). Indeed, E. coli grew faster and maximum E. coli concentrations in deer pellets were higher at 20°C than at 4°C and 35°C. Minimum growth observed in our study at 4°C was consistent with results of earlier E. coli survival studies in different environments, i.e., dairy manure (50), cattle feces (49), and glucose minimal medium (60). The slow E. coli growth or absence of growth at low temperatures was commonly attributed to a limited ability of E. coli to synthesize protein (61–63). Contrary to some studies (e.g., reference 48), our results showed a 2-log increase in E. coli population at 4°C. The increase of E. coli growth in the deer pellet with temperature concurs with E. coli growth observed in cattle cowpats (64). Martinez et al. (64) found that the thermal day growth rate increased exponentially with temperature during the first week of bacterial sampling. However, in their study, temperatures below 15°C produced negative or zero E. coli growth, while in our study, the growth was positive. These differences in E. coli growth can be attributed partly to different E. coli strains and different growing conditions in the dairy cattle feces and cowpats used in previous studies compared to the white-tailed deer feces used in our study.
During the second survival stage, the highest E. coli concentrations in the pellets were observed at the highest water contents and at the intermediate temperature level (20°C), while concentrations were the lowest at intermediate water contents and at the lowest temperature (4°C) (Fig. 1 and 2). Both temperature and water content could influence E. coli die-off in deer pellets. The effect of temperature on bacterial survival is well studied, and it is known that E. coli die-off typically occurs faster at high temperatures (31, 32, 50, 55, 65, 66). The effect of water content is less well understood, and as of now, there is no general agreement on its effect on microbial inactivation rates. Sinegani and Maghsoudi (52) reported that E. coli contents in soil treated with different manure amendments were the highest at permanent wilting point, the lowest at saturation, and intermediate at field capacity. In contrast, Sjogren (67) observed the longest E. coli survival in soil microcosms (up to 23.3 months) under saturated moisture conditions. Drying-wetting settings also can influence the E. coli survival. Antheunisse and Arkesteijn-Dijksman (68) obtained higher E. coli inactivation rates in a filter paper disc study under fast drying than slow drying conditions, while Himathongkham et al. (50) observed lower E. coli O157:H7 GFP inactivation rates in the top layer of manure, which dried faster than the middle-bottom manure layer. In our study, the E. coli inactivation rates during the second stage of bacterial survival did not differ significantly despite differences in incubation temperature and pellet moisture content (Fig. 2). Similarity in E. coli inactivation rates observed at the three temperatures resulted in longer survival and overall higher E. coli concentrations at 20°C, primarily due to considerably higher growth rates at 20°C than at 4°C and 35°C. This finding is supported by the results of the E. coli survival study conducted in suspensions of bovine or raccoon feces in creek water at different temperatures (69). The author observed a 4-log increase in E. coli population within the first 3 days followed by nearly a constant concentration of E. coli during 4 consecutive days of incubation. E. coli growth was not observed or was insignificant in the suspensions incubated at 0°C, 10°C, and 50°C in that study.
Comparison of E. coli survival rates at different temperatures and environments showed that the magnitude of the temperature effect on E. coli survival in deer pellets differed from that in other environments (Fig. 3). Specifically, warm-weather conditions extended survival duration, while low temperatures shortened the survival of E. coli in deer pellets more than in the other environmental media examined. This further highlights the need for caution when one is predicting the fate and transport of microorganisms associated with white-tailed deer. Using parameters of E. coli survival obtained for media other than deer fecal material in fate and transport models is likely to produce misleading results.
There is another concern regarding the use of results and parameters of bacterial survival studies for long-term predictions of microbial fate and transport on large (i.e., watershed) scales. Despite a large number of publications on factors affecting E. coli growth and die-off, there are no standard protocols for survival experiments and data processing. Experiments are typically carried out in a laboratory with controlled conditions, such as moisture content, temperature, pH, exposure to UV light, etc., or in uncontrolled field conditions with temporally and spatially variable microbial inputs and growing conditions. Different experimental scales, conditions, bacterial strains, and medium preparation make results of survival experiments difficult to compare and introduce uncertainty into the model parameter estimates, which leads to uncertainty in the model predictions that is difficult to evaluate. Pachepsky et al. (25) have pointed out that the uncertainty in model inputs does not preclude modeling of microbial fate and transport; however, it needs to be factored into simulations. Therefore, new side-by-side experiments with different fecal materials under the same environmental conditions, as well as experiments with the same material under different environmental conditions, are needed to evaluate the variability in bacterial survival and to account for it in the model parameters.
Release experiment.
In order to explore how release of E. coli from deer pellets compares with E. coli release from other sources, we summarized the values of the two parameters, a and β, of the release model (equation 3) obtained in earlier microbial-release studies (Table 3). In our earlier work, we demonstrated that the parameter a can be used as a characteristics of the erodibility for the E. coli source material (40) and that it is influenced by several factors, including manure properties, raindrop energy, and salinity of irrigation water. The larger the a values, the faster the applied manure is depleted of E. coli. The values of a in studies by Bradford and Schijven (41) and Schijven et al. (42) were lowest in mist irrigation, intermediate in drip irrigation, and highest in sprinkle irrigation applied to bare soil plots. This order coherently indicates the increasing manure erodibility caused by increasing raindrop energy in the order mist, drip, and sprinkle irrigation. The value of a in our study was very close to the values estimated from drip irrigation by Bradford and Schijven (41) and Schijven et al. (42). Therefore, we can surmise that deer pellets have erodibility similar to that of the dairy manure disks used in their studies. Note that Cryptosporidium parvum oocysts and Giardia duodenalis cysts were used in the studies by Bradford and Schijven (41) and Schijven et al. (42) and that to convert the values of a from cm−3, used in model fitting in this study, to cm−1, used in previous studies, we assumed that the contact area of water drops with deer pellets was approximately 0.07 cm2. The parameter β in equation 3 determines the shape of the release curve and may vary greatly for the same manure types (Table 3). The value of β for the deer pellets in our study was smaller than those for dairy manure disks and larger than those for dairy slurry.
To illustrate the effect of parameters a and β on the E. coli release curves, we plotted the relative cumulative number of released microbial cells (M/M0) as a function of time for the unit water application rate and the parameter values shown in Table 3 (Fig. 6). As expected, the release of microorganisms from drip-irrigated manure was much slower than that from the sprinkle-irrigated manure slurries, while the release from deer pellets of this study was intermediate between drip and sprinkle irrigation. Based on data published by Laws (70), water drops reached approximately 34% of terminal velocity in this study. This implies that the release of E. coli from pellets on non-vegetation-bearing surfaces during real rainfall events can be much faster than that observed under the laboratory conditions of our study.
FIG 6.
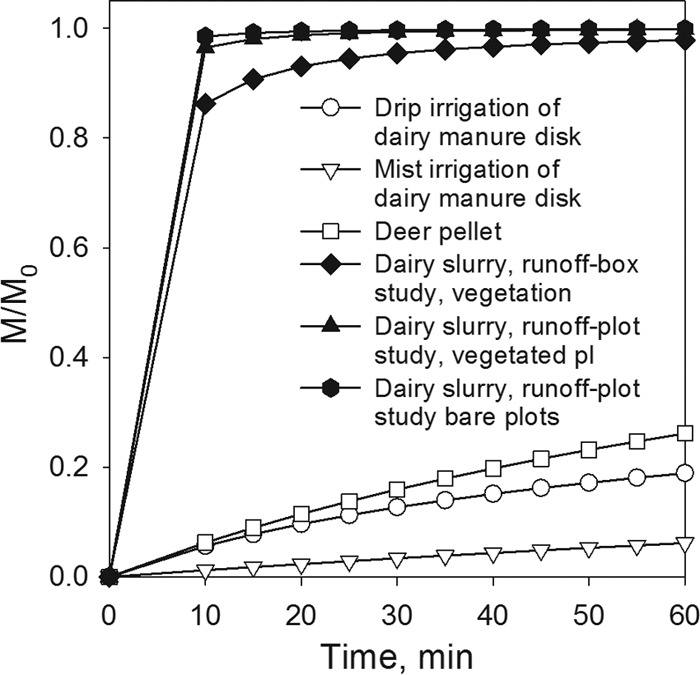
Hypothetical cumulative curves of bacterial release from manure computed with parameter values shown in Table 3.
On vegetation-bearing surfaces undergoing sprinkle irrigation or intensive rainfalls, the E. coli organisms released with fecal colloids from fecal deer deposits can be splashed onto leaf surfaces, where they can survive for a long period of time. Islam et al. (71) reported E. coli O157:H7 survival in lettuce and parsley for up to 77 and 177 days, respectively. Current regulations in some parts of the country require the establishment of no-harvest buffer zones with minimally a 5-foot radius around spots contaminated by animal intrusion (72). However, these spots can be difficult to identify due to decomposition of the fecal material and washing off with rainfall or irrigation water, while pathogenic bacteria splashed from unidentified spots can still persist in leafy greens. Therefore, preharvest and daily harvest assessments of animal hazards may turn out to be not very efficient in preventing the contamination of leafy greens.
It should be noted that the values of the release parameters shown in Table 3 are estimated for fresh manure material and thus are likely to be different from the values in aged deposits. Several studies reported that fecal coliform (FC) concentrations in the released suspension change with manure age (34–36). Specifically, Kress and Gifford (36) found that peak FC concentrations in suspensions released from standard cattle cowpats declined with age of fecal material. They attributed the decrease to progressive FC leaching from the fecal deposits during recurrent rainfalls. Springer et al. (34) and Thelin and Gifford (35) reported similar decreases in the deposits subjected to rainfall, but they also observed an increase in the FC concentrations released from deposits not subjected to rainfall as their age increased from 2 to 5 days. They explained the observed differences in the released FC concentrations by the kinetics of FC growth and die-off in fecal deposits. By analyzing the effect of the age of artificial dairy cowpats on E. coli concentrations in runoff, Muirhead et al. (37) observed an increase in concentration of bacteria in runoff water during the first 2 weeks caused by E. coli growth in the deposits.
Based on the growth kinetics of the E. coli and the relatively high water content in the deer pellet measured within the first 4 to 8 days of the incubation in our study (Fig. 1 and 2), one can expect the maximum released concentration of E. coli to occur at the end of the bacterial growing stage at 20°C. This was the reason for using 4-day-aged feces in this study. However, it remains to be seen whether and to what extent the age, water content, and initial bacterial concentration affect E. coli release kinetics and parameters of the release model in deer pellets.
Result of this study indicated that the risk of microbial release and transport from deer feces is maximal in warm and wet weather conditions. The climate of the Midwest region of the United States is getting warmer and more variable. Higher probabilities of hot days (over 32°C), extremely hot days (over 38°C), numbers of days per year with more than 2 in. of rain, and maximum 24-h, 5-day, and 7-day rainfall totals are being expected in the next several decades (73). Increasing temperatures will likely result in faster E. coli growth and in overall higher concentrations of E. coli in deer fecal deposits compared to those occurring under the current climate conditions. More intensive precipitation will facilitate release of microorganisms from the deposits; therefore, more bacteria can potentially be transported with overland flow and cause further impairment of water bodies. To address the growing risks, reliable information about microbial growth and release from livestock and wildlife deposits is imperative. A lack of such information hinders the progress in development of better management practices for landscapes with mixed agricultural and wildlife use.
Conclusions.
Our study represents the first report of E. coli survival and release in feces of white-tailed deer. Previous survival studies were conducted mostly with feces of domestic animals, manure-amended soils, sediment, and water, while previous E. coli release studies were conducted only with artificial cowpats and manure slurry. Parameters of the survival model obtained for E. coli in this study substantially differed from those obtained with other source materials, e.g., feces of domestic animals and manures. This emphasizes the necessity of comprehensive studies of survival and release of naturally occurring populations of microorganisms in wildlife animal feces in order to achieve better predictions of microbial fate and transport in fragmented agricultural and forest landscapes and for development of better management practices to prevent impairment of bodies of water by microorganisms associated with wildlife. The results of the current study suggest that warm wet weather conditions enhance growth and facilitate release of E. coli from deer feces into the environment. This is especially important with respect to expected climate changes in the Midwest region of the United States.
ACKNOWLEDGMENTS
The work was supported through the Water Initiative Research Grant “Multimodeling framework for predicting fate and transport of pathogens originated from wildlife and livestock interactions in fragmented agriculture-forest ecosystems” of the Center for Water Sciences and Environmental Science and Policy Program of Michigan State University.
We thank Daniel Ginzburg from Michigan State University for technical assistance in the experimental part of this study. We are also thankful to three anonymous reviewers for the comments that we believe improved the manuscript.
REFERENCES
- 1.U.S. EPA. 2014. Specific state causes of impairment that make up the national pathogens cause of impairment group. U.S. Environmental Protection Agency, Washington DC: http://iaspub.epa.gov/tmdl_waters10/attains_nation_cy.cause_detail_303d?p_cause_group_id=861 Accessed 20 September 2014. [Google Scholar]
- 2.Jones DL. 1999. Potential health risks associated with the persistence of Escherichia coli O157 in agricultural environments. Soil Use Manage 15:76–83. [Google Scholar]
- 3.Chapman PA. 2000. Sources of Escherichia coli O157 and experiences over the past 15 years in Sheffield, UK. Symp Ser Soc Appl Microbiol 88:51S–60S. doi: 10.1111/j.1365-2672.2000.tb05332.x. [DOI] [PubMed] [Google Scholar]
- 4.Gallagher MA, Karthikeyan R, Mukhtar S. 2012. Growth kinetics of wildlife E. coli isolates in soil and water. J Environ Prot 3:838–846. doi: 10.4236/jep.2012.328098. [DOI] [Google Scholar]
- 5.Borczyk AA, Karmali MA, Lior H, Duncan LMC. 1987. Bovine reservoir for verotoxin-producing Escherichia coli O157:H7. Lancet i:98. [DOI] [PubMed] [Google Scholar]
- 6.Řrskov F, Řrskov I, Villar JA. 1987. Cattle as reservoir of verotoxin-producing Escherichia coli O157:H7. Lancet ii:276. [DOI] [PubMed] [Google Scholar]
- 7.Zhao T, Doyle MP, Shere J, Garber L. 1995. Prevalence of enterohemorrhagic Escherichia coli O157:H7 in a survey of dairy herds. Appl Environ Microbiol 61:1290–1293. [DOI] [PMC free article] [PubMed] [Google Scholar]
- 8.Daszak P, Cunningham AA, Hyatt AD. 2000. Emerg Infect Dis of wildlife threats to biodiversity and human health. Science 287:443–449. doi: 10.1126/science.287.5452.443. [DOI] [PubMed] [Google Scholar]
- 9.Ishii S, Hansen D, Hicks R, Sadowsky M. 2007. Beach sand and sediments are temporal sinks and sources of Escherichia coli in Lake Superior. Environ Sci Technol 41:2203–2209. doi: 10.1021/es0623156. [DOI] [PubMed] [Google Scholar]
- 10.Parajuli P. 2007. SWAT bacteria sub-model evaluation and application. Ph.D. thesis Kansas State University, Manhattan, KS. [Google Scholar]
- 11.Harmel RD, Karthikeyan R, Gentry T, Srinivasan R. 2010. Effects of agricultural management, land use, and watershed scale on E. coli concentrations in runoff and streamflow. Trans ASABE 53:1833–1841. doi: 10.13031/2013.35809. [DOI] [Google Scholar]
- 12.Wahlström H, Tysen E, Olsson Engvall E, Brändström B, Eriksson E, Mörner T, Vĺgsholm I. 2003. Survey of Campylobacter species, VTEC O157 and Salmonella species in Swedish wildlife. Vet Rec 153:74–80. doi: 10.1136/vr.153.3.74. [DOI] [PubMed] [Google Scholar]
- 13.Jay MT, Cooley M, Carychao D, Wiscomb GW, Sweitzer RA, Crawford-Miksza L, Farrar JA, Lau DK, O'Connell J, Millington A, Asmundson RV, Atwill ER, Mandrell RE. 2007. Escherichia coli O157:H7 in feral swine near spinach fields and cattle, central California coast. Emerg Infect Dis 13:1908–1911. doi: 10.3201/eid1312.070763. [DOI] [PMC free article] [PubMed] [Google Scholar]
- 14.Cooley M, Carychao D, Crawford-Miksza L, Jay MT, Myers C, Rose C, Keys C, Farrar J, Mandrell RE. 2007. Incidence and tracking of Escherichia coli O157:H7 in a major produce production region in California. PLoS One 2:e1159. doi: 10.1371/journal.pone.0001159. [DOI] [PMC free article] [PubMed] [Google Scholar]
- 15.Parker CT, Kyle JL, Huynh S, Carter MQ, Brandl MT, Mandrell RE. 2012. Distinct transcriptional profiles and phenotypes exhibited by Escherichia coli O157:H7 isolates related to the 2006 spinach-associated outbreak. Appl Environ Microbiol 78:455–463. doi: 10.1128/AEM.06251-11. [DOI] [PMC free article] [PubMed] [Google Scholar]
- 16.Rice DH, Hancock DD, Besser TE. 1995. Verotoxigenic E. coli O157 colonisation of wild deer and range cattle. Vet Rec 137:524. doi: 10.1136/vr.137.20.524. [DOI] [PubMed] [Google Scholar]
- 17.Sargeant JM, Hafer DJ, Gillespie JR, Oberst RD, Flood SJ. 1999. Prevalence of Escherichia coli O157:H7 in white-tailed deer sharing rangeland with cattle. J Am Vet Med Assoc 215:792–794. [PubMed] [Google Scholar]
- 18.Renter DG, Sargeant JM, Hygnstrom SE, Hoffmann JD, Gillespie JR. 2001. Escherichia coli O157:H7 in free-ranging deer in Nebraska. J Wildl Dis 37:755–760. doi: 10.7589/0090-3558-37.4.755. [DOI] [PubMed] [Google Scholar]
- 19.Laidler MR, Tourdjman M, Buser GL, Hostetler T, Repp KK, Leman R, Samadpour M, Keene WE. 2013. Escherichia coli O157:H7 infections associated with consumption of locally grown strawberries contaminated by deer. Clin Infect Dis 57:1129–1134. doi: 10.1093/cid/cit468. [DOI] [PubMed] [Google Scholar]
- 20.Cody SH, Glynn MK, Farrar JA, Cairns KL, Griffin PM, Kobayashi J, Fyfe M, Hoffman R, King AS, Lewis JH, Swaminathan B, Bryant RG, Vugia DJ. 1999. An outbreak of Escherichia coli O157:H7 infection from unpasteurized commercial apple juice. Ann Intern Med 130:202–209. doi: 10.7326/0003-4819-130-3-199902020-00005. [DOI] [PubMed] [Google Scholar]
- 21.Branham LA, Carr MA, Scott CB, Callaway TR. 2005. E. coli O157:H7 and Salmonella spp. in white-tailed deer and livestock. Curr Issues Intest Microbiol 6:25–29. [PubMed] [Google Scholar]
- 22.Tate RL. 1978. Cultural and environmental factors affecting the longevity of Escherichia coli in histosols. Appl Environ Microbiol 35:925–929. [DOI] [PMC free article] [PubMed] [Google Scholar]
- 23.Crane SR, Moore JA. 1986. Modeling enteric bacterial die-off: a review. Water Air Soil Pollut 27:411–439. doi: 10.1007/BF00649422. [DOI] [Google Scholar]
- 24.Jamieson RC, Gordon RJ, Sharples KE, Stratton GW, Madani A. 2002. Movement and persistence of fecal bacteria in agricultural soils and subsurface drainage water: a review. Can Biosystems Eng 44:1.1–1.9. [Google Scholar]
- 25.Pachepsky YA, Sadeghi AM, Bradford SA, Shelton DR, Guber AK, Dao T. 2006. Transport and fate of manure-borne pathogens: modeling perspective. Agric Water Manage 86:81–92. doi: 10.1016/j.agwat.2006.06.010. [DOI] [Google Scholar]
- 26.Reddy KR, Khaleel R, Overcash MR. 1981. Behavior and transport of microbial pathogens and indicator organisms in soils treated with organic wastes. J Environ Qual 10:255–266. doi: 10.2134/jeq1981.00472425001000030001x. [DOI] [Google Scholar]
- 27.Mubiru DN, Coyne MS, Grove JH. 2000. Mortality of Escherichia coli O157:H7 in two soils with different physical and chemical properties. J Environ Qual 29:1821–1825. doi: 10.2134/jeq2000.00472425002900060012x. [DOI] [Google Scholar]
- 28.Gerba CP, Wallis C, Melnick JL. 1975. Fate of wastewater bacteria and viruses in soil. J Irrig Drain Eng 101:157–174. [Google Scholar]
- 29.Ellis JR, McCalla TM. 1976. Fate of pathogens in soils receiving animal wastes—a review. Paper no. 762560. ASAE, St. Joseph, MI. [Google Scholar]
- 30.Hendricks CW. 1972. Enteric bacterial growth rates in river water. Appl Microbiol 24:168–174. [DOI] [PMC free article] [PubMed] [Google Scholar]
- 31.Filip Z, Kaddu-Mulindwa D, Milde G. 1988. Survival of some pathogenic and facultative pathogenic bacteria in groundwater. Water Sci Technol 20:227–231. [Google Scholar]
- 32.Flint KP. 1987. The long-term survival of Escherichia coli in river water. J Appl Bacteriol 63:261–270. doi: 10.1111/j.1365-2672.1987.tb04945.x. [DOI] [PubMed] [Google Scholar]
- 33.Kiefer LA, Shelton DR, Pachepsky Y, Blaustein R, Santin-Duran M. 2012. Persistence of Escherichia coli introduced into streambed sediments with goose, deer and bovine animal waste. Lett Appl Microbiol 55:345–353. doi: 10.1111/j.1472-765X.2012.03296.x. [DOI] [PubMed] [Google Scholar]
- 34.Springer EP, Gifford GF, Windham MP, Thelin R, Kress M. 1983. Fecal coliform release studies and development of a preliminary nonpoint source transport model for indicator bacteria. Utah Water Res Laboratory, Utah State University, Logan, UT. [Google Scholar]
- 35.Thelin R, Gifford GF. 1983. Fecal coliform release pattern from fecal material of cattle. J Environ Qual 12:57–63. doi: 10.2134/jeq1983.00472425001200010008x. [DOI] [Google Scholar]
- 36.Kress M, Gifford GF. 1984. Fecal coliform release from cattle fecal deposits. Water Resour Bull 20:61–66. doi: 10.1111/j.1752-1688.1984.tb04642.x. [DOI] [Google Scholar]
- 37.Muirhead RW, Collins RP, Bremer PJ. 2005. Erosion and subsequent transport state of Escherichia coli from cowpats. Appl Environ Microbiol 71:2875–2879. doi: 10.1128/AEM.71.6.2875-2879.2005. [DOI] [PMC free article] [PubMed] [Google Scholar]
- 38.Guber AK, Karns JS, Pachepsky YA, Sadeghi AM, Van Kessel JS, Dao TH. 2007. Comparison of release and transport of manure-borne Escherichia coli and enterococci under grass buffer conditions. Lett Appl Microbiol 44:161–167. doi: 10.1111/j.1472-765X.2006.02065.x. [DOI] [PubMed] [Google Scholar]
- 39.Guber AK, Shelton DR, Sadeghi AM, Sikora LJ, Pachepsky YA. 2006. Rainfall-induced release of fecal coliforms and other manure constituents: comparison and modeling. Appl Environ Microbiol 72:7531–7539. doi: 10.1128/AEM.01121-06. [DOI] [PMC free article] [PubMed] [Google Scholar]
- 40.Guber AK, Pachepsky YA, Dao TH, Shelton DR, Sadeghi AM. 2013. Evaluating manure release parameters for nonpoint contaminant transport model KINEROS2/STWIR. Ecol Model 263:126–138. doi: 10.1016/j.ecolmodel.2013.05.008. [DOI] [Google Scholar]
- 41.Bradford SA, Schijven J. 2002. Release of Cryptosporidium and Giardia from dairy calf manure: Impact of solution salinity. Environ Sci Technol 36:3916–3923. doi: 10.1021/es025573l. [DOI] [PubMed] [Google Scholar]
- 42.Schijven JF, Bradford SA, Yang S. 2004. Release of Cryptosporidium and Giardia from dairy cattle manure: physical factors. J Environ Qual 33:1499–1508. doi: 10.2134/jeq2004.1499. [DOI] [PubMed] [Google Scholar]
- 43.Guber AK, Yakirevich AM, Sadeghi AM, Pachepsky YA, Shelton DR. 2009. Uncertainty evaluation of coliform bacteria removal from vegetated filter strip under overland flow condition. J Environ Qual 38:1636–1644. doi: 10.2134/jeq2008.0328. [DOI] [PubMed] [Google Scholar]
- 44.Guber AK, Pachepsky YA, Yakirevich AM, Shelton DR, Sadeghi AM, Goodrich DC, Unkrich CL. 2012. STWIR, a microorganism transport with infiltration and runoff add on module for the KINEROS2 runoff and erosion model: documentation and user manual. USDA-ARS, Beltsville, MD: https://www.msu.edu/~akguber/files/STWIR/Manual-STWIR2012.pdf. [Google Scholar]
- 45.Guber AK, Pachepsky YA, Yakirevich AM, Shelton DR, Sadeghi AM, Goodrich D, Unkrich K. 2011. Uncertainty in modeling of faecal coliform overland transport associated with manure application in Maryland. Hydrol Process 25:2393–2404. doi: 10.1002/hyp.8003. [DOI] [Google Scholar]
- 46.Rice EW, Baird RB, Eaton AD, Clesceri LS, Bridgewater L (ed). 2012. Standard methods for the examination of water and wastewater, 22nd ed. American Public Health Association, Washington, DC. [Google Scholar]
- 47.Chick H. 1908. An investigation of the law of disinfection. J Hyg 8:92–158. doi: 10.1017/S0022172400006987. [DOI] [PMC free article] [PubMed] [Google Scholar]
- 48.Wang G, Zhao T, Doyle MP. 1996. Fate of enterohemorrhagic Escherichia coli O157:H7 in bovine feces. Appl Environ Microbiol 62:2567–2570. [DOI] [PMC free article] [PubMed] [Google Scholar]
- 49.Wang L, Mankin KR, Marchin GL. 2004. Survival of fecal bacteria in dairy cow manure. Trans ASAE 47:1239–1246. doi: 10.13031/2013.16574. [DOI] [Google Scholar]
- 50.Himathongkham S, Bahari S, Riemann H, Cliver D. 1999. Survival of Escherichia coli O157:H7 and Salmonella typhimurium in cow manure and cow manure slurry. FEMS Microbiol Let 178:251–257. doi: 10.1111/j.1574-6968.1999.tb08684.x. [DOI] [PubMed] [Google Scholar]
- 51.Moriarty EM, Mackenzie ML, Karki N, Sinton LW. 2011. Survival of Escherichia coli, enterococci, and Campylobacter spp. in sheep feces on pastures. Appl Environ Microbiol 77:1797–1803. doi: 10.1128/AEM.01329-10. [DOI] [PMC free article] [PubMed] [Google Scholar]
- 52.Sinegani AAS, Maghsoudi J. 2011. The effect of soil water potential on survival of fecal coliforms in soil treated with organic wastes under laboratory conditions. African J Microbiol Res 5:229–240. [Google Scholar]
- 53.Howell JM, Coyne MS, Cornelius PL. 1996. Effect of sediment particle size and temperature on fecal bacteria mortality rates and the fecal coliform/fecal streptococci ratio. J Environ Qual 25:1216–1220. doi: 10.2134/jeq1996.00472425002500060007x. [DOI] [Google Scholar]
- 54.McFeters GA, Stuart DG. 1972. Survival of coliform bacteria in natural waters: field and laboratory studies with membrane-filter chambers. Appl Microbiol 24:805–811. [DOI] [PMC free article] [PubMed] [Google Scholar]
- 55.Garzio-Hadzick A, Shelton DR, Hill RL, Pachepsky YA, Guber AK, Rowland R. 2010. Survival of manureborne E. coli in streambed sediment: effects of temperature and sediment properties. Water Res 44:2753–2762. doi: 10.1016/j.watres.2010.02.011. [DOI] [PubMed] [Google Scholar]
- 56.Van Donsel DJ, Geldreich EE, Clarke NA. 1967. Seasonal variations in survival of indicator bacteria in soil and their contribution to storm-water pollution. Appl Environ Microbiol 15:1362–1370. [DOI] [PMC free article] [PubMed] [Google Scholar]
- 57.Doran JW, Linn DM. 1979. Bacteriological quality of runoff water from pastureland. Appl Environ Microbial 37:985–991. [DOI] [PMC free article] [PubMed] [Google Scholar]
- 58.Crane SR, Westerman PW, Overcash MR. 1980. Die-off of fecal indicator organisms following land application of poultry manure. J Environ Qual 9:531–537. doi: 10.2134/jeq1980.00472425000900030042x. [DOI] [Google Scholar]
- 59.Faust MA, Aotaky AE, Hargadon MT. 1975. Effect of parameters on the in situ survival of Escherichia coli MC-6 in an estuarine environment. Appl Microbiol 30:800–806. [DOI] [PMC free article] [PubMed] [Google Scholar]
- 60.Shaw MK, Murr AC, Ingraham JL. 1971. Determination of the minimal temperature for growth of Escherichia coli. J Bacteriol 105:683–684. [DOI] [PMC free article] [PubMed] [Google Scholar]
- 61.Broeze RJ, Solomon CJ, Pope DH. 1978. Effects of low temperature on in vivo and in vitro protein synthesis in Escherichia coli and Pseudomonas fluorescens. J Bacteriol 134:861–874. [DOI] [PMC free article] [PubMed] [Google Scholar]
- 62.Das HK, Goldstein A. 1968. Limited capacity for protein synthesis at zero degrees centigrade in Escherichia coli. J Mol Biol 31:209–226. doi: 10.1016/0022-2836(68)90440-3. [DOI] [PubMed] [Google Scholar]
- 63.Friedman H, Lu P, Rich A. 1971. Temperature control of initiation of protein synthesis in Escherichia coli. J Mol Biol 61:105–121. doi: 10.1016/0022-2836(71)90209-9. [DOI] [PubMed] [Google Scholar]
- 64.Martinez G, Pachepsky YA, Shelton DR, Whelan G, Zepp R, Molina M, Panhorst K. 2013. Using the Q10 model to simulate E. coli survival in cowpats on grazing lands. Environ Intern 54:1–10. doi: 10.1016/j.envint.2012.12.013. [DOI] [PubMed] [Google Scholar]
- 65.Klein DA, Casida LE. 1967. Escherichia coli die-out from normal soil as related to nutrient availability and the indigenous microflora. Can J Microbiol 13:1461–1470. doi: 10.1139/m67-194. [DOI] [PubMed] [Google Scholar]
- 66.Canale RP, Patterson RL, Gannon JJ, Powers WF. 1973. Water quality models for total coliform. J Water Poll Control Fed 45:325–336. [PubMed] [Google Scholar]
- 67.Sjogren R. 1994. Prolonged survival of an environmental Escherichia coli in laboratory soil microcosms. Water Air Soil Pollut 75:389–403. doi: 10.1007/BF00482948. [DOI] [Google Scholar]
- 68.Antheunisse J, Arkesteijn-Dijksman L. 1979. Rate of drying and the survival of microorganisms. Antonie Van Leeuwenhoek 45:177–184. doi: 10.1007/BF00418582. [DOI] [PubMed] [Google Scholar]
- 69.Padia R. 2010. Occurrence and fate of Escherichia coli from nonpoint sources in Cedar creek watershed, Texas. M.S. thesis Texas A&M University, College Station, TX. [Google Scholar]
- 70.Laws JO. 1941. Measurements of the fall-velocity of water drops and raindrops. Trans Am Geophys Union 22:709–721. doi: 10.1029/TR022i003p00709. [DOI] [Google Scholar]
- 71.Islam M, Doyle MP, Phatak SC, Millner P, Jiang X. 2004. Persistence of enterohemorrhagic Escherichia coli O157:H7 in soil and on leaf lettuce and parsley grown in fields treated with contaminated manure composts or irrigation water. J Food Prot 67:1365–1370. [DOI] [PubMed] [Google Scholar]
- 72.Leafy Green Marketing Agreement. 2013. Commodity specific food safety guidelines for the production and harvest of lettuce and leafy greens. http://www.lgma.ca.gov/wp-content/uploads/2014/09/California-LGMA-metrics-08-26-13-Final.pdf Accessed 26 November 2014.
- 73.Hayhoe K, VanDorn J, Naik V, Wuebbles D. 2014. Climate change in the Midwest. Projections of future temperature and precipitation. http://www.ucsusa.org/assets/documents/global_warming/midwest-climate-impacts.pdf Accessed 26 November 2014.