

Abstract
Objective
Febrile seizures (FS) are the most common seizure type in young children. Complex FS are a risk factor for mesial temporal lobe epilepsy (mTLE). To identify new FS susceptibility genes we used a forward genetic strategy in mice and subsequently analyzed candidate genes in humans.
Methods
We mapped a quantitative trait locus (QTL1) for hyperthermia-induced FS on mouse chromosome 1, containing the signal recognition particle 9 (Srp9) gene. Effects of differential Srp9 expression were assessed in vivo and in vitro. Hippocampal SRP9 expression and genetic association were analyzed in FS and mTLE patients.
Results
Srp9 was differentially expressed between parental strains C57BL/6J and A/J. Chromosome substitution strain 1 (CSS1) mice exhibited lower FS susceptibility and Srp9 expression than C57BL/6J mice. In vivo knockdown of brain Srp9 reduced FS susceptibility. Mice with reduced Srp9 expression and FS susceptibility, exhibited reduced hippocampal AMPA and NMDA currents. Downregulation of neuronal Srp9 reduced surface expression of AMPA receptor subunit GluA1. mTLE patients with antecedent FS had higher SRP9 expression than patients without. SRP9 promoter SNP rs12403575(G/A) was genetically associated with FS and mTLE.
Interpretation
Our findings identify SRP9 as a novel FS susceptibility gene and indicate that SRP9 conveys its effects through endoplasmic reticulum (ER)-dependent synthesis and trafficking of membrane proteins, such as glutamate receptors. Discovery of this new FS gene and mechanism may provide new leads for early diagnosis and treatment of children with complex FS at risk for mTLE.
Introduction
Febrile seizures (FS) occur in 2–5% of children between the age of 6 months and 5 years.1 Of these affected children, 30–40% develops complex FS.2 Prolonged or complex FS last more than 15 min, are often recurrent, and increase the risk of developing mesial temporal lobe epilepsy (mTLE) later in life.2 Genetic factors appear to play an important role in determining FS susceptibility. About 25% of children experiencing FS have a positive family history and concordance for FS is about 40–60% in monozygotic twins, but only 10–20% in dizygous twins.3,4 Several mutations have been identified in families with FS or complex epilepsy syndromes with FS as a central feature, such as generalized epilepsy with FS (GEFS+) (for review see5), but the genetic factors involved in common forms of FS remain elusive. The aim of this study was to identify new human FS susceptibility genes starting from a phenotype-driven genetic strategy in mice.
Prolonged experimental FS can be elicited in rats by inducing hyperthermia.6–8 To study the complex genetics of FS we have adapted this model to mice, enabling large-scale phenotypic screening of inbred strains for FS susceptibility.9,10 Using this phenotypic screen on inbred mice we established that FS susceptibility is distinct from susceptibility for electrically- or chemically induced seizures.9,10 Subsequently, we performed a phenotype-driven screen for FS susceptibility employing the C57BL/6J-Chr#A/NaJ chromosome substitution (CSS) panel11 and found that chromosome 1 (CSS1) has a strong contribution to FS susceptibility.10 This panel has proven to be a powerful tool in detecting quantitative trait loci for complex traits in a relatively small number of F2 animals.11–13
Here, we mapped a quantitative trait locus (QTL) for FS susceptibility on chromosome 1 and identified signal recognition particle 9 (Srp9) as a FS susceptibility gene in mice. Subsequent expression and association studies in FS and mTLE patients provide compelling evidence for a role of SRP9 and endoplasmic reticulum (ER)-dependent protein synthesis in human FS susceptibility. Interestingly, similar local protein synthesis pathways were recently implicated in disorders with high comorbidity with epilepsy, such as Fragile X and autism.14,15
Materials and Methods
Animals
C57BL/6J and C57BL/6J-Chr 1A/NaJ (CSS1 and CSS2) mice were obtained from The Jackson Laboratory (Bar Harbor, ME). We generated a CSS1-F2 by intercrossing F1 hybrid animals from a (reciprocal) outcross between CSS1 and C57BL/6J (n = 129; 28 males, 31 females; 36 males and 34 females originating from CSS1 and C57BL/6J mothers, respectively), which was pheno- and genotyped (10). Animals were kept in a controlled 12 h light–dark cycle (light on 7.00 am to 7.00 pm) with a room temperature of 22 ± 1°C and a humidity of 60%. Food and water were available ad libitum (2111 RMH-TM diet; Hope Farms, Woerden, The Netherlands). All animals were housed in Plexiglas cages (Macrolon type II, Techniplast, Milan, Italy) with sawdust bedding and a paper tissue for nest building. All experimental procedures were approved by the Animal Ethics Committee of Utrecht University.
QTL analysis
FS susceptibility (phenotyping) was determined by inducing hyperthermia in P14 pups by exposure to a warm-air stream and measuring the latency to tonic-clonic seizures (FSL).10 Genomic DNA isolated from spleen was genotyped using SNP and microsatellite markers (Table S1) across chromosome 1, selected based on allelic differences between C57BL/6J and A/J.12 After map construction, QTL location and variance explained by each locus was determined using MapQTL (version 4.0; Kyazma, Wageningen, the Netherlands).12,13
Microarray analysis, in situ hybridization and immunohistochemistry
cDNA of P14 C57BL/6J (n = 3) and CSS1 (n = 3) brains was analyzed by two-color oligonucleotide microarray analysis.16,17 Radioactive in situ hybridization on coronal (16 μm) cryosections from naïve P14 CSS1 (n = 5) and C57BL/6J (n = 6) brains and Srp9 (anti)sense oligo's intracerebroventricularly (ICV) injected animals were quantified with ImageJ (version 1.4.0) and expressed as nCi/g.13 Controls with sense probes were devoid of signal. In (anti)sense injected animals transcript levels were quantified in the whole ipsilateral cortex in serial sections 320 μm before and 320 μm behind the injection site. Penetration of probes after ICV injection was verified using fluorescent Fluorescein (FIC) labeled oligos (Sigma-Aldrich, Zwijndrecht, the Netherlands) (Fig. S1). (Anti)sense probes were synthesized using mouse RNA as a template (Primers, Table S2) (Sigma-Aldrich, The Netherlands). Immunocytochemistry18 on 7 μm paraffin sections from P14 C57BL/6J and CSS1 mouse brains (n = 13) using Srp9 antibody (dilution 1:500; Ptglab, Chicago, IL) was quantified with ImageJ and expressed as percentage of C57BL/6J staining. Protein expression was analyzed blinded by two independent observers. Preabsorption of the antibody with a 10-fold excess of antigen (Ptglab, USA) abolished all staining.
Functional interference studies in mice
Srp9 antisense (T*G*A*G*GCATCGTGGCT*T*C*A*G*G; n = 12, *=phosphorothioate bond) or scrambled (Scr-1:T*C*A*G*G*GTACGCGTCGT*A*G*C*G*T*, n = 12; Scr-2:G*C*G*T*T*GCAAAGTCGGA*C*T*T*G*G, n = 10) oligonucleotides (18 nmol/L) (Sigma-Aldrich, The Netherlands) were ICV injected (1.5 μL in 5 min) in anesthetized P14 C57BL/6J mice 20 h prior to hyperthermia induction. Cycloheximide (20 mg/kg; Sigma, St. Louis, MO), rapamycin (30 mg/kg; Santa Cruz Biotechnology, Dallas, TX), or saline were injected intraperitoneally (IP) in P14 C57BL/6J mice (n = 9 per group) 20 or 30 min before hyperthermia induction, respectively. Latencies were determined blinded by two independent observers.
Electrophysiology
Voltage-clamp recordings were made from CA1 neurons in hippocampal slices from P14 C57BL/6J (n = 6) or CSS1 (n = 6) mice.19 One slice at a time was placed in a recording chamber, continuously perfused with artificial cerebrospinal fluid (ACSF) at 32°C, consisting of 120 mmol/L NaCl, 3.5 mmol/L KCl, 1.3 mmol/L MgCl2, 2.5 mmol/L CaCl2, 25 mmol/L NaHCO3, 1.25 mmol/L KH2PO4, and 10 mmol/L d-glucose, pH 7.4. Bicucclline methiodide (20 μmol/L, Enzo Life Sciences, Lorrach, Germany) was added to the ACSF to prevent gamma-aminobutyric acid-mediated inhibition. Whole cell recordings were established with patch clamp electrodes (impedance 4–6 MΩ, 1.5 mm outer diameter, 0.86 mm inner diameter, Harvard Apparatus LTD, Kent, U.K.) containing an intracellular pipette solution of 120 mmol/L Cs methanesulfonate, 17.5 mmol/L CsCl, 10 mmol/L Hepes, 5 mmol/L 1,2-bis(o-aminophenoxy)ethane-N,N,N,N-tetraacitic acid, 2 mmol/L MgATP, 0.1 mmol/L NaGTP, and 10 mmol/L QX-314, pH 7.4, adjusted with CsOH. The signals were recorded using a patch clamp amplifier (Axopatch 200B; Molecular Devices, Sunnyvale, CA). A concentric bipolar electrode (outer pole 200 μm stainless steel, inner pole 25 μm Pt/Ir, FHC; Bowdoin, ME) was placed in the dendritic layer of the CA1 area. Input-output curves of the excitatory postsynaptic currents (EPSCs) were evoked at a holding potential of −70 mV to determine the half maximal stimulus intensity. The stimulus intensities ranged from 7 to 600 μA. The half maximal stimulus intensity was used to evoke EPSCs at holding potentials between −90 and +50 mV. AMPA current amplitudes were measured at −90 mV (C57BL/6J: 27 cells, CSS1: 28 cells) and NMDA currents at 50 mV (C57BL/6J: 27 cells, CSS1: 24 cells) (Fig. 3A).
Figure 3.
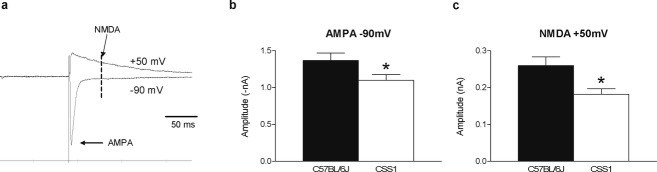
Reduced levels of Srp9 are associated with reduced glutamate receptor currents. Voltage-clamp recordings of CA1 neurons in hippocampal slices of P14 mice. (A) AMPA current amplitudes were measured at −90 mV, NMDA current amplitudes at +50 mV. Quantification of the amplitudes revealed smaller AMPA (B; t53 = 2.098, P = 0.041, C57BL/6J (n = 27); 1.37 ± 0.1 CSS1 (n = 28); 1.10 ± 0.1) and NMDA currents (C; t49 = 2.687, P = 0.01, C57BL/6J (n = 27); 0.26 ± 0.02 CSS1 (n = 24); 0.18 ± 0.01) in CSS1 compared to C57BL/6J mice.
Srp9-shRNA transfection
Functionally active Srp9-shRNAs (shRNA#1: GAGACCAGCCTGTGTCCTA and shRNA#2: GAGTAGGAATGTCAGGGTT) were constructed based on their potency (4 ON-TARGETplus Srp9 siRNA, Dharmacon) to knockdown Srp9 in transfected Neuro2A cells measured by Western blot. Primary rat hippocampal cultures (E18)20,21 were transfected at 14 days in vitro and co-transfected with a GFP construct. Four days after transfection neurons were incubated for 15 min with rabbit anti-GluA1 (1:20; Calbiochem, San Diego, CA) or Nr2a (1:20; Covance, Princeton, NJ). After washing, neurons were fixed for 10 min in 4% PFA/4% sucrose and incubated with Alexa 568-conjugated goat anti-rabbit antibodies (1:400; Invitrogen, Carlsbad, CA) in PBS 0.1% gelatin for 1 h at room temperature. Coverslips were washed in PBS and mounted in Vectashield (Vector Laboratories, Peterborough, U.K.). Confocal images were acquired using a LSM510 confocal microscope (Zeiss) with a 40× oil objective. Confocal images of transfected neurons were obtained with sequential acquisition settings at the maximal resolution of the microscope (1024 × 1024 pixels). Each image was a z-series of 6–10 images each averaged two times. The resulting z-stack was “flattened” into a single image using maximum projection. The confocal settings were kept the same for all scans when fluorescence intensity was compared. Morphometric analysis and quantification were performed using MetaMorph software (Universal Imaging Corporation, Downingtown, CA).20,21
Human samples and DNA isolation
Hippocampal and neocortical tissues were obtained from pharmaco-resistant mTLE patients with complex partial seizures during surgical resective treatment.18 Hippocampal tissue from autopsy controls (controls) was obtained from the Netherlands Brain Bank. Patient selection (for clinical data see Table S3), and collection and processing of tissue for qPCR analysis was as described.17
DNA was isolated from neocortex of mTLE patients (n = 368, 91 with FS), blood of patients with complex and/or familial FS without mTLE (n = 145) and healthy Dutch blood bank controls (n = 730). Hippocampal sclerosis (HS) was diagnosed on cresyl violet (Nissl)-stained sections and classified according to the grading system of Wyler by a neuropathologist.18 Where required informed and written consent was obtained from the patients for all procedures as approved by the Institutional Review Board.
Quantitative PCR and Western blot
cDNA was synthesized from hippocampal RNA of controls (n = 15), mTLE + HS (n = 21) and mTLE − HS (n = 19). Within the mTLE + HS group we compared patients with (+FS; n = 7) and without (−FS; n = 14) antecedent FS. Primers for SRP9, SRP68, and reference genes PSMD2 and DDX48 were from Sigma Genosys (Cambridge, U.K.). qPCR data were calculated as normalized ratios and normalized to both reference genes.17
Western blotting with Srp9 antibody (1:2000; Ptglab, USA) on hippocampal homogenates from controls (n = 6), mTLE + HS (n = 12) and mTLE − HS (n = 11) was quantified with ImageJ using β-actin as loading control. Western blot analysis showed a single 9 kDa band, which was absent after preabsorption of the antibody with a 10-fold excess of the antigen.18
Sequencing
Mouse Srp9 was sequenced as described.42 Primers 1–18 (Table S1) were chosen (Mus musculus Srp9 sequence in Ensembl (ENSMUSG00000026511, 183,755,349–187,980,365 bp) to amplify promoter, 5′ UTR, exons, introns and 3′UTR in C57BL/6J, A/J, and CSS1 mice (n = 3). Human SRP9 exons, exon–intron boundaries and promoter region (5 kb upstream) were sequenced with nested PCR.22 Primers (Table S4) were chosen using LIMSTILL (http://limstill.niob.knaw.nl/).22 All sequenced SNPs with an allele frequency >0.05 were selected for association analysis. SNP (rs12403575) genotyping (TaqMan SNP Genotyping Assays; Applied Biosystems, Foster City, CA) was performed on an ABI PRISM 7900 Sequence Detection System (Applied Biosystems, Foster City, CA) and SDS 2.2.3 software for allelic discrimination.13
Statistical analysis
Data were analyzed with SPSS (version 15.0) and expressed as mean ± SEM. One way analysis of variance (ANOVA) was performed with a post hoc Bonferroni-Dun test. Significance levels (α = 0.05) were corrected with the Dunnett method to account for the multiple (strain, expression, treatment or gene) comparison. Equality of variances was tested with Levene's test. P-values (two-tailed: all SNPs; one-tailed: rs12403575) of allele frequencies were calculated by chi-square analysis with a 2 × 2 contingency table and corrected for multiple testing. Distribution of genotypes was in Hardy–Weinberg equilibrium. All other data were analyzed by an independent t-test (α = 0.05).
Results
FS QTL mapping on mouse chromosome 1
To verify our observation that chromosome 1 has a strong contribution to FS susceptibility,10 we determined the latency of the C57BL/6J and CSS1 mice to develop EEG-verified FS induced by hyperthermia.10 As expected, the latency to FS (FSL) was higher in CSS1 (915.3 ± 37.5 sec) than in C57BL/6J (631.9 ± 26.9 sec) (Fig. 1A). To map genes contributing to reduced FS susceptibility on mouse chromosome 1 we bred a CSS1-F2 generation. Phenotypic analysis of all individuals showed that the majority of these genetically unique CSS1-F2 mice had a longer FSL than C57BL/6J mice (Fig. 1B). QTL analysis revealed a highly significant peak (LOD = 7.6) (Fig. 1C) (Table S1). The 1-LOD support interval12 of this QTL1 was located between 183,756,349 and 187,980,365 bp that contains 29 protein coding sequences (Table S5) and accounted for 23.9% of the variance in the CSS1-F2 population (Table S1).
Figure 1.
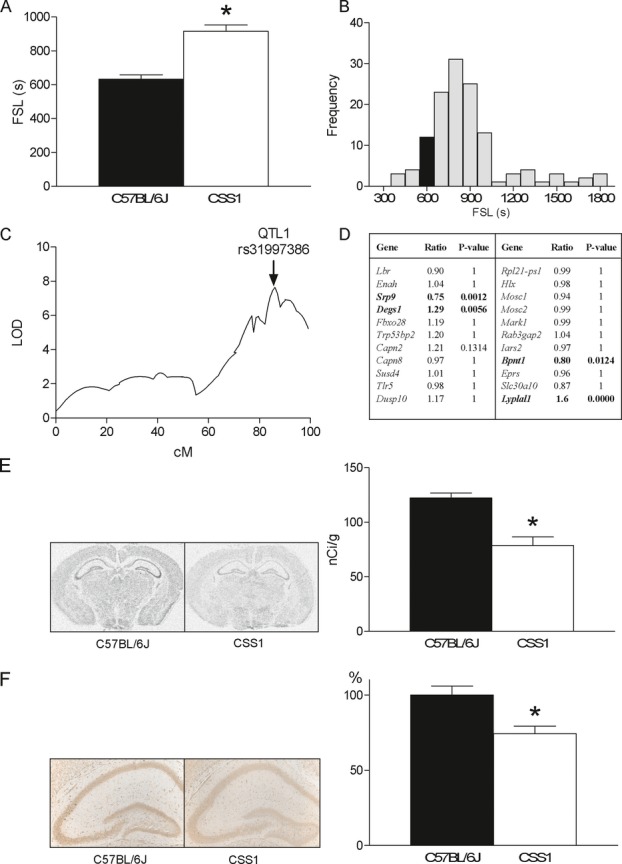
FS QTL mapping on chromosome 1. (A) The febrile seizure latency (FSL) of CSS1 (n = 9; 915.3 ± 37.5 sec) is significantly longer than of C57BL/6J (n = 9; 631.9 ± 26.9 sec) mice (FStrain (1,14) = 11.355, P < 0.001) showing that CSS1 is less susceptible to FS. No sex differences were found in either strain (Fgender (1,14) = 0.736, P = 0.406, interaction effect, Finteraction (1,14) = 0.104, P = 0.752). Strains did not differ in core body-temperature increase during hyperthermia (data not shown; time F1,14 = 1478.191, P = 0.0001; time × strain F1,14 = 0.715, P = 0.511). (B) Frequency histogram of FS latencies of CSS1-F2 progeny (n = 129) shows that, as expected, the majority of these genetically unique CSS1-F2 mice have a longer FSL than C57BL/6J (black bar is C57BL/6J average). (C) QTL1 (rs31997386, LOD = 7.6) located at 183,756,349–187,980,365 bp (1-LOD support interval) accounts for 23.9% of the phenotypic variance. No sex or (grand) parent of origin differences in FSL were observed for QTL mapping. (D) mRNA profiling in P14 C57BL/6J (n = 3) and CSS1 (n = 3) mouse brains revealed that of the 22 brain expressed genes in the locus Srp9 and 3 other genes were differentially expressed (in bold) between strains (ratio CSS1/C57BL/6J, Bonferroni corrected P-value for multiple testing, P < 0.05). (E) Autoradiograms after in situ hybridization (left panel) were quantified in the hippocampus (right panel) showing that Srp9 mRNA was significantly (t9 = 5.090, P = 0.001) lower in CSS1 (n = 5; 78.7 ± 7.0 nCi/g) than in C57BL/6J mice (n = 6; 122.3 ± 4.5 nCi/g). The reduction in Srp9 in total CSS1 brain was 23.1 ± 6.4% (C57BL/6J: 90.2 ± 3.9%, CSS1: 69.4 ± 6.3%, P = 0.001, data not shown). (F) Photomicrographs of immunocytochemistry (left panel) were quantified (right panel) showing that Srp9 protein was significantly (t24 = 3.322, P = 0.003) lower in CSS1 (n = 13; 74.3 ± 5.0%) than in C57BL/6J mice (n = 13; 100 ± 5.8%). Srp9 was detected in neurons and astrocytes. Error bars indicate SEM. *P < 0.05.
Identificaton of Srp9 as candidate FS susceptibility gene
To identify candidate genes in QTL1, we compared mRNA expression profiles of postnatal day (P14) C57BL/6J and CSS1 mouse brains (DNA microarray data have been submitted to GEO [accession no GSE41320]). Of the 22 brain expressed genes in the locus, Srp9 and three other genes showed differential expression (Fig. 1D) between the strains. Using the same mapping strategy in CSS2 mice, we identified Srp14, the binding partner of Srp9 in the SRP complex, as a strong candidate gene for FS susceptibility in QTL2b (LOD = 6.2; 1-LOD interval 114,875,854–133,817,501 bp) on chromosome 2 (Fig. S2). These observations prompted us to examine the differential expression of Srp9 between CSS1 and C57BL/6J in more detail. In situ hybridization (Fig. 1E) and immunocytochemistry (Fig. 1F) confirmed that hippocampal Srp9 expression was lower in CSS1 compared to C57BL/6J (mRNA: −35.6 ± 6.3%, P = 0.001; protein: −25.6 ± 5.0%, P = 0.003). Sequencing of Srp9 (184,053,433–184,063,607 bp) in C57BL/6J, CSS1, and A/J mice identified one new SNP in the 3′UTR and 52 polymorphisms in intronic and promoter regions (Fig. S3). Database analysis (WebQTL: http://www.genenetwork.org/) revealed a strong cisQTL for Srp9 mRNA regulation in the AXB eye tissue (LOD = 12.1) and BXD brain (LOD = 11.7). Sequencing 2500 bp upstream showed a major 210 bp deletion in A/J and CSS1, containing a SINE B2 element (RepeatMasker: http://www.repeatmasker.org/). The functional consequences of this deletion and the polymorphisms are subject of further study.
Effect of in vivo downregulation of Srp9 or protein synthesis on FS susceptibility
To investigate a causal relationship between Srp9 expression levels and FS susceptibility, we microinjected Srp9 antisense (AS) oligonucleotides ICV in C57BL/6J pups 20 h prior to inducing hyperthermia. Srp9 knockdown significantly prolonged FSL in C57BL/6J (869.0 ± 52.3 sec) compared with littermates injected with two different scrambled (Scr) oligonucleotides (P = 0.0001; Scr1: 630.2 ± 45.4 sec; Scr2: 624.5 ± 52.3 sec) (Fig. 2A) and was accompanied by a downregulation (−15%, P < 0.04) of Srp9 transcript levels in the cortex (Fig. S4). Thus, Srp9 downregulation in vivo decreased FS susceptibility and induced the CSS1 FS phenotype in C57BL/6J. These data show a causal relationship between Srp9 expression and FS susceptibility. Because SRP9 is part of the SRP complex, which couples cytoplasmic protein synthesis to the membrane-bound protein translocation machinery of the ER23–25 we independently assessed the importance of protein synthesis in FS susceptibility. Protein synthesis inhibitors were injected in C57BL/6J pups prior to hyperthermia induction to study the role of protein synthesis in FS susceptibility. Cycloheximide, which inhibits translation initiation,26 significantly prolonged FSL (769.1 ± 41.1 sec) compared with saline injected littermates (662.6 ± 28.0 sec; P = 0.048) (Fig. 2B). Rapamycin, which inhibits activation of eukaryotic translation initiation factor 4B (eIF4B)27 through inhibition of mTOR (mammalian target of rapamycin), also prolonged FSL (708.1 ± 35.9 sec) compared to saline injected littermates (591.9 ± 11.4 sec; P = 0.018) (Fig. 2B).
Figure 2.
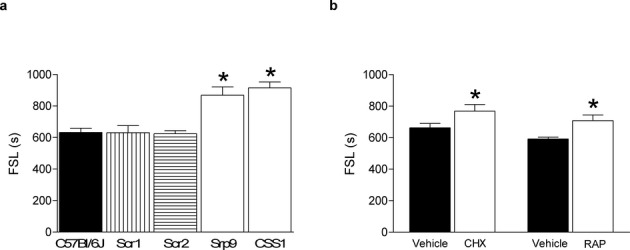
Downregulation of Srp9 mRNA in C57BL/6J in vivo reduces FS susceptibility. (A) ICV injection of Srp9 antisense oligonucleotide (AS Srp9) probe in C57BL/6J pups 20 h prior to hyperthermia significantly (F2,31=10.554, P = 0.0003) prolonged FSL (sec) in C57BL/6J (n = 12; 869.0 ± 52.3 sec) mice compared to scrambled (Scr) probe injected littermate controls (Scr-1, n = 12; 630.2 ± 45.4 sec, P = 0.001), and (Scr-2, n = 10; 624.5 ± 52.3 sec, P = 0.001). This in vivo treatment resulted in downregulation of Srp9 transcript levels (−15%; P < 0.04) in the cortex compared to controls. (B) IP injection of cycloheximide (CHX, n = 9; 769.1 ± 41.1 sec) 20 min prior to hyperthermia delayed FSL (t16 = −2.141, P = 0.048) compared to vehicle controls (n = 9; 662.6 ± 28.0 sec). IP injection of rapamycin (RAP, n = 9; 708.1 ± 35.9 sec) 30 min prior to hyperthermia delayed FSL (t16 = −2.700, P = 0.018) compared to controls (n = 9; 591.9 ± 11.4 sec). Error bar indicates SEM; *P < 0.05. ICV and IP injections did not affect temperature curves during hyperthermia induction (data not shown).
Effects of differential Srp9 expression on AMPA and NMDA currents
The SRP complex plays a key role in the synthesis and targeting of membrane proteins.23,24 Membrane receptors which are pivotal to regulation of neuronal excitability and susceptibility to seizures are glutamate receptors. As a first step to analyze the relationship between Srp9 levels and expression of functional glutamate receptors we compared AMPA and NMDA currents in hippocampal slices from P14 C57BL/6J and CSS1 mice, of which the latter strain has reduced FS susceptibility and Srp9 expression. Voltage-clamp recordings of CA1 neurons of CSS1 mice revealed significantly smaller AMPA (−20%, P = 0.041) (Fig. 3B) and NMDA current amplitudes (−30%, P = 0.01) (Fig. 3C) than C57BL/6J mice.
Effects of downregulation of Srp9 on surface expression of AMPA and NMDA receptor subunits
To further investigate a role of Srp9 in regulating glutamate receptor expression, we specifically downregulated Srp9 expression by transfecting cultured hippocampal neurons with Srp9-shRNAs and analyzing surface expression of AMPA and NMDA receptor subunits by immunofluorescence (Fig. 4A). Srp9 knockdown neurons showed a significant reduction (shRNA1 −31%, P < 0.0001, and shRNA2 −32%, P < 0.0001) in GluA1 surface expression compared to vector controls (Fig. 4B), whereas Nr2a surface expression was not significantly changed (shRNA1 −8%, P = 0.130, shRNA2 −7%, P = 0.126) (Fig. 4B).
Figure 4.
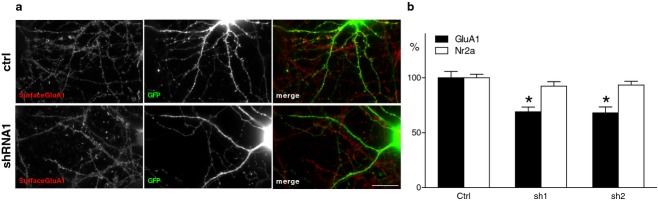
Downregulation of Srp9 in neuronal cultures reduces GluA1 surface expression. (A) Knockdown of Srp9 reduced neuronal GluA1 surface expression (red) in GFP + shRNA transfected neurons (green). Representative images of hippocampal neurons stained for endogenous surface GluA1. Hippocampal neurons at DIV14 were cotransfected with GFP (green) and pSuper control vector (CTRL) or Srp9-shRNA#1 or Srp9-shRNA#2. At DIV18, neurons were stained live with anti-GLUA1 antibodies (red). Srp9-shRNA#1 knockdown neurons showed a significant reduction (−31%; P < 0.005) in surface labeling for GluA1 compared to controls. Bar is 20 μm. (B) Histograms show quantification of fluorescence intensity of surface GluA1 (black bars) and Nr2a (white bars) staining relative to the intensity of GFP transfected control neurons at basal levels (Crtl = control, sh1 = shRNA#1, sh2 = shRNA#2). GluA1 (F2,86 = 15.581. P = 0.0001); Ctrl = 100 ± 5.6 shRNA#1 = 68.9 ± 4.3, shRNA#2 = 68 ± 5.4, and Nr2a, (F(2,97) = 1.388, P = 0.254) Crtl = 100 ± 3.0, shRNA#1 = 92.3 ± 4.1, shRNA#2 = 93.2 ± 3.5. n = 20 cells for each group, 4–5 measurements per cell. White bar is 20 μm. Error bars indicate SEM. *P < 0.005.
SRP9 in patients with mTLE and FS
The identification of Srp9 as FS susceptibility gene in mice, prompted us to investigated SRP9 in human FS susceptibility. As a first step we measured SRP9 transcript and protein levels in hippocampal tissue obtained during surgery performed to treat patients with mTLE. We compared mTLE patients with HS (mTLE + HS), known to have a high incidence of antecedent FS (46% in this study), with mTLE patients without HS (mTLE − HS), and autopsy controls (Table S3). SRP9 mRNA expression (Fig. 5A) was significantly higher (P = 0.0001) in mTLE + HS (Rn = 209.0 ± 24.4) than in mTLE-HS patients (Rn = 100.0 ± 8.2), and autopsy controls (Rn = 112.3 ± 12.3). SRP9 protein (Fig. 5B) was also highest (P = 0.005) in mTLE + HS patients (+HS: 223.2 ± 47.6%; −HS: 100.0 ± 11.6%; Control: 53.9 ± 12.2%). Within the mTLE + HS group we found significantly higher SRP9 mRNA levels (+55.0%, P = 0.006) in patients with antecedent FS (n = 7, Rn = 297.0 ± 44.0) than in patients without (n = 14, Rn = 164.5 ± 21.5). Expression of SRP68, a SRP protein not directly interacting with SRP9, did not differ between the three groups, indicating that not all SRP proteins are differentially expressed. These data suggest that also in humans increased SRP9 expression may be linked to FS susceptibility.
Figure 5.
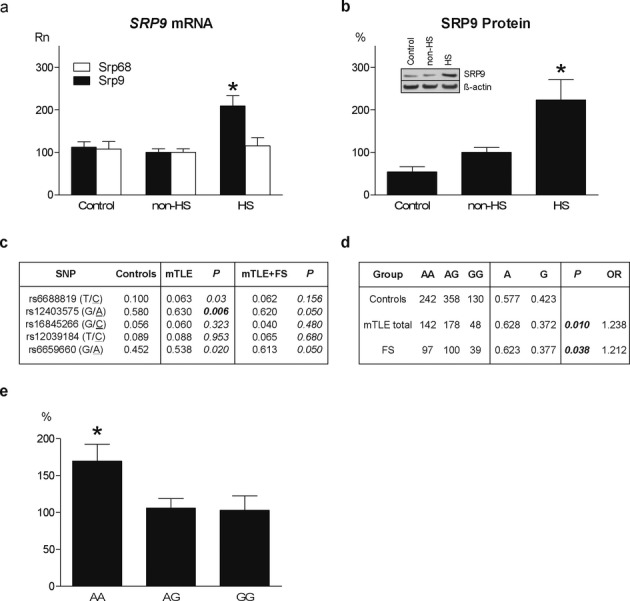
SRP9 expression and sequencing in patients with mTLE and/or FS. (A) SRP9 mRNA levels (normalized qPCR data: Rn) in hippocampal homogenates of autopsy controls (Control; n = 15; Rn = 112.3 ± 12.3) and mTLE patients without (non-HS; n = 19; Rn = 100.0 ± 8.2) and with hippocampal sclerosis (HS; n = 21; Rn = 209.0 ± 24.4). (F2,52 = 12.023, P = 0.0001; non-HS vs. HS: P = 0.008; Control vs. HS: P = 0.001; Control vs. non-HS: P = 1.000). SRP68 mRNA levels did not differ between groups (Control Rn = 107.8 ± 17.6; non-HS Rn = 100.0 ± 8.1; HS Rn = 115.1 ± 19.3; F2,36 = 0.203, P = 0.817. (B) SRP9 protein (insert shows Western blot with loading control β-actin) in hippocampal homogenates of Controls (n = 6; 53.9 ± 12.2), non-HS (n = 12; Rn = 100.0 ± 11.6), and HS (n = 11; Rn = 223.2 ± 47.6) patients. (F2,26 = 6.685, P = 0.005; non-HS vs. HS: P = 0.023; Controls vs. HS: P = 0.009; Controls vs. non-HS: P = 1.000). Error bar indicates SEM. *Significantly different after multiple testing correction P < 0.01. (C) Sequencing of SRP9 exons, intron/exon boundaries and promoter region (5 kb) in healthy controls (n = 169), mTLE patients (n = 368) and mTLE patients with FS (n = 91) revealed a significant (P < 0.01 bold) difference in allele frequencies of one common promoter SNP (rs12403575 G/A) in mTLE patients. P-value corrected for multiple SNP testing P < 0.01. All SNPs in the sequenced region with an allele frequency >0.05 were selected for the assocation study. In the HS group 46% had antecedent FS, in the non-HS group only 6%. (D) Further single SNP analysis using a larger control cohort (n = 730) identified a significant association between rs12403575 and mTLE (n = 368, P = 0.01, odds ratio (OR) = 1.238). This association was replicated in patients with FS without mTLE (n = 236, P = 0.038, OR = 1.212). (E) Patients with AA genotype had a significantly (F2,33 = 4.142, P = 0.023) higher hippocampal SRP9 expression (Rn = 169.7 ± 22.9) than patients with AG genotype (Rn = 105.9 ± 13.1, P = 0.044), and GG genotype (Rn = 103.1 ± 19.6, P = 0.058). Data are expressed as means ± SEM. *Significantly different P < 0.05.
In search for a genetic variant associated with FS and mTLE, we subsequently sequenced all four exons of the human SRP9 gene and its promoter region (5 kb) in a Dutch mTLE patient cohort (n = 368) including 91 patients with antecedent FS, and ethnically matched healthy controls (n = 169) (Fig. 5C). We did not find significant differences in frequency of sporadic mutations between groups nor did we find variants in coding sequences that are predicted to affect protein function. Analysis of the frequency of the 5 most common SNPs revealed a significant association of a single SNP in the promoter region (rs12403575 G/A) (Fig. 5C) with mTLE. Taqman analysis of this SNP in the mTLE cohort and a larger control sample (n = 730) revealed a significant association with mTLE (P = 0.01, odds-ratio [OR] = 1.238) (Fig. 5D), and mTLE + FS (P = 0.045, OR = 1.321). The association with FS was confirmed in a cohort of FS patients (P = 0.038, OR = 1.212) (Fig. 5D). By correlating SNP genotype and hippocampal SRP9 expression levels in individual mTLE patients, we found significantly higher SRP9 expression (P = 0.023) in patients with AA (169.7 ± 22.9) as compared to AG (105.9 ± 13.1), and GG genotypes (103.1 ± 19.6) (Fig. 5E), indicating that this SNP may contribute to regulation of SRP9 expression.
Discussion
Common forms of FS are considered to be genetically complex disorders, believed to be influenced by variations in several susceptibility genes and the environment. From association studies so far, no convincing FS susceptibility genes have emerged.5 We, therefore, applied a new approach to unravel the genetic complexity of FS by employing a phenotype-driven genetic strategy in a controlled laboratory setting inducing experimental complex FS by hyperthermia in mice.10 Here we mapped a FS QTL on chromosome 1 and identified Srp9 as FS susceptibility gene by establishing a causal relationship between FS and Srp9 expression levels in mice. On the basis of this established causality in mouse, we probed the hypothesis that SRP9 is also involved in human FS susceptibility. Studies in hippocampal tissue from mTLE patients operated to treat seizures, showed that SRP9 levels were significantly higher in mTLE patients with antecedent FS than in mTLE patients without FS. Prompted by these human data we performed an association study and found a significant association of promotor SNP (rs12403575) with FS and mTLE. This association could be confirmed in FS patients, providing compelling evidence for a role of SRP9 in human FS.
SRP9 is a subunit of SRP, a ubiquitous, highly conserved cytoplasmic ribonucleoprotein complex that plays a key role in targeting nascent membrane proteins to the rough ER membrane.23 SRP contains two functional domains. The S-domain (SRP19, 54, 68, and 72) is primarily involved in recognition of the signal sequence of nascent peptide chains, and the ALU domain (7SL RNA and the SRP9/SRP14 heterodimer) is thought to be responsible for elongation arrest facilitating targeting of nascent chains to the ER.24,25 Interestingly, using the same forward genetic mapping strategy, we identified Srp14, the binding partner of Srp9, as a strong candidate gene in a FS susceptibility QTL on chromosome 2. Thus, our data indicate a role of the ALU domain of the SRP complex in FS.
To independently assess the importance of protein synthesis in FS susceptibility, we injected protein synthesis inhibitors in C57BL/6J pups prior to hyperthermia induction. Cycloheximide, which inhibits translation initiation,26 and Rapamycin, which inhibits activation of eIF4B27 through inhibition of mTOR, both prolonged FSL. mTOR signaling has been implicated in the pathogenesis of tuberous sclerosis complex, a syndrome with a prominent epilepsy phenotype.28 The rapid effect of protein synthesis inhibitors (20–30 min) indicates involvement of local protein synthesis, possibly in dendrites and/or synapses,29 where it is thought to play a key role in regulating neuronal plasticity.29,30 Further studies will be required to investigate whether Srp9 affects seizure susceptibility via local synaptic protein synthesis. Interestingly, very recent studies on disorders with strong comorbidity with epilepsy such as Fragile X syndrome and Autism, identified genes in similar pathways.14,15 Fragile X syndrome is caused by a loss of function of the RNA-binding protein Fragile X mental retardation protein, affecting local protein synthesis and synaptic plasticity.15 Recent studies on autism spectrum disorder have identified genes and pathways involved in synaptic maturation and function, often as a result of alterations in local protein synthesis.14
What could be the mechanism by which SRP9 conveys its effect on FS susceptibility? SRP lacking SRP9/14 lacks elongation arrest activity, but is still translocation competent, albeit, at lower efficiency.31 Presumably loss of SRP9 from the complex leads to loss of elongation arrest and decreased translocation efficiency due to the strict time dependence of the functional interaction between polysome and microsomal membrane.32,33 Therefore, reduced SRP9 levels could affect the amount and/or composition of proteins targeted to the ER, thus affecting secretion, plasticity, and cell growth.32,33 Not only fever and FS but also other risk factors for mTLE, such as viral infection, stroke or head traumas are known to disrupt ER function.34,35 Not only ER function but also post-ER trafficking maybe affected by SRP9 levels. For example, in HeLa cells downregulation of several SRP proteins resulted in reduced expression of membrane proteins, possibly involving trafficking.32,33 Interestingly, receptor trafficking defects have previously been implicated in FS.36,37 Thus, it is plausible that variations in SRP9 levels observed in this study, affect the expression of membrane proteins, such as glutamate receptors at the postsynaptic membrane, resulting in altered susceptibility to FS.
To test this hypothesis, we compared AMPA and NMDA currents in hippocampal slices from P14 C57BL/6J and CSS1 mice, of which the latter strain has reduced FS susceptibility and Srp9 expression. In line with our hypothesis voltage-clamp recordings of CA1 neurons of CSS1 mice revealed significantly smaller AMPA and NMDA current amplitudes than C57BL/6J mice. To confirm a role of Srp9 in the regulation of glutamate receptor expression we downregulated Srp9 expression in hippocampal neurons. Knockdown of Srp9 expression resulted in reduced GluA1 surface expression compared to vector controls, whereas Nr2a surface expression was unaffected. These results are in line with previous studies in hippocampal cultures showing that membrane NMDA receptors are more stable, have a lower turnover, and are less susceptible to regulation than AMPA receptors.38,39 Studies on effects of Srp9 downregulation on other membrane receptors are in progress. In all, our results indicate that reduced Srp9 expression is associated with reduced glutamate receptor expression and function. Glutamate receptors are crucial regulators of neuronal excitability and synaptic strength, and play a key role in synaptic plasticity.40
In summary, our SRP9 data show an association with both FS and mTLE. Complex FS are seen in 30–50% of patients with mTLE.2 Due to the genetic complexity of TLE it has been difficult to identify susceptibility genes.41 This study provides evidence for a role of Srp9 in both FS and mTLE, thus indicating that they share at least some common genetic predisposition. This is in line with results from a recent study in mTLE patients with HS showing a genome-wide significant association for mTLE with HS with FS for an intron SNP in SCN1A; no association was found for this SNP and FS alone in patients who did not go on to develop epilepsy.42 Srp9 appears to convey its effect on FS susceptibility through ER-dependent protein synthesis and trafficking, resulting in altered expression of cell membrane proteins, such as glutamate receptor subunits. Identification of this new FS susceptibility gene and mechanism may contribute to the development of new tools for treatment of children with complex FS and at risk for mTLE.
Acknowledgments
We thank S. de Jong for sharing microarray data, M. Deen and L. Worrel for their help with in situ hybridization experiments, S. Bots for help with Western blotting, M. de Krom for advice on SNP analysis, Y. Adolfs for cloning, and F. Gardoni and M. Diluca for advise on membrane expression studies. We thank the members of the Dutch Collaborative Epilepsy Surgery Program for their cooperation, and The Netherlands Brain Bank for providing autopsy control material. This study was in part supported by the Epilepsy Fund of The Netherlands (NEF grants 09-06 and 11-09) and the EPOCH Foundation (Focal Epilepsies of Childhood).
Conflict of Interest
None declared.
Supporting Information
Additional Supporting Information may be found in the online version of this article:
Figure S1. Penetration of fluorescent (FIC) oligo's in the P14 C57BL/6J brain 3 h after ICV injection. (A) Only faint staining around the contralateral lateral ventricle. (B) Strong labeling around the ipsilateral lateral ventricle (1) which gradually decreases further into the cortex (2) and hippocampus (3). (C) Faint staining of the contralateral hippocampus. (D) Staining in the ipsilateral hippocampus gradually decreases away from the ventricle (top to bottom). Note the principle neuron layers (CA1 (4), CA3 (5) and dentate granule cell layer (6)). (E) Detail of FIC labeling in cortical cells. (F) DAPI nuclear staining. (G) Merge panels F and G confirming cellular penetration of oligo's.
Figure S2. Mapping of two FS susceptibility QTLs on chromosome 2. QTL analysis was performed on n = 144 CSS2-F2 mice. QTL2a (D2Mit156; LOD = 3.6; 1-LOD support interval 52,581,428–66,278,629 bp). QTL2b (D2Mit277; LOD = 6.2; 1-LOD support interval 114,875,854–133,817,501 bp) contains the Srp14 gene.
Figure S3. Srp9 sequence differences between C57BL/6J and A/J/CSS1. Srp9 was sequenced (n = 3) in the CSS1, A/J and C57BL/6J mice. A/J/CSS1 and C57BL/6J differences are in red between parentheses. The exon region is in bold. Newly identified polymorphisms are in bold and underlined (known polymorphisms http://www.ensembl.org). The 210 bp underlined promoter region in bold was not present in the A/J/CSS1.
Figure S4. Downregulation of cortical Srp9 mRNA 20 h after ICV injection of Srp9 (anti)sense in P14 C57BL/6J mice. Radioactive in situ hybridization was quantified in the whole ipsilateral cortex in 16 µm serial cryosections 320 µm before, at (0 µm), and 320 µm after the injection site using ImageJ. Black bars: scrambled Srp9 (Control; n = 5); white bars: antisense Srp9 (Srp9; n = 7). The overall downregulation in the ipsilateral cortex between −320 µm and −320 µm (comparing sense and antisense injected animals) was 15% (P < 0.04).
Table S1. Cosegregation analysis in the CSS1-F2 progeny.
Table S2. Primers used for sequencing mouse Srp9, mouse in situ hybridization and human quantitative PCR.
Table S3. Clinical data of patients used for expression studies.
Table S4. Primers used for nesting PCR to sequence SRP9 and the taqman assay for SNP rs12403575.
Table S5. Protein-coding genes in 1-LOD support interval of QTL1.
References
- 1.Hauser WA. The prevalence and incidence of convulsive disorders in children. Epilepsia. 1994;35:S1–S6. doi: 10.1111/j.1528-1157.1994.tb05932.x. [DOI] [PubMed] [Google Scholar]
- 2.French JA, Williamson PD, Thadani VM, et al. Characteristics of medial temporal-lobe epilepsy: 1. Results of history and physical-examination. Ann Neurol. 1993;34:774–780. doi: 10.1002/ana.410340604. [DOI] [PubMed] [Google Scholar]
- 3.Kjeldsen MJ, Kyvik KO, Friis ML, Christensen K. Genetic and environmental factors in febrile seizures: a Danish population-based twin study. Epilepsy Res. 2002;51:167–177. doi: 10.1016/s0920-1211(02)00121-3. [DOI] [PubMed] [Google Scholar]
- 4.Eckhaus J, Lawrence KM, Helbig I, et al. Genetics of febrile seizure subtypes and syndromes: a twin study. Epilepsy Res. 2013;105:103–109. doi: 10.1016/j.eplepsyres.2013.02.011. [DOI] [PubMed] [Google Scholar]
- 5.Nakayama J. Progress in searching for the febrile seizure susceptibility genes. Brain Dev. 2009;31:359–365. doi: 10.1016/j.braindev.2008.11.014. [DOI] [PubMed] [Google Scholar]
- 6.Chen K, Baram TZ, Soltesz I. Febrile seizures in the developing brain result in persistent modification of neuronal excitability in limbic circuits. Nat Med. 1999;5:888–894. doi: 10.1038/11330. [DOI] [PMC free article] [PubMed] [Google Scholar]
- 7.Schuchmann S, Schmitz D, Rivera C, et al. Experimental febrile seizures are precipitated by a hyperthermia-induced respiratory alkalosis. Nat Med. 2006;12:817–823. doi: 10.1038/nm1422. [DOI] [PMC free article] [PubMed] [Google Scholar]
- 8.Koyama R, Tao K, Sasaki T, et al. GABAergic excitation after febrile seizures induces ectopic granule cells and adult epilepsy. Nat Med. 2012;18:1271–1278. doi: 10.1038/nm.2850. [DOI] [PubMed] [Google Scholar]
- 9.van Gassen KL, Hessel EV, Ramakers GM, et al. Characterization of febrile seizures and febrile seizure susceptibility in mouse inbred strains. Genes Brain Behav. 2008;7:578–586. doi: 10.1111/j.1601-183X.2008.00393.x. [DOI] [PubMed] [Google Scholar]
- 10.Hessel EV, van Gassen KL, Wolterink-Donselaar IG, et al. Phenotyping mouse chromosome substitution strains reveal multiple QTLs for febrile seizure susceptibility. Genes Brain Behav. 2009;8:248–255. doi: 10.1111/j.1601-183X.2008.00466.x. [DOI] [PubMed] [Google Scholar]
- 11.Nadeau JH, Singer JB, Matin A, Lander ES. Analysing complex genetic traits with chromosome substitution strains. Nat Genet. 2000;24:221–225. doi: 10.1038/73427. [DOI] [PubMed] [Google Scholar]
- 12.Kas MJ, de Mooij-van Malsen JG, de Krom M, et al. High-resolution genetic mapping of mammalian motor activity levels in mice. Genes Brain Behav. 2009;8:13–22. doi: 10.1111/j.1601-183X.2008.00435.x. [DOI] [PubMed] [Google Scholar]
- 13.de Mooij-van Malsen AJ, van Lith HA, Oppelaar H, et al. Interspecies trait genetics reveals association of Adcy8 with mouse avoidance behavior and a human mood disorder. Biol Psychiatry. 2009;66:1123–1130. doi: 10.1016/j.biopsych.2009.06.016. [DOI] [PubMed] [Google Scholar]
- 14.Ebert DH, Greenberg ME. Activity-dependent neuronal signalling and autism spectrum disorder. Nature. 2013;493:327–337. doi: 10.1038/nature11860. [DOI] [PMC free article] [PubMed] [Google Scholar]
- 15.Darnell JC, Klann E. The translation of translational control by FMRP: therapeutic targets for FXS. Nat Neurosci. 2013;16:1530–1536. doi: 10.1038/nn.3379. [DOI] [PMC free article] [PubMed] [Google Scholar]
- 16.Roepman P, Wessels LF, Kettelarij N, et al. An expression profile for diagnosis of lymph node metastases from primary head and neck squamous cell carcinomas. Nat Genet. 2005;37:182–186. doi: 10.1038/ng1502. [DOI] [PubMed] [Google Scholar]
- 17.van Gassen KL, de Wit M, Koerkamp MJ, et al. Possible role of the innate immunity in temporal lobe epilepsy. Epilepsia. 2008;49:1055–1065. doi: 10.1111/j.1528-1167.2007.01470.x. [DOI] [PubMed] [Google Scholar]
- 18.van der Hel WS, Notenboom RG, Bos IW, et al. Reduced glutamine synthetase in hippocampal areas with neuron loss in temporal lobe epilepsy. Neurology. 2005;64:326–333. doi: 10.1212/01.WNL.0000149636.44660.99. [DOI] [PubMed] [Google Scholar]
- 19.Karst H, Joels M. Effect of chronic stress on synaptic currents in rat hippocampal dentate gyrus neurons. J Neurophysiol. 2003;89:625–633. doi: 10.1152/jn.00691.2002. [DOI] [PubMed] [Google Scholar]
- 20.Jaworski J, Kapitein LC, Gouveia SM, et al. Dynamic microtubules regulate dendritic spine morphology and synaptic plasticity. Neuron. 2009;15:85–100. doi: 10.1016/j.neuron.2008.11.013. [DOI] [PubMed] [Google Scholar]
- 21.Hoogenraad CC, Milstein AD, Ethell IM, et al. GRIP1 controls dendrite morphogenesis by regulating EphB receptor trafficking. Nat Neurosci. 2005;8:906–915. doi: 10.1038/nn1487. [DOI] [PubMed] [Google Scholar]
- 22.Smits BM, Mudde JB, van de Belt J, et al. Generation of gene knockouts and mutant models in the laboratory rat by ENU-driven target-selected mutagenesis. Pharmacogenet Genomics. 2006;16:159–169. doi: 10.1097/01.fpc.0000184960.82903.8f. [DOI] [PubMed] [Google Scholar]
- 23.Siegel V, Walter P. Functional dissection of the signal recognition particle. Trends Biochem Sci. 1988;13:314–316. doi: 10.1016/0968-0004(88)90127-2. [DOI] [PubMed] [Google Scholar]
- 24.Walter P, Blobel G. Purification and characterization of a protein complex required for the translocation of nascent secretory proteins across the membrane of the endoplasmic-reticulum. Fed Proc. 1981;40:1557. [Google Scholar]
- 25.Bovia F, Bui N, Strub K. The heterodimeric subunit SRP9/14 of the signal recognition particle functions as permuted single polypeptide-chain. Nucleic Acids Res. 1994;22:2028–2035. doi: 10.1093/nar/22.11.2028. [DOI] [PMC free article] [PubMed] [Google Scholar]
- 26.Baliga BS, Pronczuk AW, Munro HN. Mechanism of cycloheximide inhibition of protein synthesis in a cell-free system prepared from rat liver. J Biol Chem. 1969;25:4480–4489. [PubMed] [Google Scholar]
- 27.Burnett PE, Barrow RK, Cohen NA, et al. RAFT1 phosphorylation of the translational regulators p70 S6 kinase and 4E-BP1. Proc Natl Acad Sci USA. 1998;95:1432–1437. doi: 10.1073/pnas.95.4.1432. [DOI] [PMC free article] [PubMed] [Google Scholar]
- 28.Wong M. Mechanisms of epileptogenesis in tuberous sclerosis complex and related malformations of cortical development. Epilepsia. 2008;49:8–21. doi: 10.1111/j.1528-1167.2007.01270.x. [DOI] [PMC free article] [PubMed] [Google Scholar]
- 29.Tiedge H, Brosius J. Translational machinery in dendrites of hippocampal neurons in culture. J Neurosci. 1996;16:7171–7181. doi: 10.1523/JNEUROSCI.16-22-07171.1996. [DOI] [PMC free article] [PubMed] [Google Scholar]
- 30.Bramham CR, Wells DG. Dendritic mRNA: transport, translation and function. Nat Rev Neurosci. 2007;8:776–789. doi: 10.1038/nrn2150. [DOI] [PubMed] [Google Scholar]
- 31.Siegel V, Walter P. Removal of the ALU structural domain from signal recognition particle leaves its protein translocation activity intact. Nature. 1986;320:81–84. doi: 10.1038/320081a0. [DOI] [PubMed] [Google Scholar]
- 32.Lakkaraju AKK, Luyet PP, Parone P, et al. Inefficient targeting to the endoplasmic reticulum by the signal recognition particle elicits selective defects in post-ER membrane trafficking. Exp Cell Res. 2007;313:834–847. doi: 10.1016/j.yexcr.2006.12.003. [DOI] [PubMed] [Google Scholar]
- 33.Lakkaraju AKK, Mary C, Scherrer A, et al. SRP keeps polypeptides translocation-competent by slowing translation to match limiting ER-targeting sites. Cell. 2008;133:440–451. doi: 10.1016/j.cell.2008.02.049. [DOI] [PMC free article] [PubMed] [Google Scholar]
- 34.Paschen W. Endoplasmic reticulum: a primary target in various acute disorders and degenerative diseases of the brain. Cell Calcium. 2003;34:365–383. doi: 10.1016/s0143-4160(03)00139-8. [DOI] [PubMed] [Google Scholar]
- 35.Quinones QJ, de Ridder GG, Pizzo SV. GRP78: a chaperone with diverse roles beyond the endoplasmic reticulum. Histol Histopathol. 2008;23:1409–1416. doi: 10.14670/HH-23.1409. [DOI] [PubMed] [Google Scholar]
- 36.Berkovic SF, Petrou S. Febrile seizures: traffic slows in the heat. Trends Mol Med. 2006;12:343–344. doi: 10.1016/j.molmed.2006.06.005. [DOI] [PubMed] [Google Scholar]
- 37.Hirose S. A new paradigm of channelopathy in epilepsy syndromes: intracellular trafficking abnormality of channel molecules. Epilepsy Res. 2006;70:S206–S217. doi: 10.1016/j.eplepsyres.2005.12.007. [DOI] [PubMed] [Google Scholar]
- 38.Wenthold RJ, Prybylowski K, Standley S, et al. Trafficking of NMDA receptors. Annu Rev Pharmacol Toxicol. 2003;43:335–358. doi: 10.1146/annurev.pharmtox.43.100901.135803. [DOI] [PubMed] [Google Scholar]
- 39.Ehlers MD. Reinsertion or degradation of AMPA receptors determined by activity-dependent endocytic sorting. Neuron. 2000;28:511–525. doi: 10.1016/s0896-6273(00)00129-x. [DOI] [PubMed] [Google Scholar]
- 40.Shepherd JD, Huganirl RL. The cell biology of synaptic plasticity: AMPA receptor trafficking. Annu Rev Cell Dev Biol. 2007;23:613–643. doi: 10.1146/annurev.cellbio.23.090506.123516. [DOI] [PubMed] [Google Scholar]
- 41.Crompton DE, Scheffer IE, Taylor I, et al. Familial mesial temporal lobe epilepsy: a benign epilepsy syndrome showing complex inheritance. Brain. 2010;133:3221–3231. doi: 10.1093/brain/awq251. [DOI] [PubMed] [Google Scholar]
- 42.Kasperavičiūt≐ D, Catarino CB, Matarin M, et al. Genome-wide association study implicates SCN1A in mesial temporal lobe epilepsy with hippocampal sclerosis. Brain. 2013;136:3140–3150. [Google Scholar]
Associated Data
This section collects any data citations, data availability statements, or supplementary materials included in this article.
Supplementary Materials
Figure S1. Penetration of fluorescent (FIC) oligo's in the P14 C57BL/6J brain 3 h after ICV injection. (A) Only faint staining around the contralateral lateral ventricle. (B) Strong labeling around the ipsilateral lateral ventricle (1) which gradually decreases further into the cortex (2) and hippocampus (3). (C) Faint staining of the contralateral hippocampus. (D) Staining in the ipsilateral hippocampus gradually decreases away from the ventricle (top to bottom). Note the principle neuron layers (CA1 (4), CA3 (5) and dentate granule cell layer (6)). (E) Detail of FIC labeling in cortical cells. (F) DAPI nuclear staining. (G) Merge panels F and G confirming cellular penetration of oligo's.
Figure S2. Mapping of two FS susceptibility QTLs on chromosome 2. QTL analysis was performed on n = 144 CSS2-F2 mice. QTL2a (D2Mit156; LOD = 3.6; 1-LOD support interval 52,581,428–66,278,629 bp). QTL2b (D2Mit277; LOD = 6.2; 1-LOD support interval 114,875,854–133,817,501 bp) contains the Srp14 gene.
Figure S3. Srp9 sequence differences between C57BL/6J and A/J/CSS1. Srp9 was sequenced (n = 3) in the CSS1, A/J and C57BL/6J mice. A/J/CSS1 and C57BL/6J differences are in red between parentheses. The exon region is in bold. Newly identified polymorphisms are in bold and underlined (known polymorphisms http://www.ensembl.org). The 210 bp underlined promoter region in bold was not present in the A/J/CSS1.
Figure S4. Downregulation of cortical Srp9 mRNA 20 h after ICV injection of Srp9 (anti)sense in P14 C57BL/6J mice. Radioactive in situ hybridization was quantified in the whole ipsilateral cortex in 16 µm serial cryosections 320 µm before, at (0 µm), and 320 µm after the injection site using ImageJ. Black bars: scrambled Srp9 (Control; n = 5); white bars: antisense Srp9 (Srp9; n = 7). The overall downregulation in the ipsilateral cortex between −320 µm and −320 µm (comparing sense and antisense injected animals) was 15% (P < 0.04).
Table S1. Cosegregation analysis in the CSS1-F2 progeny.
Table S2. Primers used for sequencing mouse Srp9, mouse in situ hybridization and human quantitative PCR.
Table S3. Clinical data of patients used for expression studies.
Table S4. Primers used for nesting PCR to sequence SRP9 and the taqman assay for SNP rs12403575.
Table S5. Protein-coding genes in 1-LOD support interval of QTL1.