

Abstract
Objective
Remyelination in multiple sclerosis has been attributed to the presence of oligodendrocyte progenitor cells (OPCs) in brain parenchyma. However, the precise identity of these progenitors is poorly defined. Here, we characterized populations of OPCs in the adult human brain and examined their myelination capacity and profile of miRNAs. Comparisons were made with fetal OPCs and mature oligodendrocytes.
Methods
We isolated human adult and fetal (early-to-mid second trimester) OPCs from surgically resected brain tissues using O4-, A2B5-, and MOG-directed fluorescence activated cell sorting and transplanted them into dysmyelinated shiverer slices to examine their myelination capacity. We used qRT-PCR to analyze expression of selective miRNAs implicated in OPC biology.
Results
Three subsets of putative OPCs were identified in adult brains: (1) A2B5(+), (2) O4low, and (3) A2B5(+)O4highMOG(+) progenitors. In comparison, fetal brains contained (1) A2B5(+), (2) O4(+), and (3) A2B5(+)O4(+) progenitors, but no MOG(+) cells. We demonstrate that like fetal OPCs, adult OPCs have the capacity to ensheathe cerebellar axons. However, adult OPCs exhibit low to undetectable expression of miRNAs that were highly expressed in O4-expressing fetal OPCs. Adult OPCs also express different miRNAs compared to mature oligodendrocytes.
Interpretation
We conclude that phenotypically distinct subsets of OPCs are present in adult human brain and these OPCs show differential miRNA expression compared to fetal OPCs and mature oligodendrocytes. These suggest that remyelination in adult brain may involve multiple populations of progenitors within the brain and that OPC differentiation in adulthood may be differentially regulated compared to development.
Introduction
Oligodendrocyte progenitor cells (OPCs) are distributed throughout the parenchyma of adult central nervous system (CNS). While robust remyelination can be consistently achieved in experimental models of demyelination, the extent of OPC differentiation and subsequent remyelination in the acquired demyelinating human disorder, multiple sclerosis is variable and often limited1–5; reviewed by.6 While many studies have addressed the population of OPCs that mediate robust remyelination in rodent brain,7,8 the identity and characteristics of these OPCs in human brain remain poorly defined.
MicroRNAs (miRNAs) are critical regulators of oligodendrocyte maturation and are important candidates to influence endogenous myelin repair.9,10 MiRNAs are noncoding RNAs that are part of the posttranscriptional gene silencing machinery.11,12 Their capability to intrinsically modulate the expression of effector proteins can result in changes in cellular responses to extracellular cues. To date, two large-scale microarray studies have examined expression of miRNAs in OPCs at various developmental stages. These studies utilized either OPCs from P7 rat brains or human embryonic stem cell (hESC) derived OPC lineages.13,14 Although both studies showed that miRNA expression was dynamically regulated during OPC differentiation, they lack consensus regarding which specific miRNAs regulate OPC lineage transition.
In the current study, we used samples of surgically resected tissue from adult human brains to address whether different subsets of OPCs are present and examined these OPCs for myelination capacity and expression of selective miRNAs implicated in OPC biology. We isolated the OPCs based on their expression of O4, A2B5, and MOG myelin lineage surface markers using fluorescence activated cell sorting (FACS). Subsequently, the isolated subsets of OPCs were assessed for expression of additional myelin lineage gene transcripts using qRT-PCR. Finally, we examined the capacity of the OPCs to ensheathe dysmyelinated shiverer axons and the expression of selective miRNAs reported to influence OPC differentiation. These parameters were compared between adult and fetal OPCs from early-to-mid second trimester brains.
Materials and Methods
Ethics statement
All procedures with human adult and fetal CNS tissues were approved by the Montreal Neurological Institute and Hospital Research Ethics Board (approval ID #ANTJ1988/3) and the Albert Einstein College of Medicine Institutional Review Board (approval ID #1993-042). Informed consent was received from all tissue donors. Experiments using animals were approved by the Montreal Neurological Institute Animal Care Committee (approval ID #4330) and performed in accordance with the Canadian Council on Animal Care guidelines for the use of animals in research.
Cell isolation
Adult and fetal brain cell isolations were prepared based on published protocols.15 Adult brain tissue was obtained from surgical resections from patients (26–39 years old) undergoing nontumor-related intractable epilepsy surgery. Fetal brain tissue (15–20 gestation weeks) was acquired from the Human Fetal Tissue Repository (Albert Einstein College of Medicine, Bronx, NY). Tissue was first dissociated in 0.25% trypsin (Invitrogen, Burlington, Canada) and 25 μg/mL DNase I (Roche, Laval, Canada) for 30 min at 37°C and then passed through a 140 μm nylon mesh. Adult brain cells were further separated on a linear 30% Percoll gradient (GE Healthcare, Baie d'Urfe, QC, Canada) to remove myelin debris and red blood cells. Fetal brain cells were obtained from a premyelinating time point; hence no additional separation step was required. Total brain cells were cultured in N1 and bovine serum albumin (BSA) containing Dulbecco's Modified Eagle Medium (DMEM)/F12 medium overnight and the floating cell fraction was collected for FACS.
Fluorescence activated cell sorting
To identify myelin lineage cell subsets, total brain cells were labeled with anti-human PE-conjugated mouse anti-O4 (Miltenyi Biotec, Auburn, CA), APC-conjugated mouse anti-A2B5 (Miltenyi), mouse anti-MOG (Millipore, Temecula, CA), V450-conjugated rat IgG1 (BD Biosciences, Mississauga, ON), or concentration-matched isotype controls at 4°C in 1 mmol/L ethylenediaminetetraacetic acid (EDTA)/fetal bovine serum supplemented phosphate-buffered saline (FBS-PBS). Immunolabeled neural cells were analyzed for expression of the surface markers on BD FACSAria™ II (BD Biosciences) (equipped with 405 nm, 488 nm and 633 nm lasers) using BD FACSDiva™ 6.1.3 software (BD Biosciences). To gate for viable cells, propidium iodide (Invitrogen) was added to the labeled cell samples just before sorting.
Organotypic slice cultures and OPC transplantation
Organotypic cerebellar slice cultures from shiverer−/− mice were prepared based on a published protocol.16 Briefly, cerebellum from P0 shiverer pup was extracted in L15 medium and 300 μm sagittal slices were cut using a McIIwain tissue chopper. Slices were separated and plated onto Millicel-CM culture inserts (Millipore) in 6-well culture plates. Each culture well contained 1 mL of minimal essential medium containing 25% heat-inactivated (HI) horse serum, 25% Earle's balanced salt solution, 6.5 mg/mL glucose (Sigma-Aldrich, St Louis, MO) and penicillin/streptomyosin and glutamax supplements (all from Invitrogen). Culture inserts were transferred into fresh media every 2–3 days. Slices were cultured for 10–12 days in vitro (DIV) prior to OPC transplantation to allow for clearance of debris. Cultures were gradually switched to serum-free medium starting from the second media change. Serum-free media was composed of DMEM/F12 supplemented with N2, B27, and penicillin/streptomyosin. At the time of transplant and thereafter, cultures were maintained in serum-free media. For OPC transplantations, each shiverer cerebellar slice received 20,000 cells in two 0.5 μL injections using a glass-pulled pipette tip. Transplanted slices were cultured for 5 weeks before analysis. Ensheathment efficiency was measured as the number of times myelin basic protein (MBP)(+) myelin was detected relative to the number of transplants and number of ensheathments was defined as the number of MBP(+) patches per slice.
Immunochemistry
At 5 weeks posttransplantation, cerebellar slices were rinsed and fixed in 4% paraformaldehyde (PFA) for 1 h at room temperature. Individual slices were cut out from culture inserts and blocked for 3 h at room temperature in Hank's Balanced Salt Solution (HBSS) containing 1 mmol/L 4-(2-hydroxyethyl)-1-piperazineethanesulfonic acid (HEPES), 2% HI horse serum, 10% HI goat serum, and 0.25% Triton x-100. Slices were incubated with the following antibodies: mouse anti-MBP (Sternberger Monoclonals Inc, Lutherville, MD), chicken antineurofilament medium chain (NFM) (EnCor Biotech, Alachua, FL) and mouse anti-human nuclei (Millipore) diluted in blocking solution for 48 h at 4°C. Slices were washed 3 × 1 h in PBS and then incubated with anti-mouse IgG2b Texas Red (AbD serotec, Raleigh, NC), anti-chicken Alexa488 (Molecular Probes, Eugene, OR) and anti-mouse Alexa647 (Molecular Probes) secondary antibodies also diluted in blocking solution for 24 h at 4°C. Slices were washed then mounted in Fluoromount G (Southern Biotech, Birmingham, AL).
RNA isolation and qRT-PCR
Total RNA was extracted from cell samples using standard Trizol® protocol followed by DNase treatment according to manufacturer's instructions (Qiagen, Valencia, CA). Multiplexed RT reactions were performed using a mixture of miRNA-specific RT primers and a Taqman® MicroRNA RT kit (Life Technologies Inc., Burlington, ON, Canada). Individual miRNA expression assays were done using specific miRNA Taqman® probe in an ABI 7000 thermocycler. For qRT-PCR of myelin lineage transcripts, individual transcript expression was done using a specific primer set for each transcript. Fold change calculations for myelin lineage transcript expression were performed using the ΔΔCT method.17
MicroRNA analysis
For miRNA expression analysis, we selected a specific panel of miRNAs based on reports implicating them in OPC development.9,10,13,14,18 Data S1 summarizes the reported detection and/or functions of the selected miRNAs, together with their reported targets. Detectable miRNAs were defined as having Ct values ≤35. RNU48 was used as an endogenous qRT-PCR control. Standard deviation of the Ct values of 0.5 ≤ Ct SD ≥ 1 between duplicates were accepted. Delta Ct values of all miRNAs relative to RNU48 were imported into Partek Genomics Suite 6.0 for principal component analysis (PCA), Pearson correlation, and hierarchical clustering analyses. All miRNAs with an expression value below detection were assigned a delta Ct value of 20. Principle component analysis was performed to identify main sources of variation in the expression data matrix. To investigate which conditions (cell subsets) were more or less similar, a similarity matrix based on Pearson correlation analysis was constructed. A correlation coefficient of r = 1 was observed when the conditions were compared to themselves. To identify the patterns of individual miRNA expression, hierarchical clustering was performed.
Results
Phenotypic characterisation of human adult progenitor cells
Three distinct subsets of myelin lineage progenitors were identified in adult human brains. First, the A2B5(+)O4(−)MOG(−) OPCs which we refer to as adult A2B5(+) OPCs (highlighted in blue Fig. 1B and D); second, the A2B5(−)O4lowMOG(−) that we refer to as adult O4low OPCs (highlight in yellow Fig. 1C-C‴ and D); and third, the A2B5(+)O4(+)highMOG(+) OPCs which we refer to as adult triple positive OPCs (highlighted in pink in Fig. 1D-D′). Adult A2B5(+) OPCs made up to 2.38 ± 0.38% of total viable oligodendroglial cells, while adult O4low OPCs and triple positive OPCs were 13.38 ± 3.48% and 12.87 ± 1.18%, respectively (Table 1A). As anticipated, the majority (63.06 ± 2.61%) of adult myelin lineage cells were mature oligodendrocytes which were A2B5(−)O4highMOG(+) (highlighted in green in Fig. 1D-D′).
Figure 1.

Three populations of oligodendrocyte progenitor cells and one population of mature oligodendrocytes were isolated from adult human brain by O4-, A2B5- and MOG-directed FACS. (A) A two-dimensional plot of unstained sample for total viable neural cells derived ex vivo from adult temporal cortex. Plot is also representative of isotype controls. (B) Single labeling of total neural cells with A2B5 monoclonal antibody (isotype controls for anti-O4 and anti-MOG added) revealed only one population of A2B5(+) progenitors (blue). (C) Single labeling of total neural cells with O4 monoclonal antibody (isotype controls for anti-A2B5 and anti-MOG added) revealed an O4low (yellow) and an O4high (green) population. (C′-C‴) Histograms showing 100% of the O4low subset (yellow in C′) that was negative for A2B5 (C″) and MOG (C‴). (D) Triple-labeling of total neural cells shown on A2B5-APC and O4-PE axes. The O4low subset (indicated in yellow) that was A2B5(−) and MOG(−) remained to be detected. A small number of A2B5(+) progenitors were O4(−) (indicated in blue) and most A2B5(+) cells colabeled with O4high population (indicated in pink). (D′) Of the O4high population including those expressing A2B5 (green and pink in D), 98.4% of these cells were MOG(+) which represented the mature oligodendrocytes in adult brain. The histogram also depicts the subset which was O4high A2B5(+) (pink in D) that was also MOG(+).
Table 1.
Multiple populations of myelin lineage cells in (A) adult and (B) fetal brains
| (A) | Age |
|---|---|
| Markers | 28–39 years old1 |
| A2B5(+)O4(−)MOG(−) | 2.38 ± 0.38 |
| A2B5(−)O4lowMOG(−) | 13.38 ± 3.48 |
| A2B5(+)O4highMOG(+) | 12.87 ± 1.18 |
| A2B5(−)O4highMOG(+) | 63.06 ± 2.61 |
| (B) | Gestation weeks | |
|---|---|---|
| Markers | Tl, 15–172 | T2, 18–203 |
| A2B5(+)O4(−) | 73.18 ± 13.18 | 37.87 ± 16.89 |
| A2B5(+)O4(+) | 15.65 ± 4.63 | 19.93 ± 8.02 |
| A2B5(−)O4(+) | 11.18 ± 8.96 | 42.17 ± 24.66 |
(A) Oligodendrocyte progenitor cells from adult brains could be divided into three subsets; (1) the A2B5(+)O4(−)MOG(−) OPCs, (2) the A2B5(−)O4(+)lowMOG(−) OPCs, and (3) the A2B5(+)O4highMOG(+) OPCs. Mature oligodendrocytes were defined as A2B5(−)O4high MOG(+) cells and represented the largest subset of oligodendroglial cells in adult brains. (B) During development, the relative abundance of fetal progenitors altered with gestation weeks. The A2B5(+)O4(−) glial precursors were the majority, especially in younger brains (T1, 15–17 gestation weeks), and their numbers decreased at later stages (T2, 18–20 gestation weeks). Both A2B5(+)O4(+) and A2B5(−)O4(+) OPCs increased in numbers with increasing gestation weeks. Percentages ±SEMs were calculated based on viable (PI-) total labeled oligodendroglial cells (combined A2B5(+),O4(+) and MOG(+) fractions for adult cells and A2B5(+) and O4(+) fractions for fetal cells).
n = at least 4 independent adult specimens.
n = 4 independent T1 fetal specimens.
n = 4 independent T2 fetal specimens.
Fetal CNS derived progenitor cells
We identified three myelin lineage subsets from fetal human brains at T1 (15–17 gestation weeks) and T2 (18–20 gestation weeks). At both developmental stages, fetal brains contained (1) A2B5(+)O4(−) glial precursors (GPCs) which we refer to as fetal A2B5(+) GPCs (highlighted in blue Fig. 2B and D); (2) A2B5(−)O4(+) OPCs which we refer to as fetal O4(+) OPCs (highlighted in green Fig. 2C and D); and (3) A2B5(+)O4(+) double positive OPCs (highlighted in pink Fig. 2D). Fetal A2B5(+) GPCs were relatively abundant, accounting for 73.18 ± 13.18% at T1 and 37.87 ± 16.89% at T2 of total viable oligodendroglial cells (Table 1B). Fetal O4(+) OPC numbers were 11.18 ± 8.96% at T1, and increased to 42.17 ± 24.66% at T2. Double positive OPCs accounted for 15.65 ± 4.63% and 19.93 ± 8.02% at T1 and T2, respectively (Table 1B). Fetal brains of the gestation ages used in the current study were premyelinating and did not contain MOG(+) OPCs or oligodendrocytes.19–21
Figure 2.

Two subsets of oligodendrocyte progenitor cells and a subset of glial precursors were isolated from fetal human brain of early-to-mid second trimester. (A) Isotype controls or unstained (shown) plot of total viable neural cells derived ex vivo from fetal cortex. (B) Single labeling of total neural cells with an A2B5 monoclonal antibody (isotype control for anti-O4 added) showed one population of A2B5(+) precursors. (C) Single labeling of total neural cells with an O4 monoclonal antibody (isotype control for anti-A2B5 added) also showed one population of O4(+) OPCs. (D) Double-labeled total neural cells showed an A2B5(+)O4(−) glial precursor subset (blue), an A2B5(−)O4(+) OPC subset (green) and an A2B5(+)O4(+) double positive OPC subset (pink) in fetal human brain.
Quantitative RT-PCR of myelin lineage transcripts
Isolated adult O4low (green bars Fig. 3A) and fetal O4-expressing OPCs (pink and green bars Fig. 3B) expressed higher levels of Olig2, Nkx2.2, and platelet derived growth factor (pdgf)αR compared to A2B5(+) progenitors (blue bars Fig. 3A and B). We found that adult O4low and fetal O4(+) OPCs expressed high levels of myelin-associated glycoprotein (MAG) in addition to the OPC transcripts, which was not observed in A2B5(+) progenitors from either adult or fetal brains (Fig. 3A and B). Mature oligodendrocytes expressed a high level of MAG and very little Olig2, Nkx2.2, and PDGFαR (red bars Fig. 3A).
Figure 3.

Myelin lineage specific transcripts expressed by FACS-isolated adult and fetal oligodendrocyte progenitor cells. (A) Adult O4low OPCs (green bars) showed higher expression of Olig2, Nkx2.2, and PDGFαR transcripts compared to adult A2B5(+) OPCs (blue bars). Adult O4low OPCs showed an increased level of MAG transcripts compared to A2B5(+) OPCs. O4low OPCs showed comparable level of MAG transcripts to mature oligodendrocytes (red bars). (B) Fetal O4(+) (green bars) and double positive OPCs (pink bars) showed increased levels of Olig2, Nkx2.2, and PDGFαR transcripts compared to fetal A2B5(+) GPCs (blue bars). In addition, fetal O4(+) OPCs showed a high level of MAG expression, which was not reproduced by A2B5(+) GPCs or A2B5(+)O4(+) OPCs. Data in (A) and (B) represented fold change in transcript level ±SEM relative to fetal A2B5(+) GPCs. n = 4 independent brain samples. MAG, myelin-associated glycoprotein.
FACS-isolated OPCs from adult and fetal brains ensheathed dysmyelinated cerebellar axons of shiverer brains
We transplanted adult and fetal OPCs into cerebellar organotypic slices derived from dysmyelinated shiverer mice as described.16 For fetal cells, we combined both subsets of OPCs expressing O4 (the O4(+) and A2B5(+)O4(+)) and refer to this group as O4-expressing OPCs. For adult cells, we transplanted A2B5(+) OPCs and O4low OPCs, respectively. All adult and fetal progenitors transplanted were able to ensheathe cerebellar axons to varying extents. At 5 weeks posttransplantation, adult O4low OPCs matured into oligodendrocytes and showed MBP(+) ensheathment of shiverer axons (Fig. 4A). Confocal z-stack imaging revealed individual NFM(+) axons wrapped by MBP(+) membranes, typical of myelination (arrowheads in Fig. 4A). Adult A2B5(+) or O4low OPCs showed similar ensheathment efficiency (∼60% of slices contained MBP(+) ensheathments) (Fig. 4C). Fetal O4-expressing OPCs also differentiated into oligodendrocytes with extended cell processes and showed MBP(+) ensheathment of NFM(+) axons (Fig. 4B-B″). Fetal O4-expressing OPCs exhibited a higher number of patches of MBP(+) ensheathment per slice (closed squares Fig. 4D) compared to fetal O4(−) OPCs (closed circles Fig. 4D). In addition, fetal O4-expressing OPCs ensheathed at a higher efficiency, on average 71 ± 9.54% compared to 30.56 ± 10% by O4(−) OPCs (Fig. 4C).
Figure 4.

Isolated oligodendrocyte progenitor cells from adult and fetal brains ensheathed dysmyelinated cerebellar axons of shiverer organotypic slices. (A) A representative orthogonal view of a confocal Z-stack image showing elaborate MBP(+) ensheathment of dysmyelinated axons of shiverer cerebellar slices by adult O4low OPCs at 5 weeks posttransplantation. Magnified x- and y-planes showed individual axonal ensheathments (arrowheads) corresponding to individual axons within the white-boxed regions (arrows). (B-B‴) Selective x- and y-planes within a confocal z-stack image of ensheathments made by fetal O4-expressing OPCs in a shiverer cerebellar slice at 5 weeks posttransplantation. B‴ depicts a merged image of MBP (red), NFM (geen) and human nuclei, hNu (blue) staining showing the overlay (yellow) of MBP-wrapped NFM(+) axons (arrowheads). (C) Fetal O4-expressing OPCs showed higher frequency of axonal ensheathment of cerebellar slices than fetal O4(−) OPCs. Relative to the number of slices transplanted, fetal O4-expressing OPCs ensheathed axons in 71 ± 9.54% of slices, while O4(−) OPCs in 30.56 ± 10% of slices. Adult-derived OPCs with or without O4 expression showed a similar frequency for ensheathment. (D) Fetal O4-expressing OPCs showed a higher number of ensheathments compared to all other cell types transplanted. Data in (C) and (D) represent frequency of ensheathments in% ±SEM and number of MBP(+) patches per slice ±SEM. n = 3–5 independent experiments, except for adult O4low OPC subset where n = 2 independent experiments were used in the final data.
MicroRNA analysis in adult and fetal progenitor cells
PCA was used to identify the main sources of variation in the miRNA expression dataset (Fig. 5A). Adult OPCs and oligodendrocytes formed a cluster distinct from progenitors derived from the developing brains. Within the developing brain samples, progenitors from T1 (15–17 gestation weeks) and T2 (18–20 gestation weeks) separated into two clusters (Fig. 5A). These indicate that a key factor segregating the pattern of miRNA expression in these human cell subsets is the maturation stage of the individuals from which the cells were isolated.
Figure 5.
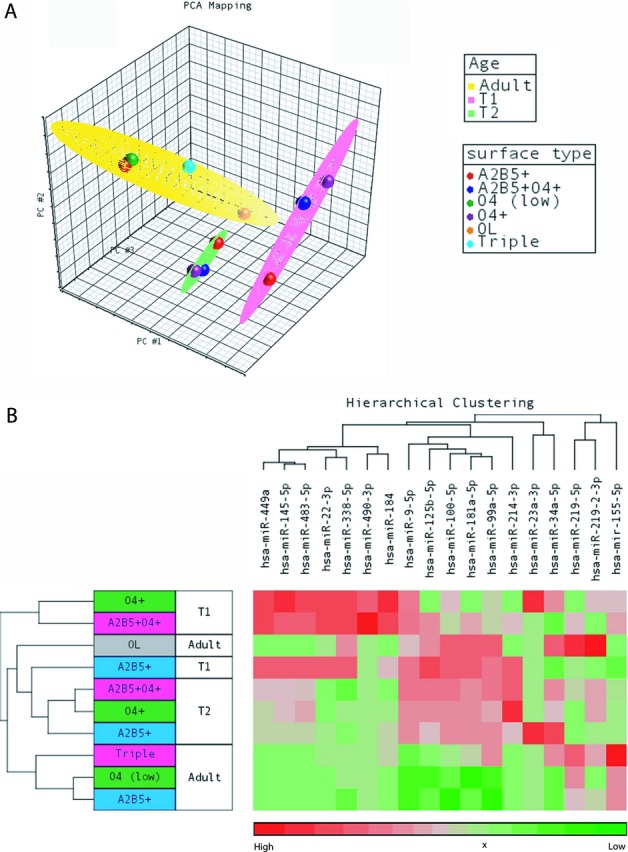
MicroRNA (miRNA) expression analysis of adult and fetal myelin lineage cells. (A) Principal component analysis identified three main clusters of overall miRNA expression between adult-derived, fetal T1 (15–17 gestation weeks) and fetal T2 (18–20 gestation weeks) cell subsets. Adult OPCs and oligodendrocytes formed a cluster distinct from progenitors derived from the developing brains. Within the fetal brain samples, T1 glial precursors and OPCs clustered separately from T2 glial precursors and OPCs. (B) Hierarchical clustering of the qRT-PCR expression data showed that all three adult OPC subsets expressed low to undetectable levels of most of the miRNAs highly expressed in T1 or T2 fetal OPCs (O4-expressing subsets). In addition, fetal OPCs of T1 highly expressed a distinct set of miRNAs, which was different from the miRNAs highly expressed in T2 OPCs. n = 4 or more independent adult, fetal T1 and T2 brain samples. All values to the right of the “x” we considered below the reliable level of detection. OL, oligodendrocyte.
Pearson correlation analysis confirmed that the overall pattern of miRNA expression of adult OPCs (A2B5(+), O4low and triple positive) were more similar with one another (0.89 ≤ r ≤ 1) than with fetal-derived T1 (−0.11 ≤ r ≤ 0.19) or T2 (0.46 ≤ r ≤ 0.63) progenitors (Table 2A). Correlation of adult O4low OPCs to fetal O4(+) OPCs at T1 was r = 0.03 and r = 0.46 at T2 (Table 2A). Correlation of adult A2B5(+) (r = 0.59) and O4low OPCs (r = 0.56) with mature oligodendrocytes was also low. However, there was a stronger correlation of adult triple positive OPCs (r = 0.79) with mature oligodendrocytes (Table 2A). These findings indicate that (1) the pattern of miRNA expression in adult OPCs differs from fetal OPCs and (2) that although they are of the same adult origin, expression of miRNA in adult A2B5(+) and O4low OPCs also differ from mature oligodendrocytes. In developing brains, we documented that progenitor subsets shared more similarity in miRNA expression within a given developmental time point than between time points (Table 2B). T1 O4(+) OPCs shared closer miRNA expression with T1 double positive OPCs (r = 0.89) than with T2 O4(+) OPCs (r = 0.32) (Table 2B). This result supports a temporal regulation of miRNA expression during OPC development.
Table 2.
Pearson correlation analysis of overall miRNA expression among each (A) adult- and (B) fetal-derived myelin lineage populations
| Adult | |||||
|---|---|---|---|---|---|
| (A) | A2B5(+)O4(−)MOG(−) | A2B5(−)O4lowMOG(−) | A2B5high O4highMOG(+) | A2B5(−)O4highMOG(+) | |
| Fetal Tl | A2B5(+)O4(−) | 0.18 | 0.18 | 0.19 | 0.28 |
| A2B5(+)O4(+) | 0.11 | 0.13 | 0.03 | −0.02 | |
| A2B5(−)O4(+) | −0.05 | 0.03 | −0.11 | −0.18 | |
| Fetal T2 | A2B5(+)O4(−) | 0.54 | 0.50 | 0.63 | 0.66 |
| A2B5(+)O4(+) | 0.56 | 0.48 | 0.60 | 0.68 | |
| A2B5(−)O4(+) | 0.54 | 0.46 | 0.56 | 0.63 | |
| Adult | A2B5(+)O4(−)MOG(−) | 1.00 | 0.89 | 0.88 | 0.59 |
| A2B5(−)O4lowMOG(−) | 0.89 | 1.00 | 0.87 | 0.56 | |
| A2B5highO4highMOG(+) | 0.88 | 0.87 | 1.00 | 0.79 | |
| A2B5(−)O4highMOG(+) | 0.59 | 0.56 | 0.79 | 1.00 | |
| Fetal Tl | Fetal T2 | ||||||
|---|---|---|---|---|---|---|---|
| (B) | A2B5(+)O4(−) | A2B5(+)O4(+) | A2B5(−)O4(+) | A2B5(+)O4(−) | A2B5(+)O4(+) | A2B5(−)O4(+) | |
| Fetal Tl | A2B5(+)O4(−) | 1.00 | 0.86 | 0.77 | 0.67 | 0.70 | 0.72 |
| A2B5(+)O4(+) | 0.86 | 1.00 | 0.89 | 0.41 | 0.42 | 0.45 | |
| A2B5(−)O4(+) | 0.77 | 0.89 | 1.00 | 0.30 | 0.27 | 0.32 | |
| Fetal T2 | A2B5(+)O4(−) | 0.67 | 0.41 | 0.30 | 1.00 | 0.96 | 0.94 |
| A2B5(+)O4(+) | 0.70 | 0.42 | 0.27 | 0.96 | 1.00 | 0.98 | |
| A2B5(−)O4(+) | 0.72 | 0.45 | 0.32 | 0.94 | 0.98 | 1.00 | |
| Adult | A2B5(+)O4(−)MOG(−) | 0.18 | 0.11 | −0.05 | 0.54 | 0.56 | 0.54 |
| A2B5(−)O4lowMOG(−) | 0.18 | 0.13 | 0.03 | 0.50 | 0.48 | 0.46 | |
| A2B5highO4highMOG(+) | 0.19 | 0.03 | −0.11 | 0.63 | 0.60 | 0.56 | |
| A2B5(−)O4highMOG(+) | 0.28 | −0.02 | −0.18 | 0.66 | 0.68 | 0.63 | |
Correlation coefficient (r) ranges from −1 to 1. When the conditions were compared to themselves, r = 1 was observed. n = 4 or more independent adult, fetal T1 and T2 brain samples. Subsets of adult OPCs shared a closer overall miRNA expression with one another than with fetal-derived T1 or T2 progenitors. On the other hand, fetal progenitor subsets were more similar in overall miRNA expression within a given developmental time point than between time points.
Hierarchical clustering of the miRNA expression data revealed that all three subsets of adult OPCs have low to undetected expression of the selective miRNAs that were highly expressed in O4-expressing fetal OPCs (the O4(+) or A2B5(+)O4(+)) (Fig. 5B). These included miRs-449a, -145-5p, -483-5p, -22-3p, -338-5p, -490-3p, and -184 that were expressed at a higher level in T1 than T2 O4-expressing OPCs; and miRs-100-5p, -181a-5p, -99a-5p, and -214-3p that were more highly expressed in T2 than T1 O4-expressing OPCs. We found that miRs-219-5p and -155-5p were the only miRNAs highly expressed in adult OPCs that were expressed to a lesser extent by fetal T1 or T2 O4-expressing OPCs (Fig. 5B). As might be anticipated, mature oligodendrocytes expressed a high level of miRs-219-5p and -219-2-3p. In addition, we found that mature oligodendrocytes expressed miRs-338-5p, -9-5p, -125-5p, -100-5p, -181a-5p, -99a-5p, and -34a-5p (Fig. 5B).
Discussion
We have identified three subsets of OPCs from adult human brain that were capable of initiating axon ensheathment and demonstrated that these OPCs express different combinations of miRNAs compared to fetal OPCs and mature oligodendrocytes. We showed that the isolated adult O4low OPCs expressed higher level of the Olig2, Nkx2.2, and PDGFαR myelin lineage transcripts than adult A2B5(+) OPCs. In addition, adult O4low OPCs also expressed higher level of MAG, which is typically associated with cells late in the OPC lineage,21,22 thus confirming that these progenitors correspond to a late OPC subset.
Adult A2B5(+) OPCs have previously been shown to myelinate when transplanted into dysmyelinated shiverer mouse brain in vivo.23,24 Our own findings indicated that such cells were capable of differentiation and ensheathment when cocultured with rat dorsal root ganglion neurons.25 These previous studies did not distinguish A2B5(+) OPCs expressing O4 and MOG (triple positive) identified in the current study. We cannot resolve whether triple positive OPCs found in adult brains have emerged from an initial double positive subset or whether they may have arisen from dedifferentiation of O4highMOG(+) mature oligodendrocytes.26 However, MOG-expressing A2B5(+) OPCs have been previously isolated from rat spinal cords and they were identified as a specific OPC subset capable of remyelination.27 In our study, we showed that adult A2B5(+) and O4low OPCs could differentiate into MBP(+) oligodendrocytes when transplanted into shiverer slices and were able to ensheathe cerebellar axons. We did not observe a difference in efficiency and number of ensheathed patches between A2B5(+) and O4low OPCs.
The relatively limited amount of ensheathment observed using human-derived OPCs compared to transplants of rodent-derived OPCs prevented us from further quantification of myelination such as internodes formation, and evaluation of compact myelin and paranodes formation by electron microscopy, as we did in a previous study.16 Nevertheless, our data suggests that more than one OPC species could contribute to remyelination in vivo.
In comparison, we derived two subsets of O4-expressing OPCs from early (T1) and mid second trimester (T2) fetal brains. These are the A2B5(−) and the A2B5(+) O4-expressing OPCs. Like adult O4low OPCs, fetal O4-expressing OPCs exhibited a higher level of Olig2, Nkx2.2, and PDGFαR transcripts than non-O4-expressing progenitors. MAG was also expressed at a high level in fetal O4(+) OPCs, confirming that O4(+) progenitors correspond to a late OPC subset. We speculate that the double positive subset likely corresponds to progenitors in a stage of developmental transition as this population is not retained in adult brains. In addition, there is a substantial proportion of A2B5(+)O4(−) precursors in human fetal brains. Previous transplant studies indicated that myelination by A2B5(+) cells is dependent on progenitors expressing CD140a, which was detected in a small minority of the overall A2B5(+) cell subset.24,28 We thus refer to the fetal A2B5(+)O4(−) cells as GPCs. We observed that O4-expressing OPCs (with or without A2B5 expression) more efficiently ensheathed shiverer axons than O4(−) progenitors. This is most probably due to the lower number of cells committed to the oligodendroglial lineage in the O4(−) A2B5(+) GPC population.
Correlation analysis demonstrated that adult OPC subsets were more similar in overall expression of miRNAs with one another than with fetal-derived T1 or T2 progenitor subsets. Individually, all three subsets of adult OPCs showed low to undetected expression of miRs-449a, -145-5p, -483-5p, -22-3p, -338-5p, -490-3p, -184 (highly expressed in T1 O4-expressing OPCs), and miRs-100-5p, -181a-5p, -99a-5p, and-214-3p (highly expressed in T2 O4-expressing OPCs). This finding supports the conclusion that a different set of miRNAs regulates OPC differentiation in adulthood compared to development. In contrast, miR-219-5p was more highly expressed in adult OPCs, especially the O4low and triple positive OPCs, than fetal T1 or T2 O4-expressing OPCs. Previous studies reported that expression of miRs-219-5p was induced in rodent OPCs in response to mitogen withdrawal and that forced expression of this miRNA resulted in OPC differentiation by direct repression of PDGFαR, Sox6, FoxJ3, and ZFP238.9,10 Although these findings raise the possibility that miR-219-5p might similarly direct OPC differentiation in the adult human CNS, the relatively low level of expression of this miRNA detected in human fetal OPCs suggests that miR-219-5p may not be critical in the regulation of OPC differentiation at the premyelinating stage in the human CNS. Our findings do not rule out the possibility that miR-219-5p expression may be upregulated later and contribute during the peak period of myelination in human (late third trimester to first decade of life).29,30 MiR-155-5p was also more highly expressed in adult OPCs than fetal OPCs. This miRNA is predominantly known for a mediatory role in inflammation in immune cells.31–34 It is intriguing that this miRNA was highly expressed in adult OPCs. The function and putative targets of this miRNA in human myelin lineage cells remain to be determined.
Our findings also indicate that adult OPCs harbor a different set of regulatory miRNAs compared to mature oligodendrocytes. Correlation of miRNA expression was closest between adult triple positive OPCs and mature oligodendrocytes. We detected high expression of miRs-338-5p, -219-5p, and -219-2-3p in mature oligodendrocytes, which is consistent with reports that these are oligodendrocyte-specific miRNAs.9,10,18 MiR-219-5p was also detected in adult OPCs, indicating that miR-219-5p may have different targets and/or functions in the different cells. In addition, mature oligodendrocytes expressed a number of miRNAs found in developing OPCs such as miRs-9-5p, -125-5p, -100-5p, -181a-5p, -99a-5p, and -34a-5p. The presence of miRNAs in mature oligodendrocytes that are thought to be more characteristic of OPCs suggests that these miRNAs may have different roles in mature oligodendrocytes other than their reported function for OPC differentiation. We speculate that the expression of these miRNAs in oligodendrocytes may influence plasticity for myelin maintenance and repair.
Conclusions
We conclude that phenotypically distinct subsets of OPCs are present in the adult human brain and that these OPCs express different combinations of miRNAs compared to fetal OPCs and mature oligodendrocytes. These findings provide evidence that remyelination in the adult CNS may involve multiple subsets of oligodendrocyte progenitors, and that different miRNA-mediated mechanisms regulate OPC differentiation in the adult human brain and during development.
Acknowledgments
The authors acknowledge Manon Blain, Ellie McCrea and Irene Tretjakoff for technical assistance, Daniele Gagne and Gael Dulude from the flow cytometry core facility at Institute for Research in immunology and Cancer, Bradford Poulos, director of the Human Fetal Tissue Repository at Albert Einstein College of Medicine for providing human fetal brain samples, Andre Olivier and Jeffery Hall, neurosurgeons at the Montreal Neurological Institute for providing human adult brain samples. S. Y. L. was supported by fellowships from Canadian Institutes of Health Research Neuroinflammation Training Program and Multiple Sclerosis Society of Canada. J. M. B. was supported by a Vanier Canada Graduate Scholarship and a Multiple Sclerosis Society of Canada Studentship. T. E. K. was supported by a Fonds Recherché en Santé du Quebec Chercheur National Award and a Scholar award from the Killam Trust. J. P. A. was supported by grants from Canadian Institutes of Health Research and Multiple Sclerosis Society of Canada.
Conflict of Interest
None declared.
Supporting Information
Additional Supporting Information may be found in the online version of this article:
Data S1. Basis for the selection of miRNAs panel for this study.
References
- 1.Barkhof F, Bruck W, De Groot CJ, et al. Remyelinated lesions in multiple sclerosis: magnetic resonance image appearance. Arch Neurol. 2003;60:1073–1081. doi: 10.1001/archneur.60.8.1073. [DOI] [PubMed] [Google Scholar]
- 2.Lucchinetti C, Bruck W, Parisi J, et al. Heterogeneity of multiple sclerosis lesions: implications for the pathogenesis of demyelination. Ann Neurol. 2000;47:707–717. doi: 10.1002/1531-8249(200006)47:6<707::aid-ana3>3.0.co;2-q. [DOI] [PubMed] [Google Scholar]
- 3.Patrikios P, Stadelmann C, Kutzelnigg A, et al. Remyelination is extensive in a subset of multiple sclerosis patients. Brain. 2006;129:3165–3172. doi: 10.1093/brain/awl217. [DOI] [PubMed] [Google Scholar]
- 4.Wolswijk G. Chronic stage multiple sclerosis lesions contain a relatively quiescent population of oligodendrocyte precursor cells. J Neurosci. 1998;18:601–609. doi: 10.1523/JNEUROSCI.18-02-00601.1998. [DOI] [PMC free article] [PubMed] [Google Scholar]
- 5.Kuhlmann T, Miron V, Cui Q, et al. Differentiation block of oligodendroglial progenitor cells as a cause for remyelination failure in chronic multiple sclerosis. Brain. 2008;131:1749–1758. doi: 10.1093/brain/awn096. [DOI] [PubMed] [Google Scholar]
- 6.Franklin RJM, Ffrench-Constant C. Remyelination in the CNS: from biology to therapy. Nat Rev Neurosci. 2008;9:839–855. doi: 10.1038/nrn2480. [DOI] [PubMed] [Google Scholar]
- 7.Dawson MR, Polito A, Levine JM, Reynolds R. NG2-expressing glial progenitor cells: an abundant and widespread population of cycling cells in the adult rat CNS. Mol Cell Neurosci. 2003;24:476–488. doi: 10.1016/s1044-7431(03)00210-0. [DOI] [PubMed] [Google Scholar]
- 8.Pringle NP, Mudhar HS, Collarini EJ, Richardson WD. PDGF receptors in the rat CNS: during late neurogenesis, PDGF alpha-receptor expression appears to be restricted to glial cells of the oligodendrocyte lineage. Development. 1992;115:535–551. doi: 10.1242/dev.115.2.535. [DOI] [PubMed] [Google Scholar]
- 9.Dugas JC, Cuellar TL, Scholze A, et al. Dicer1 and miR-219 are required for normal oligodendrocyte differentiation and myelination. Neuron. 2010;65:597–611. doi: 10.1016/j.neuron.2010.01.027. [DOI] [PMC free article] [PubMed] [Google Scholar]
- 10.Zhao X, He X, Han X, et al. MicroRNA-mediated control of oligodendrocyte differentiation. Neuron. 2010;65:612–626. doi: 10.1016/j.neuron.2010.02.018. [DOI] [PMC free article] [PubMed] [Google Scholar]
- 11.Bartel DP. MicroRNAs: genomics, biogenesis, mechanism, and function. Cell. 2004;116:281–297. doi: 10.1016/s0092-8674(04)00045-5. [DOI] [PubMed] [Google Scholar]
- 12.Bartel DP. MicroRNAs: target recognition and regulatory functions. Cell. 2009;136:215–233. doi: 10.1016/j.cell.2009.01.002. [DOI] [PMC free article] [PubMed] [Google Scholar]
- 13.Lau P, Verrier JD, Nielsen JA, et al. Identification of dynamically regulated microRNA and mRNA networks in developing oligodendrocytes. J Neurosci. 2008;28:11720–11730. doi: 10.1523/JNEUROSCI.1932-08.2008. [DOI] [PMC free article] [PubMed] [Google Scholar]
- 14.Letzen BS, Liu C, Thakor NV, et al. MicroRNA expression profiling of oligodendrocyte differentiation from human embryonic stem cells. PLoS One. 2010;5:e10480. doi: 10.1371/journal.pone.0010480. [DOI] [PMC free article] [PubMed] [Google Scholar]
- 15.Miron VE, Hall JA, Kennedy TE, et al. Cyclical and dose-dependent responses of adult human mature oligodendrocytes to fingolimod. Am J Pathol. 2008;173:1143–1152. doi: 10.2353/ajpath.2008.080478. [DOI] [PMC free article] [PubMed] [Google Scholar]
- 16.Bin JM, Leong SY, Bull SJ, et al. Oligodendrocyte precursor cell transplantation into organotypic cerebellar shiverer slices: a model to study myelination and myelin maintenance. PLoS One. 2012;7:e41237. doi: 10.1371/journal.pone.0041237. [DOI] [PMC free article] [PubMed] [Google Scholar]
- 17.Livak KJ, Schmittgen TD. Analysis of relative gene expression data using real-time quantitative PCR and the 2(-Delta Delta C(T)) method. Methods. 2001;25:402–408. doi: 10.1006/meth.2001.1262. [DOI] [PubMed] [Google Scholar]
- 18.de Faria O, Jr, Cui QL, Bin JM, et al. Regulation of miRNA 219 and miRNA clusters 338 and 17-92 in oligodendrocytes. Front Genet. 2012;3:46. doi: 10.3389/fgene.2012.00046. [DOI] [PMC free article] [PubMed] [Google Scholar]
- 19.Jakovcevski I, Filipovic R, Mo Z, et al. Oligodendrocyte development and the onset of myelination in the human fetal brain. Front Neuroanat. 2009;3:5. doi: 10.3389/neuro.05.005.2009. [DOI] [PMC free article] [PubMed] [Google Scholar]
- 20.Back SA, Luo NL, Borenstein NS, et al. Late oligodendrocyte progenitors coincide with the developmental window of vulnerability for human perinatal white matter injury. J Neurosci. 2001;21:1302–1312. doi: 10.1523/JNEUROSCI.21-04-01302.2001. [DOI] [PMC free article] [PubMed] [Google Scholar]
- 21.Jakovcevski I, Zecevic N. Sequence of oligodendrocyte development in the human fetal telencephalon. Glia. 2005;49:480–491. doi: 10.1002/glia.20134. [DOI] [PubMed] [Google Scholar]
- 22.Rakic S, Zecevic N. Early oligodendrocyte progenitor cells in the human fetal telencephalon. Glia. 2003;41:117–127. doi: 10.1002/glia.10140. [DOI] [PubMed] [Google Scholar]
- 23.Windrem MS, Nunes MC, Rashbaum WK, et al. Fetal and adult human oligodendrocyte progenitor cell isolates myelinate the congenitally dysmyelinated brain. Nat Med. 2004;10:93–97. doi: 10.1038/nm974. [DOI] [PubMed] [Google Scholar]
- 24.Windrem MS, Schanz SJ, Guo M, et al. Neonatal chimerization with human glial progenitor cells can both remyelinate and rescue the otherwise lethally hypomyelinated shiverer mouse. Cell Stem Cell. 2008;2:553–565. doi: 10.1016/j.stem.2008.03.020. [DOI] [PMC free article] [PubMed] [Google Scholar]
- 25.Cui QL, Fragoso G, Miron VE, et al. Response of human oligodendrocyte progenitors to growth factors and axon signals. J Neuropathol Exp Neurol. 2010;69:930–944. doi: 10.1097/NEN.0b013e3181ef3be4. [DOI] [PubMed] [Google Scholar]
- 26.Prabhakar S, D'Souza S, Antel JP, et al. Phenotypic and cell cycle properties of human oligodendrocytes in vitro. Brain Res. 1995;672:159–169. doi: 10.1016/0006-8993(94)01377-t. [DOI] [PubMed] [Google Scholar]
- 27.Crang AJ, Gilson JM, Li WW, Blakemore WF. The remyelinating potential and in vitro differentiation of MOG-expressing oligodendrocyte precursors isolated from the adult rat CNS. Eur J Neurosci. 2004;20:1445–1460. doi: 10.1111/j.1460-9568.2004.03606.x. [DOI] [PubMed] [Google Scholar]
- 28.Sim FJ, McClain CR, Schanz SJ, et al. CD140a identifies a population of highly myelinogenic, migration-competent and efficiently engrafting human oligodendrocyte progenitor cells. Nat Biotechnol. 2011;29:934–941. doi: 10.1038/nbt.1972. [DOI] [PMC free article] [PubMed] [Google Scholar]
- 29.Jakovcevski I, Mo Z, Zecevic N. Down-regulation of the axonal polysialic acid-neural cell adhesion molecule expression coincides with the onset of myelination in the human fetal forebrain. Neuroscience. 2007;149:328–337. doi: 10.1016/j.neuroscience.2007.07.044. [DOI] [PMC free article] [PubMed] [Google Scholar]
- 30.Kinney HC, Karthigasan J, Borenshteyn NI, et al. Myelination in the developing human brain: biochemical correlates. Neurochem Res. 1994;19:983–996. doi: 10.1007/BF00968708. [DOI] [PubMed] [Google Scholar]
- 31.Moore CS, Rao V, Durafourt BA, et al. MiR-155 as a multiple sclerosis-relevant regulator of myeloid cell polarization. Ann Neurol. 2013;74:709–720. doi: 10.1002/ana.23967. [DOI] [PubMed] [Google Scholar]
- 32.Murugaiyan G, Beynon V, Mittal A, et al. Silencing microRNA-155 ameliorates experimental autoimmune encephalomyelitis. J Immunol. 2011;187:2213–2221. doi: 10.4049/jimmunol.1003952. [DOI] [PMC free article] [PubMed] [Google Scholar]
- 33.Leng RX, Pan HF, Qin WZ, et al. Role of microRNA-155 in autoimmunity. Cytokine Growth Factor Rev. 2011;22:141–147. doi: 10.1016/j.cytogfr.2011.05.002. [DOI] [PubMed] [Google Scholar]
- 34.Tarassishin L, Loudig O, Bauman A, et al. Interferon regulatory factor 3 inhibits astrocyte inflammatory gene expression through suppression of the proinflammatory miR-155 and miR-155*. Glia. 2011;59:1911–1922. doi: 10.1002/glia.21233. [DOI] [PMC free article] [PubMed] [Google Scholar]
Associated Data
This section collects any data citations, data availability statements, or supplementary materials included in this article.
Supplementary Materials
Data S1. Basis for the selection of miRNAs panel for this study.