Abstract
Background
Ablation of high-frequency sources in patients with atrial fibrillation (AF) is an effective therapy to restore sinus rhythm. However, this strategy may be ineffective in patients without a significant dominant frequency (DF) gradient. The aim of this study was to investigate whether sites with high-frequency activity in human AF can be identified noninvasively, which should help intervention planning and therapy.
Methods and Results
In 14 patients with a history of AF, 67-lead body surface recordings were simultaneously registered with 15 endocardial electrograms from both atria including the highest DF site, which was predetermined by atrial-wide real-time frequency electroanatomical mapping. Power spectra of surface leads and the body surface location of the highest DF site were compared with intracardiac information. Highest DFs found on specific sites of the torso showed a significant correlation with DFs found in the nearest atrium (ρ=0.96 for right atrium and ρ=0.92 for left atrium) and the DF gradient between them (ρ=0.93). The spatial distribution of power on the surface showed an inverse relationship between the frequencies versus the power spread area, consistent with localized fast sources as the AF mechanism with fibrillatory conduction elsewhere.
Conclusions
Spectral analysis of body surface recordings during AF allows a noninvasive characterization of the global distribution of the atrial DFs and the identification of the atrium with the highest frequency, opening the possibility for improved noninvasive personalized diagnosis and treatment.
Keywords: atrial fibrillation, body surface potential mapping, catheter ablation, Fourier analysis
It has been postulated that atrial fibrillation (AF) in humans is maintained by periodic electric sources that activate the atria at exceedingly high frequencies and result in apparently random and uncoordinated electric activation patterns.1,2 Intracardiac dominant frequency (DF) mapping allows the identification of such high-frequency sites in the atria as a guide to terminate AF by radiofrequency ablation effectively in a significant number of patients.3 Although the high-frequency sources are usually located near the pulmonary veins (PVs),1 they can also be found anywhere in the atria3–6 as is frequently observed in patients with persistent AF.3,7,8 Regardless of specific location, atrial activation by high-frequency sources results in DF gradients whose eradication by radiofrequency ablation predicts long-term freedom of AF in both paroxysmal and persistent AF patients.3 When targeting high-frequency sites, recurrences of AF are more common in patients without a significant DF gradient at baseline.3 The aim of this proof-of-concept study was to determine whether body surface potential mapping (BSPM) can be used to identify high-frequency sources noninvasively during AF. The results suggest that body surface DF maps obtained before the intervention may allow identification of the patients with AF, who are most suitable for ablation and be an aid in the planning of the ablation procedure.
Materials and Methods
Patients
We included patients admitted for ablation of drug-refractory paroxysmal and persistent AF, as approved by the Institutional Ethics Committee of our institution. All patients gave informed consent.
BSPM Recording Protocol
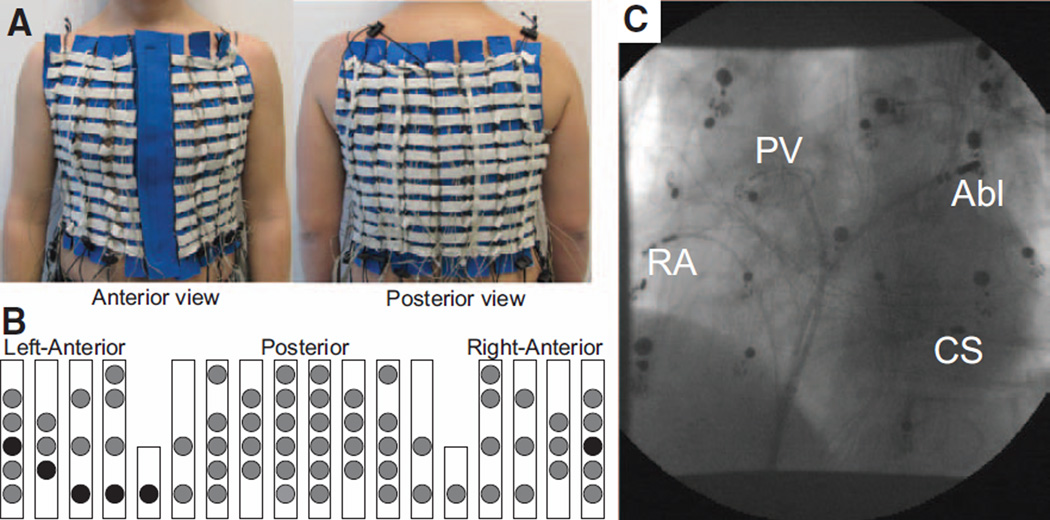
During the entire ablation procedure, patients wore a custom-made, adjustable vest with 67 electrodes covering the entire torso surface (Figure 1). The vest included recording electrodes on the anterior (N=28), posterior (N=34), and lateral sides (N=2) of the torso. In addition, 3 limb leads were recorded and used to obtain the Wilson Terminal. The BSPM vest was placed before the catheterization and fastened anteriorly, allowing access to the patient chest in case external electric cardioversion was needed during the course of the study. Surface ECG recordings were obtained using a commercial system for biopotential measurements (Active Two, Biosemi, The Netherlands) at a sampling frequency of 2048 Hz and stored on hard disk for off-line analyses.9
Figure 1.
The setup of the body surface recording electrodes. A, Anterior and posterior views of the custom-made vest with recording electrodes along vertical blue strips. B, Schematic location of surface electrodes. Circles represent the location of recording electrodes. Electrodes representing the standard ECG precordial leads are denoted as black circles. C, X-Ray image displaying the locations of the intracardiac recording catheters together with the surface leads. Abl indicates ablation catheter; CS, coronary sinus; PV, circular mapping at the right superior pulmonary vein; and RA, right atrium.
Electrophysiological Study and Intracardiac Spectral Mapping of AF
The electrophysiological study was performed under general anesthesia and periodic heparin bolus administrations. The following catheters were introduced via the right femoral vein: (1) a standard tetrapolar catheter in the right atrial (RA) appendage; (2) a deflectable 4-mm mapping catheter (Marinr; Medtronic Inc., Minneapolis, MN) in the distal coronary sinus; (3) a decapolar circular mapping Lasso catheter (Biosense-Webster, Diamond Bar, CA) used to map the PV-left atrial (LA) junctions; and (4) a Navistar catheter (3.5-mm tip, 2-5-2 interelectrode distance; Thermo-Cool, Biosense-Webster, Diamond Bar, CA).
In patients arriving in sinus rhythm, AF was induced by burst pacing. AF episode durations longer than 5 minutes were required for inclusion in the study. The 3-dimensional geometry of both atrial chambers and coronary sinus was obtained and real-time DF determination of all mapped chambers was performed using the CARTO navigation system with embedded spectral analysis capabilities (CARTO XP, version 7.7; Biosense-Webster, Diamond Bar, CA).3,10 Color-coded DF maps during ongoing AF were obtained and superimposed on the atrial shell geometry, as previously described.3,10
Once the highest intracardiac DF site was identified, the navigation catheter was placed at this site and the Lasso catheter was located at the contralateral PV-LA junctions. Then a central venous bolus of adenosine (12–18 mg) was administered to produce significant transient atrioventricular block.10 During adenosine infusion, all intracardiac electrograms (EGMs; at highest DF site, contralateral PV-LA junctions, coronary sinus and RA) were simultaneously recorded together with the 67 surface ECG recordings. A 4-second segment surrounding the longest RR interval was used for comparison of the 15 intracardiac signals and the 67 body surface recordings. In 3 cases, pauses were shorter than 4 seconds and QRST complexes were canceled.11
Signal Analyses
Intracardiac EGM signals from all catheters (ie, RA, coronary sinus, PV-LA junctions, and ablation catheter) were processed using Matlab 7.10.0 (The Mathworks Inc, Natick, MA). Signals were band-pass filtered between 0.7 and 200 Hz. In order to detect the DF of each recording, signals were processed as previously described.3,8,10,12 Briefly, signals were band-pass filtered (40–250 Hz), rectified, and then low-pass filtered (20 Hz). Welch periodogram (2-second Hamming window with a 3908 point Fast Fourier transform per window and 50% overlap) was used to estimate power spectral density. DF was determined as the frequency with the largest peak in the spectrum. As previously described, spurious DFs were excluded or corrected, based on the following criteria: (1) poor signal-to-noise ratio; (2) presence of significant ventricular activity; and (3) erroneous determinations of second or third harmonic peaks as the DF.3
For signal analyses of body surface recordings, ECGs were processed using Matlab 7.10.0. First, baseline was estimated and subtracted from the original recording. To estimate the baseline, ECG signals were decimated to 51.2 Hz and filtered with a Butterworth 10th-order low-pass filter with a cut-off frequency of 2 Hz. Baseline was then interpolated to 2048 Hz and subtracted to the original signal.9 Leads presenting >0.5% of their spectral content at 50 Hz were filtered with a second-order infinite impulse response notch filter centered at 50 Hz. Then, ECG signals were low-pass filtered with a 10th-order Butterworth filter with a cut-off frequency of 30 Hz. All leads were visually inspected after filtering and leads with noticeable noise were excluded from further analysis. Power spectral density of all signals free of ventricular activity was computed using Welch periodogram (2-second Hamming window with a 4096 point Fast Fourier transform per window and 50% overlap) to determine the local DF of the AF and their distribution on the body surface.
Body Surface DF Maps
To construct body surface DF maps for visual display of data, recorded ECG signals properly arranged in space were used to estimate ECG signals at nonrecorded positions using cubic spline interpolation.9 Estimated ECG signals were processed and power spectra and DFs were computed. Two types of color-coded maps were constructed: (1) DF maps obtained by superposition of the DF data obtained from surface ECGs and (2) DF difference maps at which the difference between the surface DFs and the maximal intracardiac DF was displayed.
Body surface DF maps were also used to estimate the relationship between activation frequencies and power spread area. Specifically, the power spectrum of each lead was normalized to its highest value and the normalized spectra were used to display the total spectral content at each frequency band and spatial location.
Results
Patients and Body Surface Mapping Protocol
Fourteen patients undergoing ablation for drug-refractory AF (age: 56±8 years; 93% male; 10 paroxysmal, 4 persistent) were included in the study. On arrival to the electrophysiology laboratory, 10 patients were in sinus rhythm and AF was induced by incremental burst pacing. Adenosine infusion produced atrioventricular block longer than 4 seconds in 11 patients (7.5±2.6 seconds) and significant bradycardia in the other 3 patients, each with 2, 3, and 4 QRST complexes within the 4-second Hamming window studied. During adenosine infusion, 12 patients (9 paroxysmal and 3 persistent) presented a DF gradient of >0.5 Hz in the recorded EGMs (Table in the online-only Data Supplement).
Noninvasive Identification of Atrial DFs During AF
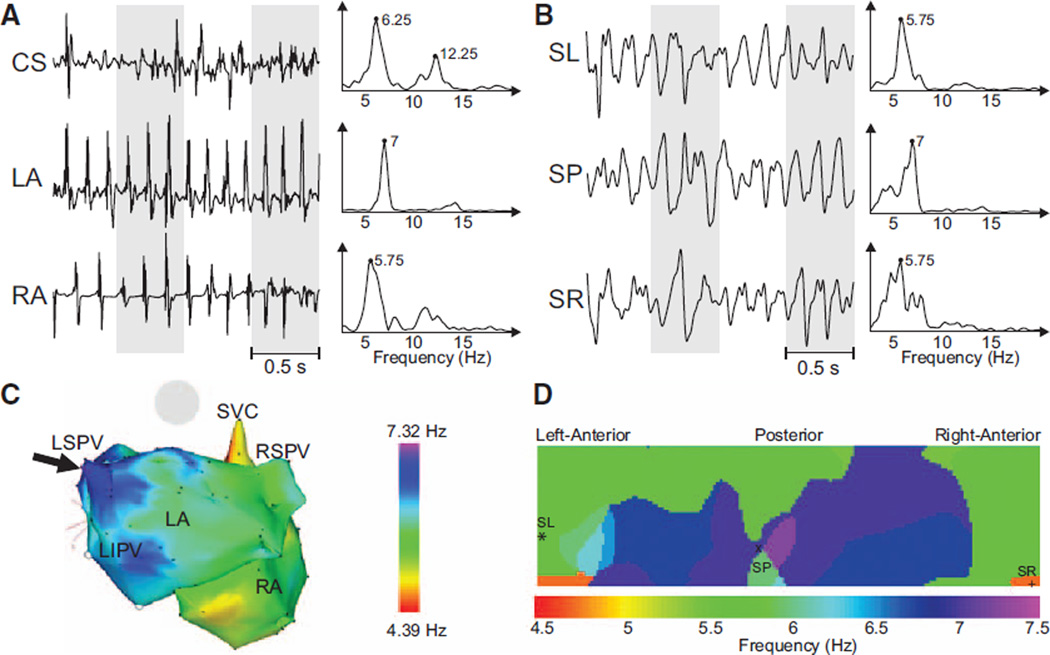
Surface leads and simultaneously recorded intracardiac signals presented closely related spectral components. In Figures 2–4, we present spectral analyses of data from 3 representative patients with varying distribution patterns of activation frequency. The presence of distinct atrial sites with high-frequency activity could be determined noninvasively, as demonstrated in the example shown in Figures 2 and 3. In Figure 2A, 3 representative EGMs illustrate the range of activation rates across the atria, with DFs ranging from 5.75 Hz in the RA to 7 Hz in the LA near the left superior PV. Simultaneously recorded surface leads also showed different DFs at nearly the same frequency range found in the EGM recordings, as shown in Figure 2B by 3 representative leads corresponding to the surface left, surface posterior, and surface right regions. Surface DFs mostly correlated with the activation rate of nearest atrial tissue: the highest endocardial DF point was observed at the nearest point on the torso surface (central posterior) and the lowest activation rate of the RA was found at the nearest portion of the surface ECG (right inferior). Intracardiac CARTO DF maps obtained before adenosine infusion and surface DF distributions obtained during adenosine infusion showed good correspondence (Figure 2C and 2D), but a direct comparison of frequencies from CARTO and surface maps was unattainable because of its sequential nature and because adenosine accelerates AF activation in humans.
Figure 2.
Recorded electrograms (EGMs) and ECGs and their dominant frequency (DF) distribution in a sample patient with a left-to-right DF gradient. A, Three examples of EGMs recorded at different atrial sites and their corresponding power spectra. B, Selected surface body surface potential mapping leads: surface left (SL), surface posterior (SP) and surface right (SR), and their corresponding power spectra. C, Intracardiac DF map. Black arrow points to the left atrial (LA) region with highest DF at the left superior pulmonary vein (LSPV). D, DF map on the torso surface with superimposed locations of electrodes from (B). CS indicates coronary sinus; LIPV, left inferior pulmonary vein; RA, right atrium; RSPV, right superior pulmonary vein; and SVC, Superior vena cava.
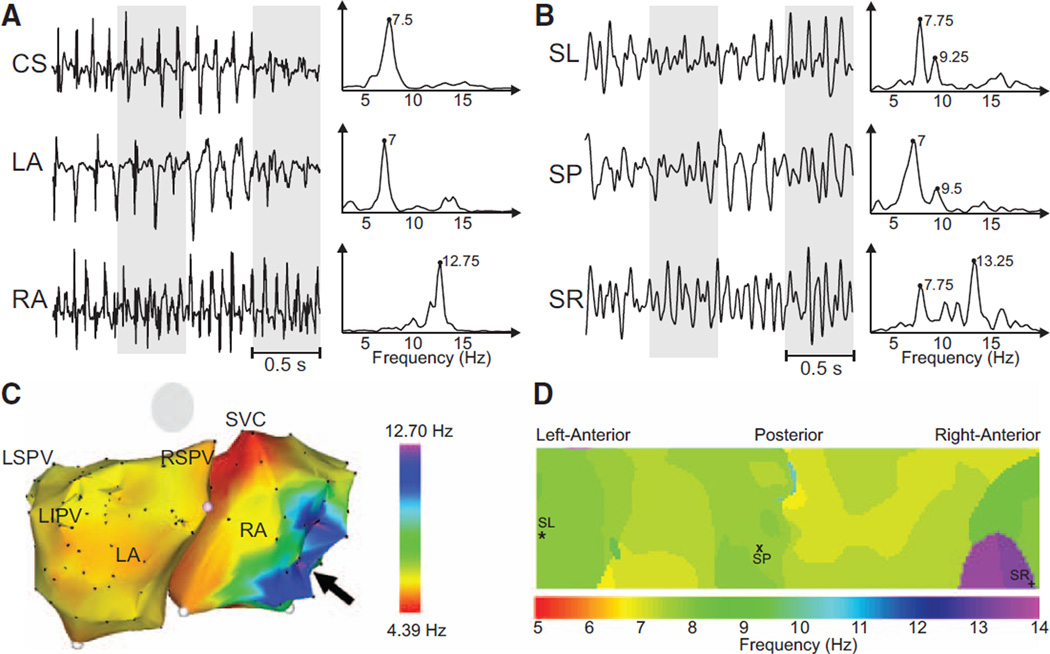
Figure 3.
Recorded electrograms (EGMs) and ECGs and their dominant frequency (DF) distribution in a sample patient with a right-to-left DF gradient. A, EGMs recorded at different atrial sites and their corresponding power spectra. B, Selected surface body surface potential mapping leads and their corresponding power spectra. C, Intracardiac DF map. Black arrow points to the right atrial (RA) region with highest DF at the RA. D, DF map on the torso surface with superimposed locations of electrodes from (B). CS indicates coronary sinus; LA, left atrial; LIPV, left inferior pulmonary vein; LSPV, left superior pulmonary vein; RSPV, right superior pulmonary vein; SL, surface left; SP, surface posterior; SR, surface right; and SVC, superior vena cava.
In a patient with a right-to-left frequency pattern, DFs of intracardiac recordings were again present in the spectra of simultaneously recorded surface ECGs (Figure 3A and 3B). Activation of the RA was at 12.75 Hz, and a similar frequency (13.25 Hz) could be found on the right torso. For this patient, an intracardiac DF map acquired before adenosine infusion showed a right-to-left DF distribution, where the highest DF point was located on the posterolateral RA wall (Figure 3C). The surface DF map also showed a right-to-left DF gradient with the highest DF on the right surface (Figure 3D).
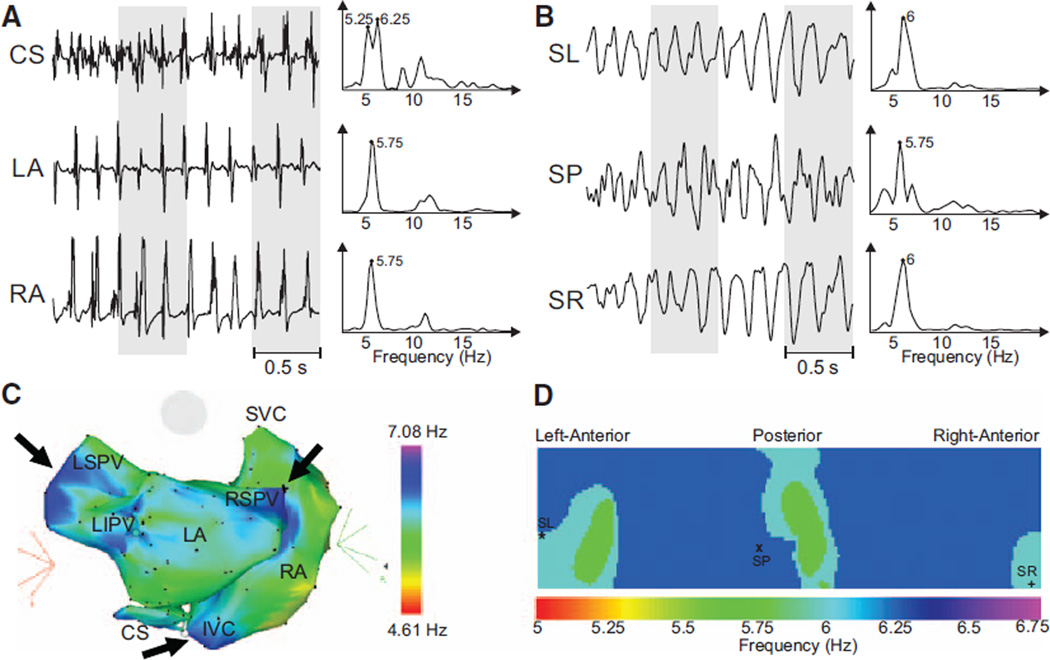
Figure 4C shows an intracardiac DF map of a patient with persistent AF, where frequencies within a 5.25 to 6.25 Hz range were distributed widely across both atria such that a clear DF gradient could not be found. The body surface map showed very similar spectra profiles in all leads (Figure 4B). In this patient, therefore, a DF gradient could not be found by the either intracardiac recordings or surface ECGs (Figure 4D).
Figure 4.
Recorded electrograms (EGMs) and ECGs and their dominant frequency (DF) distribution in a sample patient without a significant left-to-right DF gradient. A, EGMs recorded at different atrial sites and their corresponding power spectra. B, Selected surface body surface potential mapping leads and their corresponding power spectra. C, Intracardiac DF map. Black arrows point to the various regions with high DF. D, DF map on the torso surface with superimposed locations of electrodes from (B). CS indicates coronary sinus; IVC, inferior vena cava; LA, left atrial; LIPV, left inferior pulmonary vein; LSPV, left superior pulmonary vein; RA, right atrial; RSPV, right superior pulmonary vein; SL, surface left; SP, surface posterior; and SR, surface right; SVC, superior vena cava.
Previous studies have highlighted the major role of maximal DF (DFmax) sources in the maintenance of AF in animals and humans.1–8,10,13 Arguably, prior knowledge of which atrium harbors the DFmax source that maintains the arrhythmia may allow better planning of the ablation procedure, and may accelerate the intracardiac localization of the highest DF point and reduce ablation time. Thus, we explored the ability of the body surface DFs to capture the intracardiac DFmax.
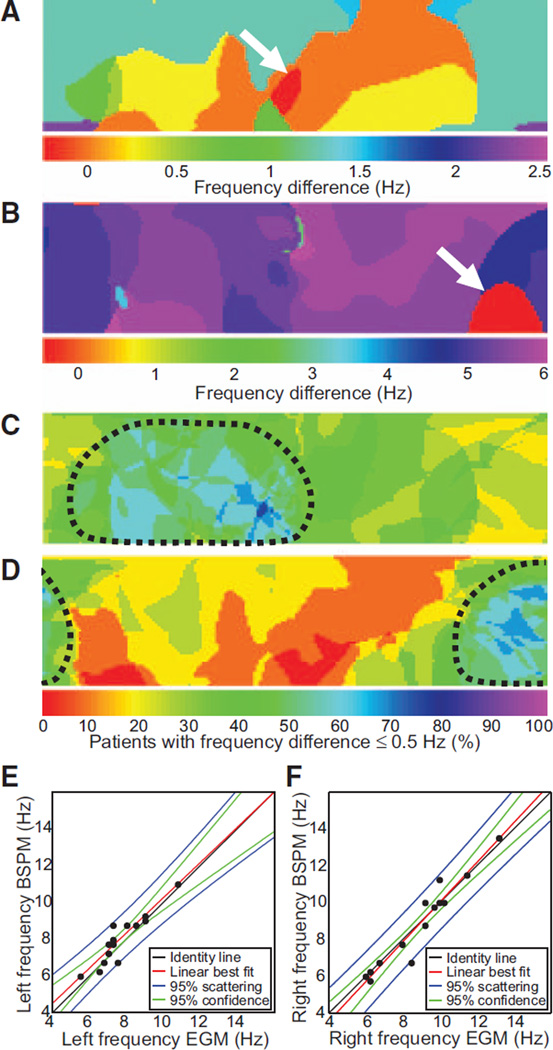
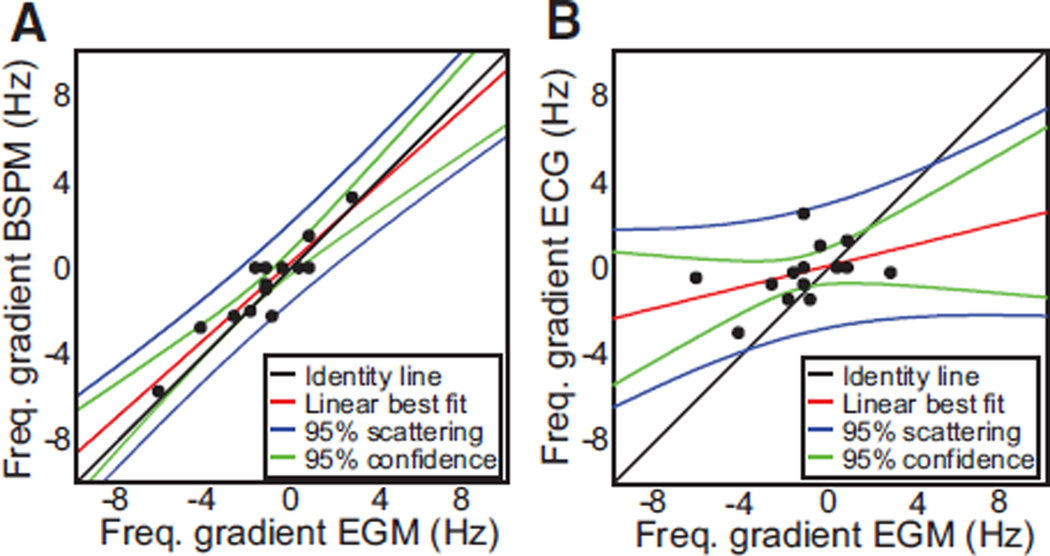
In Figure 5A and 5B, we display difference maps obtained by subtracting DF values on the surface map from the intracardiac DFmax in patients from Figures 2 and 3, respectively. In each case, the white arrow points to the red color DFmax domain on the surface, which corresponds to the region with zero difference with the intracardiac DFmax. These examples demonstrate that the surface DFmax can accurately detect the value of the intracardiac DFmax value, regardless of whether the latter is localized to the LA or the RA (white arrows in Figure 5A and 5B, respectively). To further analyze the correspondence between intracardiac and surface AF frequencies in the RA and LA, we grouped the intracardiac DFmax values measured in the LA and the RA and correlated them with the DFs of EGMs from matching portions on the body surface. These matching portions were defined as those in which the difference between the intracardiac DFmax in each atrium and the surface DFmax was ≤0.5 Hz. Figure 5C and 5D shows that when the entire patient population under study was included, there was a good correspondence between maximum DFs found in each atrial chamber and right and left matching portions of the body surface, respectively. The correlation between right surface leads and right intracardiac EGMs was 0.96, whereas correlation for left leads with left intracardiac EGMs was 0.92 (Figure 5E and 5F). The attempted correlation of surface leads with EGMs of the opposed atrial chamber yielded much lower correlation values (RA body surface leads versus intracardiac LA EGMs, 0.26; 1 tail t test after Fisher r-to-z transform: P<0.0001 versus r=0.96; left body surface leads versus intracardiac RA EGMs, 0.46; P=0.0052 versus r=0.92). Such a strong, side-specific correspondence of frequencies enabled reliable determination of atrial frequency gradients noninvasively. In Figure 6, we have plotted LA-to-RA DF gradients on the body surface versus those measured by the intracardiac EGMs in each individual patient. As shown in Figure 6A, the DF gradients on the BSPM showed a good correlation with the DF gradients obtained by the simultaneous intracardiac EGMs (correlation coefficient=0.93). However, in Figure 6B, surface frequency gradients estimated by the standard ECG leads yielded a poor correspondence with gradients estimated from the intracardiac EGMs, with a correlation coefficient equal to 0.41 when considering all standard leads, or equal to 0.51 when considering only V1 and V6 (P=0.0051 when compared with the correlation of the full BSPM DF gradients).
Figure 5.
Correspondence between intracardiac and surface dominant frequencies (DFs). A and B, Differences between maximum intracardiac electrogram (EGM) DF and local surface DF represented in a color scale for 2 different patients. The red color domain on the surface (white arrows) represents the region with zero difference between the intracardiac and the surface DFs. A, Patient from Figure 2 with a left-to-right DF gradient. B, Patient from Figure 3 with right-to-left DF gradient. C and D, Summary maps showing the percent patients with the surface DFs <0.5 Hz different than the maximal left (C) and maximal right (D) intracardiac DFs. Areas outlined by the dashed curves represent the portion of the torso with a best correspondence with left and right EGMs. E, Correlation plot showing highest DFs found in left EGMs vs highest DFs found on the left portion of the torso. F, Correlation plot showing highest DFs found in right EGMs vs highest DFs found on the right portion of the torso. BSPM indicates body surface potential mapping.
Figure 6.
Regional differences (gradients) of intracardiac dominant frequency (DF) and their reflection on the body surface. A, Frequency gradients calculated as highest left DF minus highest right DF. Body surface potential mapping (BSPM) gradients are plotted against those from the electrograms (EGMs). B, Frequency gradients from the standard ECG are plotted against those from the EGMs. For the standard ECG’s DF gradient, highest left frequency was selected among aVL, V4, V5, and V6 leads, and highest right frequency was selected among aVR, V1, and V2.
To predict the ability of the BSPM to detect intracardiac LA-to-RA DF gradients, we classified patients with a LA-RA gradient in DF (maximal right and left values differ by >0.5 Hz) versus without LA-RA gradient, otherwise. Overall, the sensitivity of the BSPM to capture intracardiac EGMs as having LA-RA gradient in DF was 75%, but the specificity of the BSPM in capturing those gradients was 100%. The sensitivity and specificity of the standard ECG leads V1 and V6 in detecting a LA-to-RA DF gradient were 67% and 50%, respectively. Although the BSPM was able to identify most, but not all, intracardiac DF gradients, each DF gradient identified by the BSPM was a true gradient as determined by the intracardiac recordings. Standard ECG leads, however, allowed the detection of a lower proportion of patients with LA-to-RA DF gradients as compared with all BSPM leads and also mistakenly identified LA-RA DF gradients that were not confirmed in the EGM recordings.
These results lead to the conclusion that, unlike high-resolution BSPM, the standard precordial ECG leads alone are not a useful tool when attempting to localize the site of DFmax sites responsible for AF maintenance.
Interpretation of Surface DF Maps
The foregoing suggests that BSPM reflects intracardiac DFs of nearest atrial tissue and is able to capture the regional differences in atrial activation rates. However, it should be noted that the spatial distribution in DF values on the surface is not continuous and abrupt stepwise transitions between adjacent domains with different frequencies are the norm (Figure 3D). Optical mapping experiments in sheep heart preparations14,15 found that the stepwise transition in DFs is a result of continuous but opposing changes in power levels at the spatially adjacent DFs (ie, as the power of a DF in a given domain decreases toward a domain border, the power under a different frequency grows gradually and eventually becomes dominant). We tested whether similar transitions in spectral power occur at the level of the BSPM.
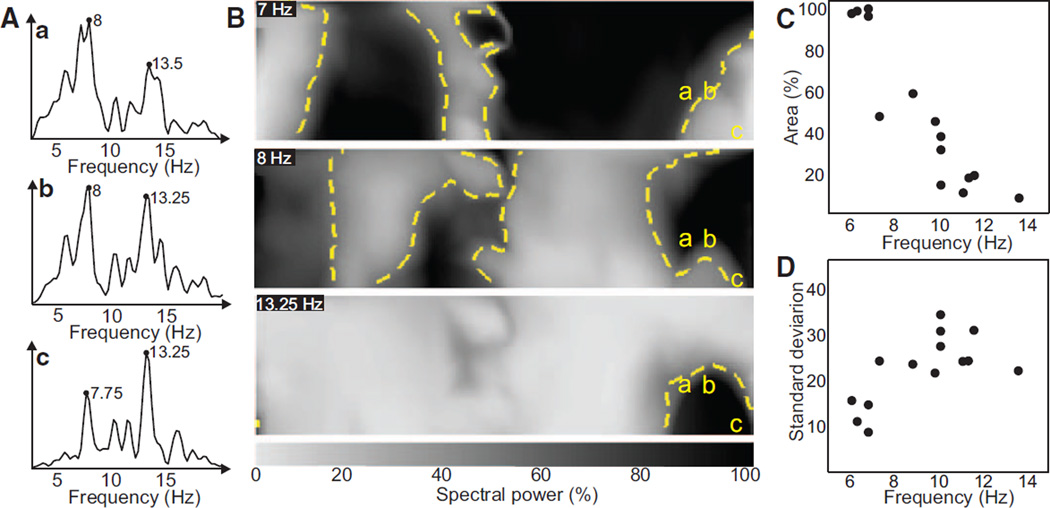
In Figure 7A and 7B, we illustrate power distribution of 3 spectral components (7 Hz, 8 Hz, and 13.25 Hz) for the patient analyzed in Figure 3. Figure 7A shows the power spectra of each of 3 sample leads on the right anterior torso (a, b, and c) that displayed significant power at 7 to 8 Hz and 13.25 Hz. From Figure 3, we learned that the power at any given spectral component was highest for the surface leads that were closest to its intracardiac origin. Figure 7B shows that the power under the normalized peaks at 7, 8, and 13.25 Hz changes gradually from lead a to c. Please note that each surface electrode contains frequency components related to the activation frequency of many atrial regions and not only the closest atrial tissue, which is evident by the significant peaks on the power spectra of leads a-c in Figure 7A. Abrupt spectral changes between 2 neighboring electrodes of the surface DF map displaying different frequency components can nevertheless be explained as a change in the power under the main DF peak of each electrode.
Figure 7.
Spatial representation of the spectral power on the surface and characteristics of spatial distribution of power at highest surface dominant frequency (DF). A, Power spectra of 3 surface leads in sites labeled a, b, and c. B, Maps of the normalized spectral content at 3 discrete frequencies. Yellow dashed contours delineate the 50% maximal power borders. C, Percentage area presenting >50% maximal power at the maximum DF found on the surface of each patient. D, SD of the power map at the maximum DF found on the surface.
Finally, the highest frequency components were typically found occupying small DF domains of the body surface. In fact, there was a negative correlation (ρ=0.92) between the frequency of the highest DF and the area at which that frequency presented at least 50% of the power of the highest peak of the spectrum (Figure 7C). The power of high spectral components also showed higher spatial variability than that of low spectral components, as depicted in Figure 7D, with a correlation coefficient=0.66.
Discussion
The main finding of the present study is that spatial gradients of activation frequency in human AF can be detected and quantified noninvasively by constructing DF maps on the body surface. Although most surface leads predominantly reflect the rate of activation of the overall atrial tissue, high-frequency sources can also be reflected on the surface electrodes closest to the atria harboring the highest DF as measured by intracardiac EGMs. Our results also demonstrate that the portion of the torso at which these high-frequency components are dominant relates inversely with the frequency and thus the highest DF is reflected in a small area of the body surface. Estimation of DFs from the limited number of precordial surface leads (ie, the standard ECG), therefore, does not reproducibly allow detection of highest DF sites.
Frequency Mapping in Human AF
Real-time DF mapping in AF is an effective guidance tool for AF ablation. High-frequency sites within the atria have been associated with driving sources responsible for the maintenance of AF.16 Sanders et al8 demonstrated that in most cases arrhythmia termination was associated with ablation of high-DF sites. Atienza et al3 also showed that patients with LA-to-RA frequency gradients benefited from radiofrequency ablation with improved long-term outcome when such gradients were eliminated, whereas success rate was significantly lower in patients without left-to-right DF gradient before ablation. Those results were consistent with the existence of high-frequency drivers. Therefore, it seems reasonable to suggest that their identification before the ablation procedure may be crucial for delivering a successful therapy for AF. Although the highest frequency sources are most commonly located in the junction of the left atrium with the PVs,1 they have also been identified elsewhere in the atria.3–6,8
Atrial Frequency Estimation From the Surface ECG
Previous studies have demonstrated that the surface ECG can be used as an estimator of the atrial electric activity. In fact, several studies have shown that spectral features of surface ECG recordings are highly correlated with intracardiac recordings17,18 and have been used to monitor the response to antiarrhythmic drugs,19 to predict patient outcome after cardioversion20 and to assess the global effect of different strategies of AF ablation.21 The general acceptance of the existence of high-frequency sources responsible for the maintenance of AF motivated more recent studies to investigate whether distinct frequencies present in RA and LA could be identified on surface ECG recordings. Dibs et al22 studied the reflection of atrial frequencies obtained sequentially from multiple sites in both atria and the standard ECG. Although they reported a good correspondence between mean RA frequencies with lead V2 and LA frequencies with lead V6, extrapolation of these results is hampered by the little differences found between mean frequencies from RA and LA. Petrutiu et al23 also reported a good correspondence between measurements from RA with lead V1 and LA with a posterior lead, but they had access to just 1 recording site in each atrium reflecting, most likely, the mean activation rate of each chamber. None of the above studies answered the question of whether high-frequency activity, that may involve the activation of small portions of atrial tissue, can be found on the surface ECG. Finally, although the inverse ECG imaging technique also uses a multitude of surface recordings and has been used to characterize some AF waves,24 to our knowledge, it has not been used for frequency characterization to date.
Some of the limitations of the above-mentioned studies have been overcome in the present study by (1) performing real-time frequency mapping that allowed us to use an intracardiac catheter to locate the highest DF site in each patient simultaneously with catheters at other locations with lower frequencies, (2) recording the surface ECG at multiple locations on the body surface that helped the detection of the high-frequency components that were dominant at only a small number of surface electrodes, (3) infusion of adenosine to transiently increase AF frequency and accentuate DF gradients14 while at the same time slow atrioventricular conduction, which allowed us to obtain spectra free of ventricular components.
BSPM and Mechanisms of Maintenance of AF
The observations of spectral power dispersion shown in Figure 7 are consistent with experimental DF data on fibrillation and fibrillatory conduction in isolated sheep heart preparations: in wedge preparations of ventricular walls, Zaitsev et al14 showed that the spatial variability in DF values during fibrillation increases in proportion to the value of the maximal DF. In isolated RA preparation, Berenfeld et al25 demonstrated that when the atria are paced at increasing rates, there exists a critical rate above which fibrillatory conduction emerges the moment at which the normally uniform DF response breaks down into multiple, spatially distributed DF domains whose frequency is lower than the pacing frequency. Also importantly, in whole isolated sheep experiments of AF, the LA was found to have not only higher DFs than the RA but also the largest DF domain areas,15 suggesting that atrial sources for the highest DF could be sufficiently large to be detected on the body surface. Thus, as evidenced by the cumulative data in Figure 7, during AF in humans the DF distribution on the BSPM replicates the epicardial distribution of DFs and can identify small areas containing the high-frequency sources that result in fibrillatory conduction to the reminder of the atria.
Study Limitations
Real-time intracardiac frequency mapping was performed sequentially and before the adenosine infusion, which did not allow a direct comparison of CARTO DF maps and body surface DF maps because we could not rule out temporal alteration in the AF characteristics. However, overall distributions of DFs calculated from 15 simultaneous endocardial EGMs (ie, location of the highest DF site) were comparable and showed highly significant correlation.
Most patients enrolled in our study (8 out of 14) had up to 3 previous ablation procedures (Table in the online-only Data Supplement). Therefore, the heterogeneously modified substrate in the atria of our patients did not allow us to compare our results to other studies in the literature regarding the presence of DF gradients in paroxysmal and persistent AF, or in the outcome of their respective ablation procedure.
Conclusion and Clinical Implications
Global atrial noninvasive frequency analysis is feasible in AF patients and may allow the identification of high-frequency sources before the arrival at the electrophysiology laboratory for ablation. This mapping procedure may help in patient selection because patients without interchamber DF gradient have lower ablation success rates. In addition, a priori knowledge of the chamber responsible for the maintenance of the arrhythmia in those patients presenting a DF gradient may help in planning and performing the ablation procedure, decreasing the time required for the search and elimination of the highest DF site.
Supplementary Material
CLINICAL PERSPECTIVE.
Atrial fibrillation (AF) is the most common sustained cardiac arrhythmia presenting a significant increase in the risk of stroke and death. Despite its high prevalence, pharmacological treatment of AF is still challenging and an ablative approach is frequently needed. However, the best atrial ablation strategy is still to be determined. Quite often high-frequency sources can be found in human atria during AF that are responsible for the maintenance of the arrhythmia. Elimination of these AF sources has been proven as an effective therapy for restoring the normal electric activity in the atria in some patients. Nevertheless, there is a lack of noninvasive techniques for detecting these high-frequency sources before the ablation, which precludes the selection of patients that will benefit from this ablation strategy. We investigated whether these high-frequency sources can be found on the surface of the torso by analyzing body surface potential mapping recordings. In 14 uncategorized patients with history of AF, 67-lead body surface recordings were coregistered with endocardial electrograms from both atria, including the highest dominant frequency (DF) site. Body surface DF maps showed same spectral components as found invasively and highest DFs found on distinct areas of the torso showed a good correspondence with DFs found in each atrium, thus allowing the identification of the atrium with the highest frequency. Therefore, DF gradients can be detected in patients with AF using body surface recordings, enabling a noninvasive personalized diagnosis with possibly improved treatment.
Acknowledgments
Sources of Funding
Supported in part by the Spanish Society of Cardiology (Becas Investigación Clínica 2009); the Spanish Ministry of Education and Science under TEC2009-13939; the Universitat Politècnica de València through its research initiative program; the Generalitat Valenciana Grants (AP-145/10, PROMETEO/2010/093 and BEST/2011); the Ministerio de Economia y Competitividad, Red RECAVA; the Centro Nacional de Investigaciones Cardiovasculares (proyecto CNIC-13); the Coulter Foundation from the Biomedical Engineering Department (University of Michigan); the Gelman Award from the Cardiovascular Division (University of Michigan); the National Heart, Lung, and Blood Institute grants (P01-HL039707 and P01-HL087226), and the Leducq Foundation.
Dr Atienza served on the advisory board of Medtronic and has received research funding from St. Jude Medical Spain. Dr Jalife is a consultant for Topera, Inc., and for Rhythm Solutions, Inc. He is a coinvestigator in a research grant from Gilead, Inc. Dr Berenfeld is a cofounder and chief scientist of Rhythm Solutions, Inc.
Footnotes
The online-only Data Supplement is available at http://circep.ahajournals.org/lookup/suppl/doi:10.1161/CIRCEP.112.000167/-/DC1.
Disclosures
None of the companies disclosed financed the research described in this article. The other authors have no conflicts to report.
References
- 1.Haïssaguerre M, Jaïs P, Shah DC, Takahashi A, Hocini M, Quiniou G, Garrigue S, Le Mouroux A, Le Métayer P, Clémenty J. Spontaneous initiation of atrial fibrillation by ectopic beats originating in the pulmonary veins. N Engl J Med. 1998;339:659–666. doi: 10.1056/NEJM199809033391003. [DOI] [PubMed] [Google Scholar]
- 2.Narayan SM, Krummen DE, Rappel WJ. Clinical mapping approach to diagnose electrical rotors and focal impulse sources for human atrial fibrillation. J Cardiovasc Electrophysiol. 2012;23:447–454. doi: 10.1111/j.1540-8167.2012.02332.x. [DOI] [PMC free article] [PubMed] [Google Scholar]
- 3.Atienza F, Almendral J, Jalife J, Zlochiver S, Ploutz-Snyder R, Torrecilla EG, Arenal A, Kalifa J, Fernández-Avilés F, Berenfeld O. Real-time dominant frequency mapping and ablation of dominant frequency sites in atrial fibrillation with left-to-right frequency gradients predicts long-term maintenance of sinus rhythm. Heart Rhythm. 2009;6:33–40. doi: 10.1016/j.hrthm.2008.10.024. [DOI] [PMC free article] [PubMed] [Google Scholar]
- 4.Hsu LF, Jaïs P, Keane D, Wharton JM, Deisenhofer I, Hocini M, Shah DC, Sanders P, Scavée C, Weerasooriya R, Clémenty J, Haïssaguerre M. Atrial fibrillation originating from persistent left superior vena cava. Circulation. 2004;109:828–832. doi: 10.1161/01.CIR.0000116753.56467.BC. [DOI] [PubMed] [Google Scholar]
- 5.Di Biase L, Burkhardt JD, Mohanty P, Sanchez J, Mohanty S, Horton R, Gallinghouse GJ, Bailey SM, Zagrodzky JD, Santangeli P, Hao S, Hongo R, Beheiry S, Themistoclakis S, Bonso A, Rossillo A, Corrado A, Raviele A, Al-Ahmad A, Wang P, Cummings JE, Schweikert RA, Pelargonio G, Dello Russo A, Casella M, Santarelli P, Lewis WR, Natale A. Left atrial appendage: an underrecognized trigger site of atrial fibrillation. Circulation. 2010;122:109–118. doi: 10.1161/CIRCULATIONAHA.109.928903. [DOI] [PubMed] [Google Scholar]
- 6.Hocini M, Nault I, Wright M, Veenhuyzen G, Narayan SM, Jaïs P, Lim KT, Knecht S, Matsuo S, Forclaz A, Miyazaki S, Jadidi A, O’Neill MD, Sacher F, Clémenty J, Haïssaguerre M. Disparate evolution of right and left atrial rate during ablation of long-lasting persistent atrial fibrillation. J Am Coll Cardiol. 2010;55:1007–1016. doi: 10.1016/j.jacc.2009.09.060. [DOI] [PMC free article] [PubMed] [Google Scholar]
- 7.Lazar S, Dixit S, Marchlinski FE, Callans DJ, Gerstenfeld EP. Presence of left-to-right atrial frequency gradient in paroxysmal but not persistent atrial fibrillation in humans. Circulation. 2004;110:3181–3186. doi: 10.1161/01.CIR.0000147279.91094.5E. [DOI] [PubMed] [Google Scholar]
- 8.Sanders P, Berenfeld O, Hocini M, Jaïs P, Vaidyanathan R, Hsu LF, Garrigue S, Takahashi Y, Rotter M, Sacher F, Scavée C, Ploutz-Snyder R, Jalife J, Haïssaguerre M. Spectral analysis identifies sites of high-frequency activity maintaining atrial fibrillation in humans. Circulation. 2005;112:789–797. doi: 10.1161/CIRCULATIONAHA.104.517011. [DOI] [PubMed] [Google Scholar]
- 9.Guillem MS, Climent AM, Castells F, Husser D, Millet J, Arya A, Piorkowski C, Bollmann A. Noninvasive mapping of human atrial fibrillation. J Cardiovasc Electrophysiol. 2009;20:507–513. doi: 10.1111/j.1540-8167.2008.01356.x. [DOI] [PubMed] [Google Scholar]
- 10.Atienza F, Almendral J, Moreno J, Vaidyanathan R, Talkachou A, Kalifa J, Arenal A, Villacastín JP, Torrecilla EG, Sánchez A, Ploutz-Snyder R, Jalife J, Berenfeld O. Activation of inward rectifier potassium channels accelerates atrial fibrillation in humans: evidence for a reentrant mechanism. Circulation. 2006;114:2434–2442. doi: 10.1161/CIRCULATIONAHA.106.633735. [DOI] [PubMed] [Google Scholar]
- 11.Castells F, Mora C, Rieta JJ, Moratal-Pérez D, Millet J. Estimation of atrial fibrillatory wave from single-lead atrial fibrillation electrocardiograms using principal component analysis concepts. Med Biol Eng Comput. 2005;43:557–560. doi: 10.1007/BF02351028. [DOI] [PubMed] [Google Scholar]
- 12.Botteron GW, Smith JM. Quantitative assessment of the spatial organization of atrial fibrillation in the intact human heart. Circulation. 1996;93:513–518. doi: 10.1161/01.cir.93.3.513. [DOI] [PubMed] [Google Scholar]
- 13.Mansour M, Mandapati R, Berenfeld O, Chen J, Samie FH, Jalife J. Left-to-right gradient of atrial frequencies during acute atrial fibrillation in the isolated sheep heart. Circulation. 2001;103:2631–2636. doi: 10.1161/01.cir.103.21.2631. [DOI] [PubMed] [Google Scholar]
- 14.Zaitsev AV, Berenfeld O, Mironov SF, Jalife J, Pertsov AM. Distribution of excitation frequencies on the epicardial and endocardial surfaces of fibrillating ventricular wall of the sheep heart. Circ Res. 2000;86:408–417. doi: 10.1161/01.res.86.4.408. [DOI] [PubMed] [Google Scholar]
- 15.Berenfeld O, Mandapati R, Dixit S, Skanes AC, Chen J, Mansour M, Jalife J. Spatially distributed dominant excitation frequencies reveal hidden organization in atrial fibrillation in the Langendorff-perfused sheep heart. J Cardiovasc Electrophysiol. 2000;11:869–879. doi: 10.1111/j.1540-8167.2000.tb00066.x. [DOI] [PubMed] [Google Scholar]
- 16.Schuessler RB, Grayson TM, Bromberg BI, Cox JL, Boineau JP. Cholinergically mediated tachyarrhythmias induced by a single extrastimulus in the isolated canine right atrium. Circ Res. 1992;71:1254–1267. doi: 10.1161/01.res.71.5.1254. [DOI] [PubMed] [Google Scholar]
- 17.Roithinger FX, SippensGroenewegen A, Karch MR, Steiner PR, Ellis WS, Lesh MD. Organized activation during atrial fibrillation in man: endocardial and electrocardiographic manifestations. J Cardiovasc Electrophysiol. 1998;9:451–461. doi: 10.1111/j.1540-8167.1998.tb01836.x. [DOI] [PubMed] [Google Scholar]
- 18.Bollmann A, Kanuru NK, McTeague KK, Walter PF, DeLurgio DB, Langberg JJ. Frequency analysis of human atrial fibrillation using the surface electrocardiogram and its response to ibutilide. Am J Cardiol. 1998;81:1439–1445. doi: 10.1016/s0002-9149(98)00210-0. [DOI] [PubMed] [Google Scholar]
- 19.Bollmann A, Sonne K, Esperer HD, Toepffer I, Langberg JJ, Klein HU. Non-invasive assessment of fibrillatory activity in patients with paroxysmal and persistent atrial fibrillation using the Holter ECG. Cardiovasc Res. 1999;44:60–66. doi: 10.1016/s0008-6363(99)00156-x. [DOI] [PubMed] [Google Scholar]
- 20.Bollmann A, Husser D, Steinert R, Stridh M, Soernmo L, Olsson SB, Polywka D, Molling J, Geller C, Klein HU. Echocardiographic and electrocardiographic predictors for atrial fibrillation recurrence following cardioversion. J Cardiovasc Electrophysiol. 2003;14(10 suppl):S162–S165. doi: 10.1046/j.1540.8167.90306.x. [DOI] [PubMed] [Google Scholar]
- 21.Lemola K, Ting M, Gupta P, Anker JN, Chugh A, Good E, Reich S, Tschopp D, Igic P, Elmouchi D, Jongnarangsin K, Bogun F, Pelosi F, Jr, Morady F, Oral H. Effects of two different catheter ablation techniques on spectral characteristics of atrial fibrillation. J Am Coll Cardiol. 2006;48:340–348. doi: 10.1016/j.jacc.2006.04.053. [DOI] [PubMed] [Google Scholar]
- 22.Dibs SR, Ng J, Arora R, Passman RS, Kadish AH, Goldberger JJ. Spatiotemporal characterization of atrial activation in persistent human atrial fibrillation: multisite electrogram analysis and surface electrocardiographic correlations-a pilot study. Heart Rhythm. 2008;5:686–693. doi: 10.1016/j.hrthm.2008.01.027. [DOI] [PubMed] [Google Scholar]
- 23.Petrutiu S, Sahakian AV, Fisher W, Swiryn S. Manifestation of left atrial events and interatrial frequency gradients in the surface electrocardiogram during atrial fibrillation: contributions from posterior leads. J Cardiovasc Electrophysiol. 2009;20:1231–1236. doi: 10.1111/j.1540-8167.2009.01523.x. [DOI] [PubMed] [Google Scholar]
- 24.Cuculich PS, Wang Y, Lindsay BD, Faddis MN, Schuessler RB, Damiano RJ, Jr, Li L, Rudy Y. Noninvasive characterization of epicardial activation in humans with diverse atrial fibrillation patterns. Circulation. 2010;122:1364–1372. doi: 10.1161/CIRCULATIONAHA.110.945709. [DOI] [PMC free article] [PubMed] [Google Scholar]
- 25.Berenfeld O, Zaitsev AV, Mironov SF, Pertsov AM, Jalife J. Frequency-dependent breakdown of wave propagation into fibrillatory conduction across the pectinate muscle network in the isolated sheep right atrium. Circ Res. 2002;90:1173–1180. doi: 10.1161/01.res.0000022854.95998.5c. [DOI] [PubMed] [Google Scholar]
Associated Data
This section collects any data citations, data availability statements, or supplementary materials included in this article.


