

Abstract
Low serum 25-hydroxyvitamin D [25(OH)D] is common in healthy children particularly in blacks. However, serum 25(OH)D concentrations for optimal bone turnover in children is unknown and few data exist that describe effects of increasing serum 25(OH)D on bone turnover markers during puberty. The purpose of this study was to determine the relationships between serum 25(OH)D and changes in serum 25(OH)D and bone turnover in white and black pubertal adolescents. Bone turnover markers were measured in 318 healthy boys and girls from Georgia (34°N) and Indiana (40°N) who participated in a study of oral vitamin D3 supplementation (0 to 4000 IU/d). Serum 25(OH)D, osteocalcin, bone alkaline phosphatase, and urine N-telopeptide cross-links were measured at baseline and 12 weeks. Relationships among baseline 25(OH)D and bone biomarkers, and between changes over 12 weeks were determined and tested for effects of race, sex, latitude, and baseline 25(OH)D. Median 25(OH)D was 27.6 ng/mL (n=318, range 10.1–46.0 ng/mL) at baseline and 34.5 ng/mL (n=302, range 9.7–95.1 ng/mL) at 12 weeks. Neither baseline nor change in 25(OH)D over 12 weeks were associated with bone turnover. The lack of association was not affected by race, sex, latitude, or baseline serum 25(OH)D. Serum 25(OH)D in the range of 10-46 ng/mL appears to be sufficient for normal bone turnover in healthy black and white pubertal adolescents.
Keywords: bone turnover, adolescence, vitamin D, race, 25-hydroxyvitamin D
1. Introduction
A high prevalence of low serum 25-hydroxyvitamin D [25(OH)D] has been reported in healthy children and adolescents [1-4], which has driven the concept that it is important to improve vitamin D status in this population. But, there are few data to support a level of serum 25(OH)D for optimal bone turnover in children above that which is necessary to prevent rickets (> 10 ng/mL). Further, American black children compared with white children have lower serum 25(OH)D [1-3], but generally higher bone mass and strength [5-7], indicating that optimal vitamin D status in blacks, at least for bone health outcomes, may be different from that for whites.
In the absence of functional outcomes such as bone mineral density and fracture, which require large sample sizes and relatively long study durations, biochemical markers of bone formation and bone resorption are potentially useful to gauge the influence of vitamin D supplementation on bone. During puberty, serum concentrations of bone turnover markers are high compared with adult values [8]. Cross-sectional data linking serum 25(OH)D and bone turnover markers in children and adolescents are conflicting. A study in adolescent Chinese girls [9] reported a negative association between serum 25(OH)D and markers of both bone formation and resorption, whereas, two studies in European children across pubertal stages [8, 10] reported lack of associations between serum 25(OH)D and markers of bone formation and resorption. Though few prospective data exist that describe the effects of increasing serum 25(OH)D on bone turnover markers during puberty in healthy children, several studies [11-13] have shown that vitamin D supplementation in children increases serum 25(OH)D, but has little influence on bone turnover markers. These studies, however, used relatively low doses of vitamin D supplementation (200 – 600 IU/d) with result that the magnitude of change in serum 25(OH)D may not have been great enough to elicit measurable changes in bone turnover. In addition, data are lacking comparing bone turnover markers in whites and blacks following vitamin D3 supplementation.
This study aimed to determine the baseline relationships between serum 25(OH)D and bone turnover markers in American black and white children who participated in a 12-week vitamin D study, using doses up to 4000 IU/day. Further, the study aimed to determine the effect of change in serum 25(OH)D over 12 weeks on corresponding change in bone turnover.
2. Participants and Methods
Healthy children in sexual maturation stages 2 or 3 as described by Tanner[14] were recruited from the community by advertisement to participate in a 12-week randomized, placebo-controlled trial of vitamin D3 supplementation, stratified for race (black and white), sex, and geographical location [U.S. states of Indiana (“northern site,” 40°N) and Georgia (“southern site,” 34°N)]. Sexual maturation stage [14] was determined by self-staging (breast stage for girls and genital stage for boys) with the assistance of a parent. Three-hundred twenty-three pubertal boys (ages 8 to 13 years) and girls (ages 9 to 12 years) enrolled in the parent study (83 black girls [43 northern and 40 southern], 82 black boys [42 northern and 40 southern], 78 white girls [38 northern and 40 southern], 80 white boys [40 northern and 40 southern]). All participants were enrolled during winter (October to January) to recruit children whose serum 25D had reached the seasonal nadir. In the parent study, participants were randomized to receive 0, 400, 1000, 2000, or 4000 IU/d of oral vitamin D3 supplements (Douglas Laboratories, Pittsburgh, PA). Vitamin D3 supplement doses were confirmed by an independent lab (Covance, Inc.). Compliance with supplementation was assessed by pill count. The study protocol was approved by the Institutional Review Boards of the University of Georgia, Purdue University, and Indiana University School of Medicine. All participants and parents/guardians provided informed assent and consent, respectively.
2.1 Serum and Urine Biochemistries
Fasting serum and urine samples were collected at baseline and 12 weeks and stored at -80°C until analysis. Each analyte was measured at a single laboratory for all participants and blocked such that baseline and 12-week samples for each participant were measured at the same time. Serum 25(OH)D (ng/mL) was measured by RIA (Diasorin, Stillwater, USA) in a DEQAS participant laboratory (CV 5.5 %). Bone turnover markers were measured by ELISA: Serum osteocalcin (OC, ng/mL) and bone alkaline phosphatase (BAP, U/L) (MicroVue™, Quidel Corporation, San Diego, CA; CV 8.0 % and 4.1 %, respectively), and urine N-telopeptide cross-links (Ntx, nM bone collagen equivalents; Osteomark®, Wampole Laboratories, Princeton, NJ, CV 4.6 %). Urine creatinine (mM) was measured by colorimetric assay using a COBAS MIRA clinical analyzer (Roche Diagnostic, Indianapolis, IN). Urine Ntx was corrected for urine creatinine and values reported are in nM bone collagen equivalents/mM creatinine.
2.2 Statistical Analyses
Statistical Analysis Software (SAS 9.2, Cary, NC) was used for statistical analyses. Seven outliers for urine Ntx (all > 4 SD above the mean) were excluded from the analyses. Transformed values for bone turnover markers were used in the statistical analyses to satisfy the assumption of normally distributed errors: square-root BAP, natural log OC, natural log Ntx. For change from baseline to 12 weeks, a natural log transformation for OC was used and the other variables remained in original units. Independent samples t-tests were used to determine race differences in baseline variables. Because the aim of the analysis was to determine the relationship between serum 25(OH)D and bone turnover the effect of dose of vitamin D supplement on serum 25(OH)D was not examined. Simple regression was used to determine relationships among baseline values for serum 25(OH)D, BAP, OC, and urine Ntx. Then, to determine if change in 25(OH)D over 12 weeks impacted bone turnover, simple regressions were performed among change in 25(OH)D and change in BAP, OC, and Ntx. Regressions were also performed by month of enrollment to investigate any intra-seasonal variation in the relationships among variables. Multivariate regression was used to determine if the relationships among variables were affected by adjusting for sexual maturation stage, race, sex, latitude, and baseline serum 25(OH)D. The effect of race on the relationship between 25(OH)D and bone turnover was also investigated by repeating the simple regressions in whites and blacks separately. The Bonferroni method was used to adjust the overall significance level of α = 0.05 for multiple tests, which gave an adjusted significance level of α = 0.002.
3. Results
3.1 Relationships among Baseline Variables
Baseline demographic and biochemical variables are presented for 318 participants in Table 1. Five participants were excluded due to lack of baseline biochemical data. Median serum 25(OH)D was 27.6 ng/mL at baseline (Figure 1A, Table 1). There were 47 participants (14.7 %) with 25(OH)D in the insufficiency range (< 20 ng/mL) and no participants in the deficiency range (< 10 ng/mL). Blacks had lower 25(OH)D (p < 0.0001) and higher OC (p < 0.0001) than whites. Baseline serum 25(OH)D was not associated with baseline serum BAP or urine Ntx, and there was a modest negative association with serum OC (R2 = 0.05, p < 0.0001), which was no longer statistically significant after adjusting for race or multivariate adjustment for sexual maturation, race, sex, and latitude (Table 2A). The analysis of blacks and whites separately yielded similar results (Figures 2A-C). Relationships among baseline variables were not affected by month of enrollment (data not shown).
Table 1. Participant Demographics and Baseline and 12-week Biochemistries a.
| All Participants | White | Black | p-value | |
|---|---|---|---|---|
| Demographics | ||||
| n | 318 | 156 | 162 | |
| Latitude (North/South) | 158/160 | 76/80 | 82/80 | |
| Sex (Girls/Boys) | 157/161 | 77/79 | 80/82 | |
| Sexual Maturation stage (2/3)b | 207/111 | 107/49 | 100/62 | |
| Age (yr) | 11.4 ± 0.1 | 11.6 ± 0.1 | 11.2 ± 0.1 | 0.004 |
| 11.3 (8.9 - 14.0) | 11.7 (9.1 - 14.0) | 11.1 (8.9 - 14.0) | ||
| Biochemistries | ||||
| Baseline | ||||
| Serum 25OHD (ng/ml) | 28.0 ± 0.4 | 32.0 ± 1.3 | 24.1 ± 0.5 | <0.0001 |
| (n = 318) | 27.6 (10.2 - 46.0) | 31.9 (17.9 - 46.0) | 24.5 (10.2 - 42.5) | |
| Serum BAP (U/L) | 214.3 ± 4.5 | 206.3 ± 6.3 | 222.5 ± 6.3 | 0.07 |
| (n = 303) | 202.8 (12.8 - 490.0) | 188.0 (14.5 - 490.0) | 212.8 (12.8 - 434.3) | |
| Serum OC (ng/ml) | 33.3 ± 0.7 | 29.7 ± 0.6 | 37.0 ± 1.1 | <0.0001 |
| (n = 303) | 31.3 (9.2 - 98.1) | 28.6 (14.9 - 60.8) | 35.2 (9.2 - 98.1) | |
| Urine Ntx (nM BCE/mM Creat) | 544.7 ± 12.0 | 577.9 ± 17.2 | 511.3 ± 16.3 | 0.004 |
| (n = 299) | 512.1 (139.5 - 1219.2) | 542.8 (187.7 - 1219.2) | 483.0 (139.5 - 1177.1) | |
| 12-week | ||||
| Serum 25OHD (ng/ml) | 38.2 ± 0.9 | 42.5 ± 1.3 | 33.5 ± 1.3 | <0.0001 |
| (n = 302) | 34.5 (9.7 - 95.1) | 37.6 (12.7 - 95.1) | 30.7 (9.7 - 92.4) | |
| Serum BAP (U/L) | 231.5 ± 4.9 | 236.3 ± 7.4 | 226.5 ± 6.5 | 0.38 |
| (n = 302) | 214.7 (63.3 - 597.0) | 219.7 (88.1 - 597.0) | 212.5 (63.3 - 448.2) | |
| Serum OC (ng/ml) | 34.9 ± 0.7 | 31.7 ± 0.7 | 38.4 ± 1.3 | <0.0001 |
| (n = 302) | 32.6 (13.1 - 104.6) | 30.9 (13.1 - 62.5) | 35.8 (15.4 - 104.6) | |
| Urine Ntx (nM BCE/mM Creat) | 565.6 ± 13.3 | 608.0 ± 18.3 | 521.1 ± 18.7 | 0.0002 |
| (n = 301) | 530.1 (99.4 - 1562.4) | 557.4 (99.4 - 1562.4) | 489.2 (114.9 - 1542.6) | |
Values are presented as mean ± SE and median (min-max); t-tests for bone turnover markers were performed using transformed variables: square-root BAP, log OC, log Ntx. Original units are presented in the table. P-values in bold are statistically significant.
12 girls reached menarche during the study.
Figure 1. Distribution of serum 25OHD (A) at baseline, (B) 12 weeks, and (C) as change (Δ) from baseline to 12 weeks.
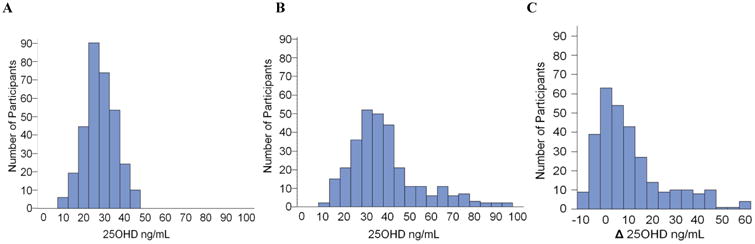
Table 2. Serum 25OHD and Bone Turnover Markers - Baseline and Change Relationshipsa.
| A. | B. | ||||
|---|---|---|---|---|---|
| BASELINE | CHANGE OVER 12 WEEKS | ||||
|
|
|
||||
| Simple Regression | Simple Regression | ||||
| R-squared | p-value | R-squared | p-value | ||
| Sqrt (Serum BAP) | 0.01 | 0.1 | ΔSerum BAP | 0.001 | 0.56 |
| log (Serum OC) | 0.05 | 0.0001 | Δlog Serum OC | 0.001 | 0.71 |
| log (Urine Ntx) | 0.0003 | 0.48 | ΔUrine Ntx | 0.01 | 0.15 |
| Race Adjusted | R-squared | p-value | Race Adjusted | R-squared | p-value |
| Sqrt (Serum BAP) | 0.002 | 0.43 | ΔSerum BAP | 0.001 | 0.64 |
| log (Serum OC) | 0.01 | 0.11 | Δlog Serum OC | 0.001 | 0.67 |
| log (Urine Ntx) | 0.02 | 0.02 | ΔUrine Ntx | 0.01 | 0.16 |
| Multivariate Adjustedb | Multivariate Adjustedc | ||||
| R-squared | p-value | R-squared | p-value | ||
| Sqrt (Serum BAP) | 0.001 | 0.65 | ΔSerum BAP | 0.002 | 0.45 |
| log (Serum OC) | 0.01 | 0.09 | Δlog Serum OC | 0.001 | 0.65 |
| log (Urine Ntx) | 0.01 | 0.08 | ΔUrine Ntx | 0.004 | 0.26 |
p-values in bold are statistically significant. Δ = change from baseline to 12 weeks;
adjusted for sexual maturation stage, race, sex, and latitude;
adjusted for sexual maturation stage, race, sex, latitude, baseline 25OHD.
Figure 2.
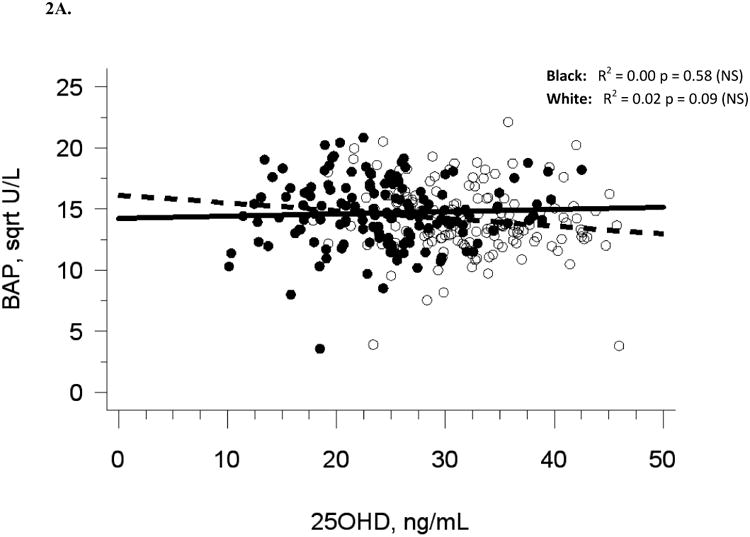
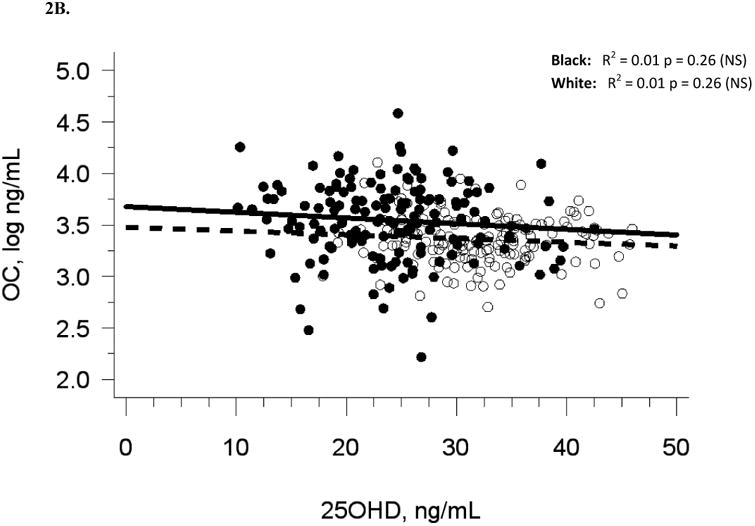
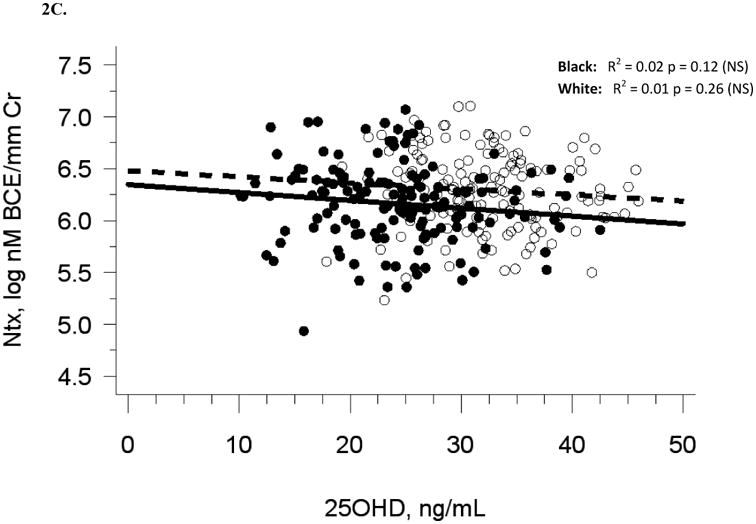
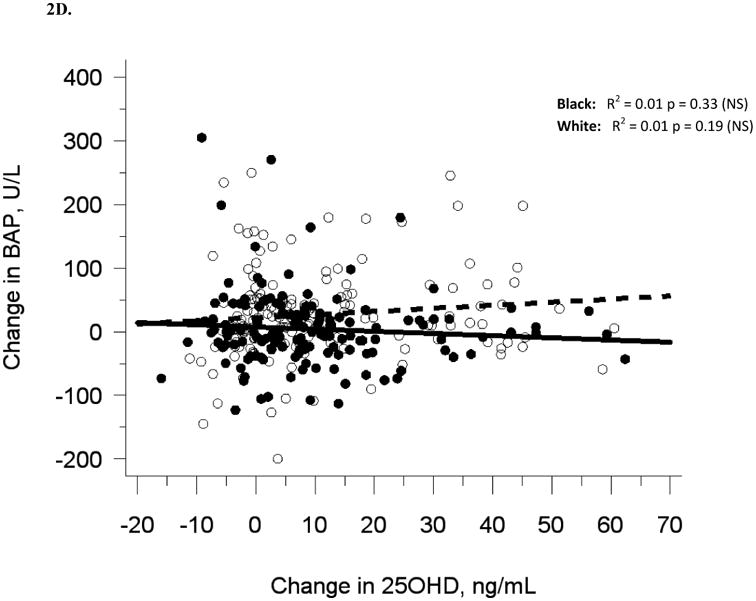
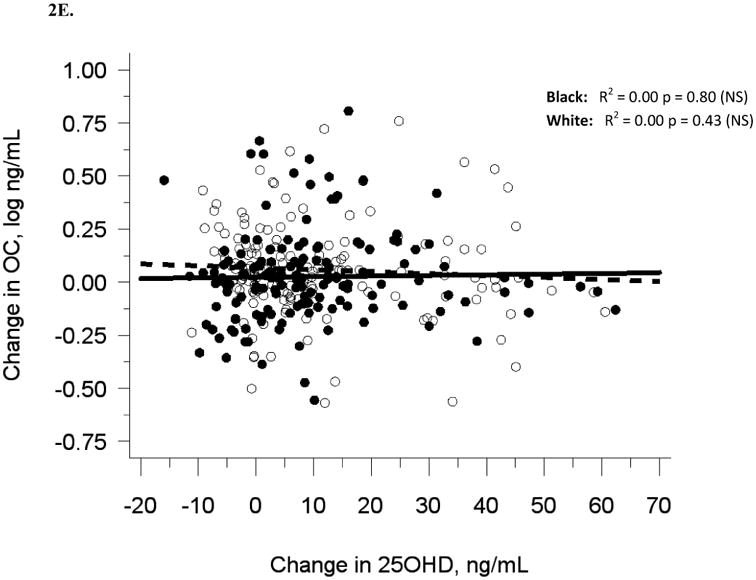
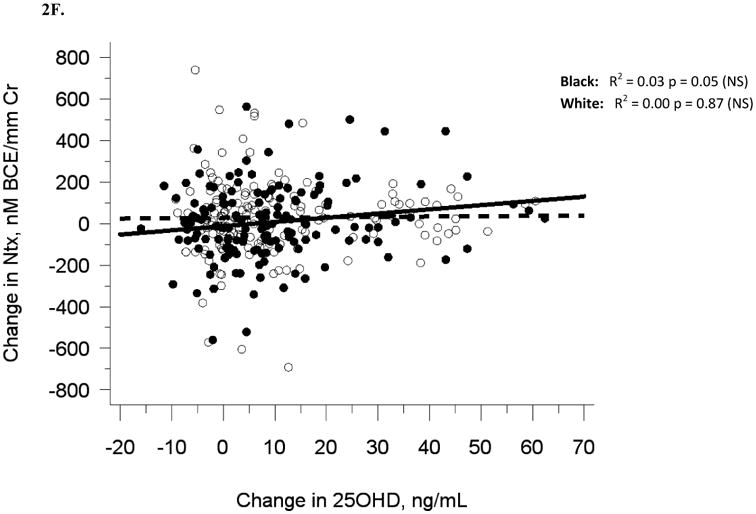
The relationship between serum 25OHD and (A) serum BAP at baseline, (B) serum OC at baseline, and (C) urine NTX at baseline, and the relationship between change in serum 25OHD after 12 weeks of vitamin D supplementation versus (D) change in serum BAP, (E) change in serum OC, and (F) change in urine NTX. Blacks are represented by filled circles and solid lines and white are represented by open circles and dashed lines.
3.2 Relationships among 12-week Change
Data from 302 participants who completed the 12-week study are included in the prospective analysis. The range of vitamin D3 doses from 0 to 4000 units shifted median serum 25(OH)D at 12 weeks to 34.5 ng/mL (range 9.7 to 95.1 ng/mL; Figure 1B, Table 1) and produced changes in serum 25(OH)D ranging from -5.9 to +62.4 ng/mL at 12 weeks (Figure 1C). There were 26 (9%) participants at 12 weeks in the vitamin D insufficiency range (< 20 ng/mL) and 1 (<1%) in the vitamin D deficiency range (< 10 ng/mL). Mean change in serum 25(OH)D was higher with each increasing level of vitamin D3 dosage: (-3.5, +1.8, +7.6, +14.1, +31.2 ng/mL for 0, 400, 1000, 2000, 4000 IU/d, respectively, p < 0.002 for all doses).
Similar to baseline results, 12-week serum 25(OH)D was not related to 12-week bone turnover markers (data not shown). Change in serum 25(OH)D was not correlated with change in serum BAP (R2 = 0.001, p = 0.56), serum OC (R2 = 0, p = 0.71), or urine Ntx (R2 = 0.01, p = 0.15; Table 2B, Figures 2D-F).
Adjustment for race alone, or multivariate adjustment for sexual maturation, race, sex, latitude, and baseline serum 25(OH)D did not affect the lack of association between change in serum 25(OH)D and change in bone turnover markers, nor did analyses of blacks and whites separately (Figures 2D-F). Relationships among change variables were not affected by month of enrollment nor level of vitamin D3 dose (data not shown).
4. Discussion
This study did not show a positive relationship between serum 25(OH)D levels and biochemical markers of bone turnover in healthy pubertal adolescents either at baseline or with change over 12 weeks. The lack of a relationship was present in both white and black children despite the fact that black adolescents had lower serum 25(OH)D and higher bone turnover than whites. These findings corroborate the results of previous cross-sectional studies [8, 10] and intervention studies in adolescents using lower doses of oral vitamin D [11-13, 15] which found no relationship between serum 25(OH)D and bone turnover. Our study extends these reports by using a larger sample of healthy boys and girls, and showing that perturbing baseline serum 25(OH)D through a wide range from zero to 60 ng/ml using daily oral vitamin D3 supplementation did not change bone turnover.
The lack of relationship between serum 25(OH)D and bone turnover, and additionally the lack of relationship between change in serum 25(OH)D and change in bone turnover following 12 weeks of vitamin D supplementation indicates that at baseline these adolescents were within the range of serum 25(OH)D required for healthy bone turnover. This contrasts with findings in classically defined vitamin D deficiency (serum 25(OH)D < 10 ng/mL) that produces rickets with increased bone turnover, and which responds to vitamin D treatment with a reduction in bone turnover [16]. In a study of Chinese girls [9] where a third of the participants had serum 25(OH)D in the deficient range, girls categorized as vitamin D deficient (< 10 ng/mL) had higher BAP than those categorized as insufficient (<20 ng/mL and > 10 ng/mL) or sufficient (>20 ng/mL), but there were no differences between those categorized as insufficient and sufficient. In the present study, median serum 25(OH)D was 27.6 ng/mL, which is well above the deficiency level of 10 ng/mL, but also above the insufficiency level of 20 ng/mL defined by the Institute of Medicine [17]. None of the participants in this study had a baseline serum 25(OH)D level defined as deficient. Therefore, a limitation of the present study is that it cannot exclude either an association between serum 25(OH)D and bone turnover or an effect of improving serum 25(OH)D through vitamin D supplementation on bone turnover in children with deficient baseline serum 25(OH)D.
Race did not affect the results of this study, despite the finding that blacks had lower serum 25(OH)D and higher OC compared with whites. Neither adjusting for race in the multivariate analyses nor repeating the analyses in whites and blacks separately revealed that the lack of relationship between serum 25(OH)D and bone turnover might be race-dependent.
There were several strengths of this study including the relatively large sample of black and white boys and girls from northern and southern U.S. latitudes where each race and sex from both latitudes were equally represented. The participants in this study were studied over winter months to limit confounding by seasonal sun exposure causing dermal vitamin D production, and to ensure that vitamin D supplements would have the greatest effect on low serum 25(OH)D. In addition, separate analyses by month of enrollment did not suggest any seasonal effect on the relationship between serum 25(OH)D and bone turnover markers in this study. The study occurred over 12 weeks, which is sufficient time to observe effects of vitamin D on bone turnover [18]. Bone turnover in this study was measured by three biochemical markers of bone turnover, which we have shown to be reliable markers of bone turnover measured by skeletal calcium retention during calcium balance studies in adolescents [19]. The large range of vitamin D doses in this study, extending up to the Tolerable Upper Intake Level [17] of 4000 IU/d, produced a wide range of change in serum 25(OH)D over the 12-week study, which allowed us to investigate the relationship between change in 25(OH)D and change in bone turnover. Our study sample represents a relatively narrow range of sexual maturity, minimizing confounding from sexual maturation, but does limit the results from being generalized to all of childhood. Furthermore, analysis of the data using sexual maturation stage as a covariate did not affect the results. However, self-staging of sexual maturation and as use of sexual maturation stage as only a screening measure are limitations of the study.
Our sample size was similar to that in the aforementioned Chinese girls study [9] including vitamin D deficient girls, which showed a relationship between serum 25(OH)D status and bone turnover. Therefore, we were likely adequately powered to detect a relationship. In addition, the weakness (R2 ranging from 0.00 to 0.03) of the non-significant relationships between serum 25(OH)D and bone turnover markers indicates that even if our sample size were larger to produce significant results, these relationships would be of little clinical relevance.
5. Conclusions
The results of this study indicate that serum 25(OH)D ranging from 10 to 46 ng/mL during winter appears to be sufficient in healthy black and white adolescents for bone turnover, and increasing serum 25(OH)D does not affect bone turnover in these children. Our results suggest that there is no apparent benefit of increasing serum 25(OH)D for bone turnover in children when a winter baseline serum 25(OH)D is above the deficiency level of 10 ng/mL.
Highlights (3-5 bullet points, max 20 words per point).
In healthy black and white pubertal children, bone turnover markers are not associated with serum 25(OH)D;
-
increasing serum 25(OH)D does not affect bone turnover markers;
and serum 25(OH)D ranging from 10-46 ng/mL is sufficient for normal bone turnover
Acknowledgments
These data were presented in part at the American Society for Bone and Mineral Research Annual Meeting in San Diego, CA, September 19, 2011. This study is registered at ClinicalTrials.gov (NCT ID: NCT00931580).
Funding: NIH grants HD057126 and RR025761
Footnotes
Publisher's Disclaimer: This is a PDF file of an unedited manuscript that has been accepted for publication. As a service to our customers we are providing this early version of the manuscript. The manuscript will undergo copyediting, typesetting, and review of the resulting proof before it is published in its final citable form. Please note that during the production process errors may be discovered which could affect the content, and all legal disclaimers that apply to the journal pertain.
References
- 1.Gordon CM, DePeter KC, Feldman HA, Grace E, Emans SJ. Prevalence of vitamin D deficiency among healthy adolescents. Arch Pediatr Adolesc Med. 2004;158:531–7. doi: 10.1001/archpedi.158.6.531. [DOI] [PubMed] [Google Scholar]
- 2.Absoud M, Cummins C, Lim MJ, Wassmer E, Shaw N. Prevalence and predictors of vitamin D insufficiency in children: a Great Britain population based study. PLoS ONE. 2011;6:e22179. doi: 10.1371/journal.pone.0022179. [DOI] [PMC free article] [PubMed] [Google Scholar]
- 3.Whiting SJ, Langlois KA, Vatanparast H, Greene-Finestone LS. The vitamin D status of Canadians relative to the 2011 Dietary Reference Intakes: an examination in children and adults with and without supplement use. Am J Clin Nutr. 2011;94:128–35. doi: 10.3945/ajcn.111.013268. [DOI] [PubMed] [Google Scholar]
- 4.Looker AC, Johnson CL, Lacher DA, Pfeiffer CM, Schleicher RL, Sempos CT. Vitamin D status: United States, 2001-2006. NCHS Data Brief. 2011:1–8. [PubMed] [Google Scholar]
- 5.Pollock NK, Laing EM, Taylor RG, Baile CA, Hamrick MW, Hall DB, Lewis RD. Comparisons of trabecular and cortical bone in late adolescent black and white females. J Bone Miner Metab. 2011;29:44–53. doi: 10.1007/s00774-010-0186-z. [DOI] [PubMed] [Google Scholar]
- 6.Wetzsteon RJ, Hughes JM, Kaufman BC, Vazquez G, Stoffregen TA, Stovitz SD, Petit MA. Ethnic differences in bone geometry and strength are apparent in childhood. Bone. 2009;44:970–5. doi: 10.1016/j.bone.2009.01.006. [DOI] [PubMed] [Google Scholar]
- 7.Leonard MB, Elmi A, Mostoufi-Moab S, Shults J, Burnham JM, Thayu M, Kibe L, Wetzsteon RJ, Zemel BS. Effects of sex, race, and puberty on cortical bone and the functional muscle bone unit in children, adolescents, and young adults. J Clin Endocrinol Metab. 2010;95:1681–9. doi: 10.1210/jc.2009-1913. [DOI] [PMC free article] [PubMed] [Google Scholar]
- 8.van der Sluis IM, Hop WC, van Leeuwen JP, Pols HA, de Muinck Keizer-Schrama SM. A cross-sectional study on biochemical parameters of bone turnover and vitamin d metabolites in healthy dutch children and young adults. Horm Res. 2002;57:170–9. doi: 10.1159/000058378. [DOI] [PubMed] [Google Scholar]
- 9.Foo LH, Zhang Q, Zhu K, Ma G, Hu X, Greenfield H, Fraser DR. Low vitamin D status has an adverse influence on bone mass, bone turnover, and muscle strength in Chinese adolescent girls. J Nutr. 2009;139:1002–7. doi: 10.3945/jn.108.102053. [DOI] [PubMed] [Google Scholar]
- 10.Ginty F, Cavadini C, Michaud PA, Burckhardt P, Baumgartner M, Mishra GD, Barclay DV. Effects of usual nutrient intake and vitamin D status on markers of bone turnover in Swiss adolescents. Eur J Clin Nutr. 2004;58:1257–65. doi: 10.1038/sj.ejcn.1601959. [DOI] [PubMed] [Google Scholar]
- 11.Molgaard C, Larnkjaer A, Cashman KD, Lamberg-Allardt C, Jakobsen J, Michaelsen KF. Does vitamin D supplementation of healthy Danish Caucasian girls affect bone turnover and bone mineralization? Bone. 2010;46:432–9. doi: 10.1016/j.bone.2009.08.056. [DOI] [PubMed] [Google Scholar]
- 12.Schou AJ, Heuck C, Wolthers OD. Vitamin D supplementation to healthy children does not affect serum osteocalcin or markers of type I collagen turnover. Acta Paediatr. 2003;92:797–801. [PubMed] [Google Scholar]
- 13.Barnes MS, Robson PJ, Bonham MP, Strain JJ, Wallace JM. Effect of vitamin D supplementation on vitamin D status and bone turnover markers in young adults. Eur J Clin Nutr. 2006;60:727–33. doi: 10.1038/sj.ejcn.1602374. [DOI] [PubMed] [Google Scholar]
- 14.Tanner J. Growth at Adolescence. Oxford: Blackwell; 1962. [Google Scholar]
- 15.Park CY, Hill KM, Elble AE, Martin BR, DiMeglio LA, Peacock M, McCabe GP, Weaver CM. Daily supplementation with 25 mug cholecalciferol does not increase calcium absorption or skeletal retention in adolescent girls with low serum 25-hydroxyvitamin D. J Nutr. 2010;140:2139–44. doi: 10.3945/jn.110.124891. [DOI] [PubMed] [Google Scholar]
- 16.Baroncelli GI, Bertelloni S, Ceccarelli C, Amato V, Saggese G. Bone turnover in children with vitamin D deficiency rickets before and during treatment. Acta Paediatr. 2000;89:513–8. doi: 10.1080/080352500750027763. [DOI] [PubMed] [Google Scholar]
- 17.Ross AC, Taylor CL, Yaktine AL, Del Valle HB. In: Institute of Medicine Dietary Reference Intakes for Calcium and Vitamin D. Ross AC, Taylor CL, Yaktine AL, Del Valle HB, editors. National Academy Press; 2011. [PubMed] [Google Scholar]
- 18.Rajakumar K, Fernstrom JD, Holick MF, Janosky JE, Greenspan SL. Vitamin D status and response to Vitamin D(3) in obese vs. non-obese African American children. Obesity (Silver Spring) 2008;16:90–5. doi: 10.1038/oby.2007.23. [DOI] [PubMed] [Google Scholar]
- 19.Weaver CM, Peacock M, Martin BR, Plaweki KL, McCabe GP. Calcium retention estimated from indicators of skeletal status in adolescent girls and young women. Am J Clin Nutr. 1996;64:67–70. doi: 10.1093/ajcn/64.1.67. [DOI] [PubMed] [Google Scholar]