
Figure 1.
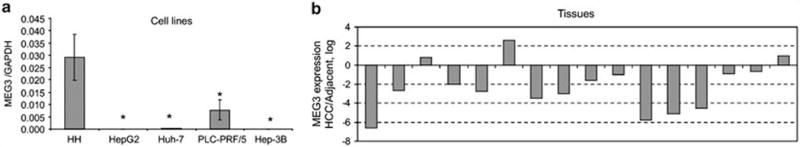
MEG3 expression is reduced in HCC. (a) MEG3 expression was assessed by real time PCR using SYBRGreen (Clontech, Mountain View, CA, USA) in human normal hepatocytes (HH) and HCC cells and expression was normalized to that of GAPDH. Bars represent mean and standard error of three samples. *P<0.05 relative to HH. (b) RNA was extracted with Trizol from human HCC and adjacent, cirrhotic tissues. MEG3 expression was assessed by real time PCR and normalized to GAPDH. Bars represent the ratio between expression in HCC and in adjacent tissue (log scale).