
Figure 2.
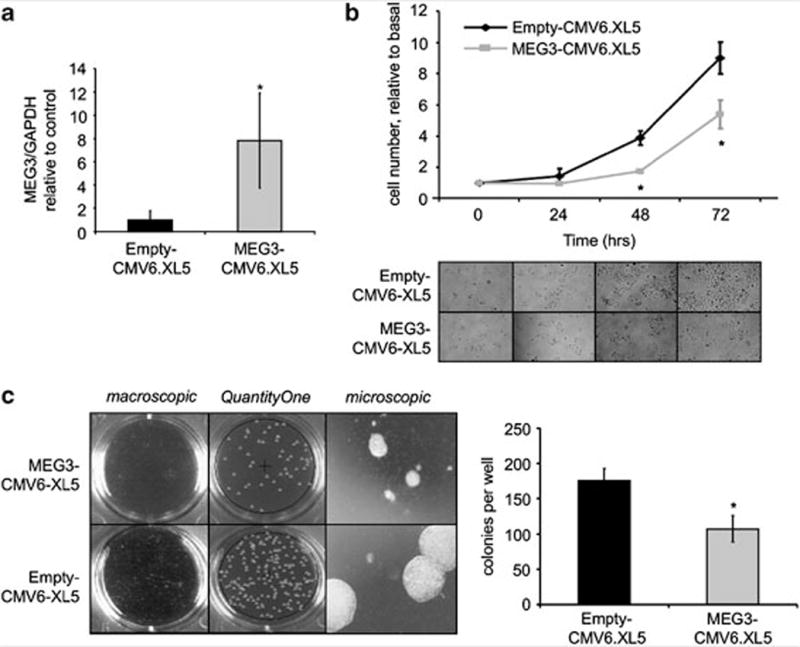
Overexpression of MEG3 decreases cell growth. PLC/PRF/5 cells were transfected with 1 μg of MEG3-CMV6.XL5 or empty vector (Origene, Rockville, MD, USA) using the Nucleofector system, solution V program T28 (Amaxa Biosystems, Koln, Germany). (a) After 24 h of transfection, cells were collected and MEG3 expression was assessed by real time PCR. Bars represent mean and standard error of three independent experiments, relative to control. *P<0.05 relative to control. (b) At 24 h after transfection, cells were plated in 12-well plates (10 000 cells/well). After 24, 48 and 72 h, cells were counted by trypan blue staining. Mean values of three independent experiments with standard errors are represented. *P<0.05 compared with control. (c) After 24 h of transfection, cells were seeded in six-well plates (5000 per well) in soft agar with 20% fetal bovine serum. The final concentration of the agar system was 1.2% for the bottom layer and 0.8% for the cell suspension layer. Colonies were imaged using the GelDoc Imaging system (Bio-Rad, Hercules, CA, USA) and quantitated using the QuantityOne software (Bio-rad). Bars represent mean and standard error of three independent experiments, relative to control. *P<0.05 relative to control.